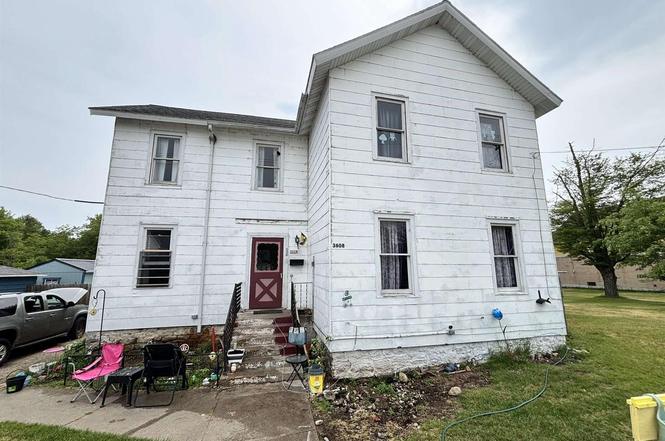
3608 13th St · Menominee, MI
Flood risk 1/10 · Minimal
- FEMA flood zone
- X (unshaded)
- Chance of flooding over 30 yrs
- 0.0%
- Est. flood insurance / yr
- $473 – $860
Fire risk 1/10 · Minimal
- Est. fire insurance / yr
- $784 – $1,456
Heat risk 1/10 · Minimal
- Hot days now (above 93°F)
- 7 days/yr
- Hot days in 30 yrs
- 13 days/yr
Wind risk 1/10 · Minimal
- Chance of severe wind over 30 yrs
- —
Air-quality risk 2/10 · Minimal
- Unhealthy air days now
- 0 days/yr
- Unhealthy air days in 30 yrs
- 1 days/yr
Risk factors via First Street. Map © Google.
Why this score? — see what drove the C+ grade
The composite is a weighted blend of 9 inputs, each scored 0–100. Each bar is that input's sub-score; the figure is the points it added to the 100-point composite (weight × sub-score).
- Cash flow +26.3/30.0
- DSCR +8.9/10.0
- ARV discount +7.5/15.0
- 1% rule +7.0/10.0
- Livability +3.6/5.0
- Schools +2.9/10.0
- Rent growth +2.5/5.0
- Condition / age +2.5/5.0
- Appreciation +0.0/10.0
$120,000
🖨 Deal sheet (PDF) 📄 Offer letter ✓ Due diligence
Listing remarks MLS
* EXCELLENT LOCATION * FULLY FENCED IN YARD * NICE SWIMMING POOL & DECK * NEWER WINDOWS, 200 AMP SERVICE UPDATED. * NEWER ENERGY EFFICIENT FURNACE.
Key facts
- Exposed floor joist
- Beautiful stairway
- Exposed plywood
Tags
Property features AI
Finance
- Other: Appliances are excluded from sale at this time (sellers' personal property)
Exterior
- Parking: Detached 1-car garage
- Utilities: Municipal water; Municipal sewer; Natural gas
- Home design: Two-story single-family home; Construction completed
- Construction: Assessor/public record listed year built; Partial finished above-grade area (~1,527 finished above-grade square feet)
- Exterior features: Cedar exterior; Property under 1/2 acre (approximately 0.33 acre)
Interior
- Bedrooms: Main-level primary bedroom (18 x 13); Upper-level bedroom (17 x 13); Upper-level bedroom (17 x 13); Upper-level bedroom (14 x 10)
- Bathrooms: One full bathroom; One half bathroom
- Heating & cooling: Forced air heating; Natural gas heat
- Interior features: Partial block basement
Neighborhood map
What this means for you Summary
Snapshot
- This is a 3-bed/2.0-bath single-family listed at $120k.
Deal economics
- At list price, monthly cash flow is $309 ($4k/yr) — positive.
- The deal already cash-flows at list — no discount required.
- Meets the 1% rule at list price ($1k rent vs $120k).
- Cap rate 9.4% vs local median 4.0% in Menominee — top-decile yield for the area; either an underpriced asset or a hidden risk that comps aren't pricing in. Stress-test before assuming the spread holds.
Location & tenants
- Location reads 71/100 on livability (#282 in MI) — a middle-class / working-renter tenant base. Strengths: cost of living A+, housing A+, health & safety A+; Watch: schools C-, amenities F, commute F.
- Menominee Area Public Schools (town): math 26% / reading 42% proficiency, ranked #312 of 540 in MI (top 58%) — families likely to look elsewhere, expect single-tenant / working-renter base with shorter leases.
- Market conditions: 64 active listings in the ZIP; 26 units permitted in Menominee County in 2024 (0 in 5+ unit buildings).
Forward outlook
- Local home prices are declining (-3.0%/yr); year-one equity from $830 of loan paydown is wiped out by about $4k of value loss. Plan a longer hold.
- Menominee County population projected at -19% by 2050 — secular population decline; favor cash flow + early exit over multi-decade hold.
- At projected returns (-3.0% appreciation + 3.0% rent growth), your $34k cash investment doubles in ~10 years — after that, you're playing with house money.
Negotiation context
- Only 6 days on market — expect competitive offers; lowballing is unlikely to land.
- 2 sale attempts since 26y ago with the ask held roughly flat each time — persistent listings suggest the price (not the market) is what's stuck; bring a comps-based counter.
- Current owner paid $63k; list at $120k implies a 91% gain — meaningful room to come down on a strong offer.
Risks & watch-outs
- Watch-outs: built in 1903 — expect roof / HVAC / electrical / plumbing capex.
Questions for the listing agent
- Built in 1903 — when were the roof, HVAC, electrical panel, plumbing, and water heater last replaced?
- Is there a deadline driving the sale (1031 exchange, divorce, estate, relocation)? That informs how much negotiation room exists.
- What's the average days-on-market for RENTAL listings here right now (not sales)? A rising rental-DOM trend means longer vacancies and softer asking-rent achievability than the comps imply.
- What's the recent tenant-quality profile in this submarket — average credit score on applications, eviction rate, late-payment / NSF rate, and stable-employment percentage? A property-management company in the area should have these aggregated.
- How much new for-sale + rental construction is in the pipeline within 1–3 miles? Heavy new supply typically softens prices + rents 12–24 months out; constrained supply supports both.
Investment metrics
- 1% rule
- 1.20% ✓
- Cap rate
- 9.38%
- Cash-on-cash
- 11.03%
- DSCR
- 1.49
- GRM
- 6.9
CMA / ARV
- ARV (on-the-fly)
- $406,770
- Comps found
- 1
Show comp detail 1 sale within ~0.75 mi
| Address | Dist | Beds/Ba | Sqft | Sold | Price | $/sf | Match |
|---|---|---|---|---|---|---|---|
| 4003 Michigan Shores Dr | 0.51mi | 3/2.5 | 2,386 (-13%) | 7mo | $355,000 | $149 | 47 |
Match score weights: distance 35% · size 25% · config 20% · recency 20%. Top-matched comps best support the ARV.
Projected returns pro-forma
-3.0% appreciation · 3.0% rent growth · sell at horizon
- IRR
- 0.2%
- Equity multiple
- 1.01×
- Total profit
- $243
- Equity at exit
- $17,892
- IRR
- 9.9%
- Equity multiple
- 1.76×
- Total profit
- $25,622
- Equity at exit
- $10,375
Cash invested: $33,600 (down + closing). Projections, not guarantees.
Landlord ↔ Tenant lean methodology
- Overall (STATE)
- 62 Landlord-Friendly
- State Michigan
- 62 Landlord-Friendly · EVEN
- County
- — inherits STATE
- City
- — inherits STATE
ZIP-level market 49858
- Home prices YoY
- -31.4%
- Active inventory
- 64
- Price-to-rent
- 6.9×
Monthly cashflow live
- Estimated rent
- $1,441 medium interval (Pro) →
- Mortgage (P&I)
- −$629
- Tax est. 1.5%
- −$150 /mo · $1,800/yr
- Insurance
- −$50
- HOA
- −$0
- Vacancy / Maint / Mgmt
- −$303
- Net cashflow
- $309
Break-even live
Sensitivity live
| Price | -10% $392 | -5% $350 | +0% $309 | +5% $267 | +10% $226 |
|---|---|---|---|---|---|
| Rent | -10% $195 | -5% $252 | +0% $309 | +5% $366 | +10% $423 |
| Rate | -1.0pp $369 | -0.5pp $339 | base $309 | +0.5pp $278 | +1.0pp $246 |
UW: 25.0% down · 7.5% · 30yr · 1.5% tax · 5.0% vac · 8.0% maint · 8.0% mgmt
Financing live
Cash to close
- Down payment
- $30,000
- Closing costs
- $3,600
- Reserves months
- —
- Total cash needed
- —
Loan-product check · same deal, 3 products live
Conventional
25% down · 7.5% · 30yr
- Down + closing
- —
- Monthly P&I
- —
- Monthly cashflow
- —
- DSCR
- —
- Eligible?
- —
Personal DTI + credit; lowest rate.
DSCR
20% down · 8.5% · 30yr
- Down + closing
- —
- Monthly P&I
- —
- Monthly cashflow
- —
- DSCR
- —
- Eligible?
- —
No personal income docs; deal must DSCR.
Hard money
10% down · 12.0% · 12mo
- Down + closing
- —
- Monthly P&I
- —
- Monthly cashflow
- —
- DSCR
- —
- Eligible?
- —
Short-term bridge; refi at stabilization.
Listing history 6 events
-
2026-06-21days on market $120,000 Active 6 DOM
-
2026-06-19days on market $120,000 Active 4 DOM
-
2026-06-18days on market $120,000 Active 3 DOM
-
2026-06-17days on market $120,000 Active 2 DOM
-
2026-06-16remarks 420-char remark
-
2026-06-16$120,000 Active 1 DOM
ⓘ Source: listings_history table (triggers on properties + properties_extension) + one-shot
backfill from property_details.listing_events for pre-trigger history.
Climate risk First Street
- Flood 1/10 Low FEMA zone X (unshaded) · 0% chance over 30 yrs
- Wildfire 1/10 Low
- Heat 1/10 Low 7 d/yr ≥93°F today · 13 d/yr by 30 yrs out
- Wind 1/10 Low
- Air quality 2/10 Low 0 unhealthy d/yr today · 1 by 30 yrs out
Nearby sold comps map
Loading sold comps map…
Walkable amenities ~0.75 mi
Loading nearby amenities…
Taxation est. · year 1
- Rental income
- $17,287
- − Mortgage interest
- −$6,722
- − Property taxes
- −$1,800
- − Insurance
- −$600
- − Repairs & maintenance
- −$1,383
- − Management
- −$1,383
- − Depreciation
- −$3,491
- Taxable income
- $1,908
- Est. tax owed @ 24.0%
- −$458
- After-tax cash flow
- $3,247/yr
For passive investors: Depreciation is non-cash, so a rental often shows a tax loss while cash-flowing — sheltering income. Rental losses are passive: they offset passive income freely, and up to $25,000/yr can offset ordinary (W-2) income if you actively participate and your MAGI is under $100k (phasing out to $0 by $150k); unused losses carry forward. On sale, claimed depreciation is recaptured at up to 25%, and gains may owe capital-gains tax (a 1031 exchange can defer both). Figures are a year-1 estimate at your 24.0% rate — not tax advice; consult a CPA.
Schools (NCES district)
- District
- Menominee Area Public Schools
- NCES district ID
- 2623550
- Math proficiency
- 26% ▼ -6.00%
- Reading proficiency
- 42% ▼ -3.00%
- Median HH income
- $41,809
- Composite
- 28.68/100
- National rank
- #6694
- State rank
- #312 of 540 in MI
Livability — Menominee
- Score
- 71/100
- State rank
- #282
- US rank
- #6909
Category grades
Schools grade is shown separately in the Schools card above.
Census & demographics
- Census place
- Menominee, MI
- Population (ZIP)
- 11,870
Population outlook (Menominee County) Hauer SSP2
- Today (2025)
- 22,668 people
- By 2030
- 21,986 · -3.0%
- By 2040
- 20,196 · -10.9%
- By 2050
- 18,335 · -19.1%
- By 2075
- 14,771 · -34.8%
- By 2100
- 10,999 · -51.5%
Race, ethnicity, and origin ACS 2023
- Neighborhood character
- Predominantly White (95%)
- Race & ethnicity
- White 95% Two or more races 4% Hispanic / Latino 2%
- Common ancestry
- Lithuanian 8% Romanian 7% Portuguese 4%
- Foreign-born
- 2% · Canada
- Languages at home
- 99% English-only · French/Haitian/Cajun 1%
Political lean MEDSL · Menominee
- 2024 margin
- Solid R (+33.6) · D 32.6% · R 66.2% · Other 1.2%
- 2008→2024 swing
- -43.8pp toward R · 2008: 10.2pp · 2024: -33.6pp
- All cycles
- 2024: R+33.6 2020: R+30.1 2016: R+29.4 2012: R+2.9 2008: D+10.2
Not yet ingested
- Civics
- —
Market trends
- HPI YoY
- ▼ -94.34%
- Current HPI
- 206.2461
- Rent YoY
- —
- Metro
- —
- State GDP YoY
- ▲ 1.37%
- F500 in state
- 28
Industry mix (Fortune 500 HQ in MI)
| Industry | F500 HQs | Revenue |
|---|---|---|
| Automotive Parts | 3 | $48B |
|
||
| Automotive | 2 | $372B |
|
||
| Chemicals | 1 | $45B |
|
||
| Automotive Retail | 1 | $29B |
|
||
| Healthcare / Medical Devices | 1 | $23B |
|
||
| Automotive Technology | 1 | $20B |
|
||
Price history
+700.0% since first listed6 events — show timeline
- 2026-06-12 Listed $120,000 RANW
- 2015-11-12 Sold (Public Records) $62,700 Public Records
- 2001-09-28 Sold (Public Records) $53,450 Public Records
- 2001-09-28 Sold (MLS) $53,450 METROMLS
- 2000-05-19 Listed $53,900 METROMLS
- 1994-04-20 Sold (Public Records) $15,000 Public Records
Cash-flow waterfall
monthlySold comps — $/sqft
last 12 mo · ≤1 miLoading sold comps…