2050 W State Route 89a -- #167 · Cottonwood, AZ
Flood risk No data
- FEMA flood zone
- —
- Chance of flooding over 30 yrs
- —
- Est. flood insurance / yr
- —
Fire risk No data
- Est. fire insurance / yr
- —
Heat risk No data
- Hot days now (above threshold)
- —
- Hot days in 30 yrs
- —
Wind risk No data
- Chance of severe wind over 30 yrs
- —
Air-quality risk No data
- Unhealthy air days now
- —
- Unhealthy air days in 30 yrs
- —
Risk factors via First Street. Map © Google.
Why this score? — see what drove the B grade
The composite is a weighted blend of 9 inputs, each scored 0–100. Each bar is that input's sub-score; the figure is the points it added to the 100-point composite (weight × sub-score).
- Cash flow +28.5/30.0
- ARV discount +12.6/15.0
- DSCR +10.0/10.0
- 1% rule +7.9/10.0
- Livability +4.0/5.0
- Condition / age +4.0/5.0
- Rent growth +2.4/5.0
- Schools +1.9/10.0
- Appreciation +0.0/10.0
$180,000
🖨 Deal sheet 📄 Offer letter ✓ Due diligence
Listing remarks
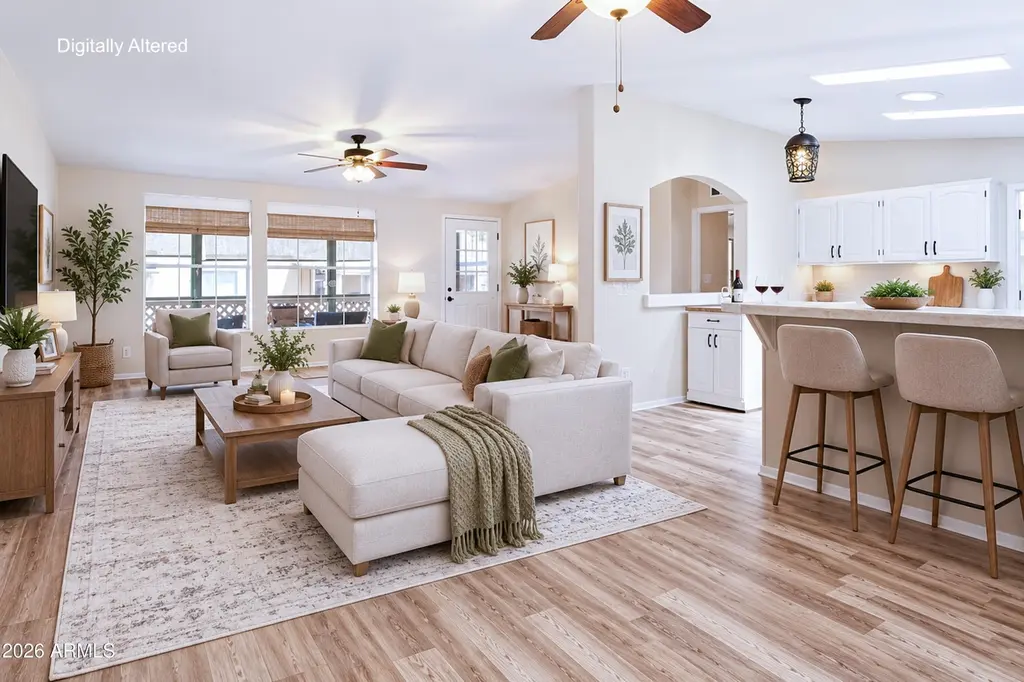
Meticulously maintained and fully updated 1,560 sq. ft. home in desirable Pine Shadows 55+ community! Surrounded by beautiful ponderosa pines, this bright open floor plan features skylights, fresh interior and exterior paint, new flooring, and updated lighting. Spacious kitchen offers a work island, breakfast bar, new sink, and new dishwasher. Living room opens to a covered, fenced front porch, while the dining area features a new slider to the covered back deck. Primary suite includes a large bath, walk-in closet, and extra storage. Updates include HVAC, water heater, dishwasher (2021). Landscaped with pavers, front patio, two carports, and heated/cooled shed. Community amenities include a
Key facts
- Work island
- New sink
- New dishwasher
Tags
Property features AI
Finance
- Financial info: Current financing: Non-assumable
- HOA & community: Land lease community (monthly land lease $825); Association covers trash and water; Community pool; Community pickleball and tennis courts; Community fitness center; Community media room
Exterior
- Parking: 2 covered parking spaces; 2 open parking spaces; 2 carport spaces
- Security: Gated community
- Utilities: City water; Public sewer
- Home design: Manufactured / mobile home; Fee simple ownership; Mountain view; Asphalt road access
- Construction: Wood frame construction; Painted exterior; Composition roof
- Exterior features: Private pickleball court; Private street; Shed(s); Sprinklers in front with auto timer; Desert front landscaping; City-maintained road
Interior
- Kitchen: Refrigerator; Dishwasher; Garbage disposal; Pantry
- Bedrooms: Up to 3 possible bedrooms
- Flooring: Laminate
- Bathrooms: 2 full bathrooms
- Heating & cooling: Central air; Ceiling fans; Has heating
- Interior features: Pantry; 3/4 bath in primary bedroom; Skylights; Dual-pane windows; Storage
- Laundry & utility: Indoor laundry
Neighborhood map
What this means for you Summary
Snapshot
- This is a 3-bed/2.0-bath manufactured listed at $180k. Condition is rated good.
Deal economics
- At list price, monthly cash flow is $589 ($7k/yr) — positive.
- The deal already cash-flows at list — no discount required.
- Meets the 1% rule at list price ($2k rent vs $180k).
- Recommended offer: $177k (1.5% below list) — sets the bar for market timing.
- Cap rate 10.2% vs local median 3.8% in Cottonwood — top-decile yield for the area; either an underpriced asset or a hidden risk that comps aren't pricing in. Stress-test before assuming the spread holds.
Location & tenants
- Location reads 79/100 on livability (#7 in AZ, #2,176 nationally) — a middle-class / working-renter tenant base. Strengths: health & safety A+, commute A, cost of living A; Watch: employment D, amenities F.
- Cottonwood-Oak Creek Elementary District (4487) (town): math 17% / reading 28% proficiency, ranked #174 of 249 in AZ (top 70%) — low school quality limits family demand, transient renter base, plan for 1-2y turnover.
- Market conditions: Rents soft (-0.2%/yr); 266 active listings in the ZIP; 6 comparable units currently listed for rent nearby; rentals leasing fast (median 14d on market — plan ~1-2 weeks tenant-placement turnaround); 2,062 units permitted in Yavapai County in 2024 (98 in 5+ unit buildings).
- At $2,321/mo this rent would consume 49% of the median local household income ($57k/yr) (locally 894% of renters already pay >50% of income on rent) — very limited rent-growth headroom before tenants either downsize or default.
Forward outlook
- Local home prices are declining (-3.0%/yr); year-one equity from $1k of loan paydown is wiped out by about $5k of value loss. Plan a longer hold.
- Yavapai County population projected at +10% by 2050 — modest demand growth; plan on rents tracking national, not racing it.
Negotiation context
- It's been on market 20 days — a 2% lower offer ($177k) is reasonable based on typical stale-listing flexibility.
Questions for the listing agent
- Is there a deadline driving the sale (1031 exchange, divorce, estate, relocation)? That informs how much negotiation room exists.
- What's the average days-on-market for RENTAL listings here right now (not sales)? A rising rental-DOM trend means longer vacancies and softer asking-rent achievability than the comps imply.
- What's the recent tenant-quality profile in this submarket — average credit score on applications, eviction rate, late-payment / NSF rate, and stable-employment percentage? A property-management company in the area should have these aggregated.
- How much new for-sale + rental construction is in the pipeline within 1–3 miles? Heavy new supply typically softens prices + rents 12–24 months out; constrained supply supports both.
Investment metrics
- 1% rule
- 1.29% ✓
- Cap rate
- 10.22%
- Cash-on-cash
- 14.04%
- DSCR
- 1.62
- GRM
- 6.5
CMA / ARV
- ARV (on-the-fly)
- $202,800
- Comps found
- 12
Show comp detail 12 sales within ~0.75 mi
| Address | Dist | Beds/Ba | Sqft | Sold | Price | $/sf | Match |
|---|---|---|---|---|---|---|---|
| 2050 W SR 89-a -- #96 | 0.26mi | 3/2.0 | 1,568 (+0%) | 1mo | $155,000 | $99 | 86 |
| 1024 Rankin Ave | 0.17mi | 3/2.0 | 1,605 (+3%) | 2mo | $199,900 | $125 | 86 |
| 2050 W SR 89a -- #104 | 0.00mi | 2/2.0 (-1) | 1,456 (-7%) | 1mo | $118,000 | $81 | 83 |
| 1216 Hogan Dr | 0.20mi | 2/2.0 (-1) | 1,600 (+3%) | 1mo | $248,000 | $155 | 81 |
| 992 Trevino Dr | 0.13mi | 3/2.0 | 1,431 (-8%) | 3mo | $195,000 | $136 | 78 |
| 880 W On The Greens Blvd | 0.31mi | 3/2.0 | 1,620 (+4%) | 2mo | $249,900 | $154 | 77 |
| 2050 W State Route 89-a -- #344 | 0.26mi | 3/2.0 | 1,680 (+8%) | 2mo | $200,000 | $119 | 74 |
| 972 Trevino Dr | 0.13mi | 3/2.0 | 1,382 (-11%) | 2mo | $179,900 | $130 | 73 |
| 1065 Crenshaw Ave | 0.49mi | 3/2.0 | 1,440 (-8%) | 2mo | $180,000 | $125 | 63 |
| 2050 W State Route 89a -- #86 | 0.26mi | 3/2.0 | 1,344 (-14%) | 2mo | $35,000 | $26 | 63 |
| 700 W On The Greens Blvd | 0.51mi | 2/2.0 (-1) | 1,720 (+10%) | 1mo | $277,500 | $161 | 54 |
| 2050 W State Route 89a -- #152 | 0.48mi | 2/2.0 (-1) | 1,344 (-14%) | 0mo | $205,000 | $153 | 49 |
Match score weights: distance 35% · size 25% · config 20% · recency 20%. Top-matched comps best support the ARV.
Projected returns pro-forma
-3.0% appreciation · 0.0% rent growth · sell at horizon
- IRR
- 0.9%
- Equity multiple
- 1.03×
- Total profit
- $1,611
- Equity at exit
- $26,839
- IRR
- 7.2%
- Equity multiple
- 1.47×
- Total profit
- $23,606
- Equity at exit
- $15,563
Cash invested: $50,400 (down + closing). Projections, not guarantees.
Landlord ↔ Tenant lean methodology
- Overall (STATE)
- 87 Strongly Landlord-Friendly
- State Arizona
- 87 Strongly Landlord-Friendly · R+3
- County
- — inherits STATE
- City
- — inherits STATE
ZIP-level market 86326
- Home prices YoY
- -32.2%
- Rents YoY
- -0.2%
- Active inventory
- 266
- Price-to-rent
- 6.5×
Monthly cashflow live
- Estimated rent
- $2,321 high interval (Pro) →
- Mortgage (P&I)
- −$944
- Tax est. 1.5%
- −$225 /mo · $2,700/yr
- Insurance
- −$75
- HOA
- −$0
- Vacancy / Maint / Mgmt
- −$487
- Net cashflow
- $589
Break-even live
UW: 25.0% down · 7.5% · 30yr · 1.5% tax · 5.0% vac · 8.0% maint · 8.0% mgmt
Financing live
Cash to close
- Down payment
- $45,000
- Closing costs
- $5,400
- Reserves months
- —
- Total cash needed
- —
Loan-product check · same deal, 3 products live
Conventional
25% down · 7.5% · 30yr
- Down + closing
- —
- Monthly P&I
- —
- Monthly cashflow
- —
- DSCR
- —
- Eligible?
- —
Personal DTI + credit; lowest rate.
DSCR
20% down · 8.5% · 30yr
- Down + closing
- —
- Monthly P&I
- —
- Monthly cashflow
- —
- DSCR
- —
- Eligible?
- —
No personal income docs; deal must DSCR.
Hard money
10% down · 12.0% · 12mo
- Down + closing
- —
- Monthly P&I
- —
- Monthly cashflow
- —
- DSCR
- —
- Eligible?
- —
Short-term bridge; refi at stabilization.
Rent comps 6 comps
| Address | Beds | Baths | Sqft | Rent | $/sqft | DOM | Units | Dist |
|---|---|---|---|---|---|---|---|---|
| 992 Sterling Ln Cottonwood, AZ | 3.0 | 2.0 | 1652 | $2,395 | $1.45 | 21d | 1 | 0.23mi |
| 1910 W Trail Blazer Dr Cottonwood, AZ | 2.0 | 2.0 | 1278 | $2,900 | $2.27 | 13d | 1 | 0.95mi |
| 255 S Cottonwood Ranch Rd Cottonwood, AZ | 3.0 | 2.0 | 1695 | $2,195 | $1.29 | 13d | 1 | 0.98mi |
| 1121 Old Jerome Hwy Clarkdale, AZ | 2.0 | 2.0 | 1981 | $2,185 | $1.10 | 21d | 1 | 1.28mi |
| 844 Tiablanca Rd Clarkdale, AZ | 2.0 | 2.0 | 1333 | $1,995 | $1.50 | 13d | 1 | 1.34mi |
| 564 Crossbar Ln Cottonwood, AZ | 3.0 | 2.0 | 1290 | $2,250 | $1.74 | 13d | 1 | 1.50mi |
Listing history 17 events
-
2026-06-18days on market $180,000 Active 20 DOM
-
2026-06-17days on market $180,000 Active 19 DOM
-
2026-06-16days on market $180,000 Active 18 DOM
-
2026-06-15days on market $180,000 Active 17 DOM
-
2026-06-14days on market $180,000 Active 15 DOM
-
2026-06-13days on market $180,000 Active 14 DOM
-
2026-06-10days on market $180,000 Active 12 DOM
-
2026-06-09days on market $180,000 Active 11 DOM
-
2026-06-08days on market $180,000 Active 10 DOM
-
2026-06-07days on market $180,000 Active 9 DOM
-
2026-06-05days on market $180,000 Active 6 DOM
-
2026-06-03days on market $180,000 Active 5 DOM
-
2026-06-02days on market $180,000 Active 4 DOM
-
2026-06-01days on market $180,000 Active 3 DOM
-
2026-05-31days on market $180,000 Active 2 DOM
-
2026-05-30remarks 699-char remark
-
2026-05-30$180,000 Active 1 DOM
ⓘ Source: listings_history table (triggers on properties + properties_extension) + one-shot
backfill from property_details.listing_events for pre-trigger history.
Nearby sold comps map
Loading sold comps map…
Walkable amenities ~0.75 mi
Loading nearby amenities…
Taxation est. · year 1
- Rental income
- $27,850
- − Mortgage interest
- −$10,083
- − Property taxes
- −$2,700
- − Insurance
- −$900
- − Repairs & maintenance
- −$2,228
- − Management
- −$2,228
- − Depreciation
- −$5,236
- Taxable income
- $4,475
- Est. tax owed @ 24.0%
- −$1,074
- After-tax cash flow
- $6,000/yr
For passive investors: Depreciation is non-cash, so a rental often shows a tax loss while cash-flowing — sheltering income. Rental losses are passive: they offset passive income freely, and up to $25,000/yr can offset ordinary (W-2) income if you actively participate and your MAGI is under $100k (phasing out to $0 by $150k); unused losses carry forward. On sale, claimed depreciation is recaptured at up to 25%, and gains may owe capital-gains tax (a 1031 exchange can defer both). Figures are a year-1 estimate at your 24.0% rate — not tax advice; consult a CPA.
Condition & rehab AI · 12 photos
This meticulously maintained and fully updated home in the desirable Pine Shadows 55+ community is move-in ready with new flooring, appliances, and landscaping.
Value-add opportunities
- Both Landscaping and front patio — Enhances curb appeal and outdoor living space.
- Resale New kitchen appliances — Improves functionality and aesthetic appeal.
- Resale Painting — Fresh paint enhances curb appeal and interior aesthetics.
- Rental Landscaping and front patio — Attracts tenants with a well-maintained and inviting exterior.
Renovation cost estimate screening
Value-add ROI direction
- Both Landscaping and front patio — Enhances curb appeal and outdoor living space. ↑
- Resale New kitchen appliances — Improves functionality and aesthetic appeal. ↑
- Resale Painting — Fresh paint enhances curb appeal and interior aesthetics. ↑
- Rental Landscaping and front patio — Attracts tenants with a well-maintained and inviting exterior. ↑
ⓘ Cost ranges are severity-bucket heuristics (US national rule-of-thumb). Get contractor quotes + a written scope before underwriting a rehab budget.
Schools (NCES district)
- District
- Cottonwood-Oak Creek Elementary District (4487)
- NCES district ID
- 0402370
- Math proficiency
- 17% ▼ -10.00%
- Reading proficiency
- 28% ▼ -7.00%
- Median HH income
- $41,740
- Composite
- 19.16/100
- National rank
- #8822
- State rank
- #174 of 249 in AZ
Livability — Cottonwood
- Score
- 79/100
- State rank
- #7
- US rank
- #2176
Category grades
Schools grade is shown separately in the Schools card above.
Census & demographics
- Census place
- Cottonwood, AZ
- County
- Yavapai County · 190,406 people
- City population
- 24,852
- Metro
- Prescott Valley-Prescott, AZ
- Population (ZIP)
- 24,852
- Household income
- $57,378
- Rent vs Own
- Severe rent burden
- 894.0
Population outlook (Yavapai County) Hauer SSP2
- Today (2025)
- 241,389 people
- By 2030
- 249,523 · +3.4%
- By 2040
- 259,966 · +7.7%
- By 2050
- 264,736 · +9.7%
- By 2075
- 269,334 · +11.6%
- By 2100
- 256,505 · +6.3%
Race, ethnicity, and origin ACS 2023
- Neighborhood character
- Predominantly White (73%)
- Race & ethnicity
- White 73% Hispanic / Latino 20% Two or more races 14% Native American 1%
- Hispanic origin (detail)
- Mexican 17%
- Common ancestry
- Italian 3% Romanian 3% Lithuanian 2%
- Foreign-born
- 12% · Canada
- Languages at home
- 84% English-only · Spanish 14% German/W. Germanic 1%
Political lean MEDSL · Yavapai
- 2024 margin
- Solid R (+33.9) · D 32.6% · R 66.5%
- 2008→2024 swing
- -9.5pp toward R · 2008: -24.4pp · 2024: -33.9pp
- All cycles
- 2024: R+33.9 2020: R+29.3 2016: R+31.4 2012: R+30.7 2008: R+24.4
Not yet ingested
- Civics
- —
Market trends
- HPI YoY
- ▼ -165.27%
- Current HPI
- 347.5058
- Rent YoY
- ▼ -0.22%
- Metro
- Prescott Valley-Prescott, AZ
- State GDP YoY
- ▲ 4.54%
- F500 in state
- 20
Industry mix (Fortune 500 HQ in AZ)
| Industry | F500 HQs | Revenue |
|---|---|---|
| Technology | 2 | $13B |
|
||
| Mining / Metals | 1 | $23B |
|
||
| Environmental Services | 1 | $16B |
|
||
| Metals / Steel | 1 | $14B |
|
||
| Technology Distribution | 1 | $9B |
|
||
| Homebuilding | 1 | $8B |
|
||
Price history
1 event — show timeline
- 2026-05-29 Listed $180,000 ARMLS
Cash-flow waterfall
monthlySold comps — $/sqft
last 12 mo · ≤1 miLoading sold comps…