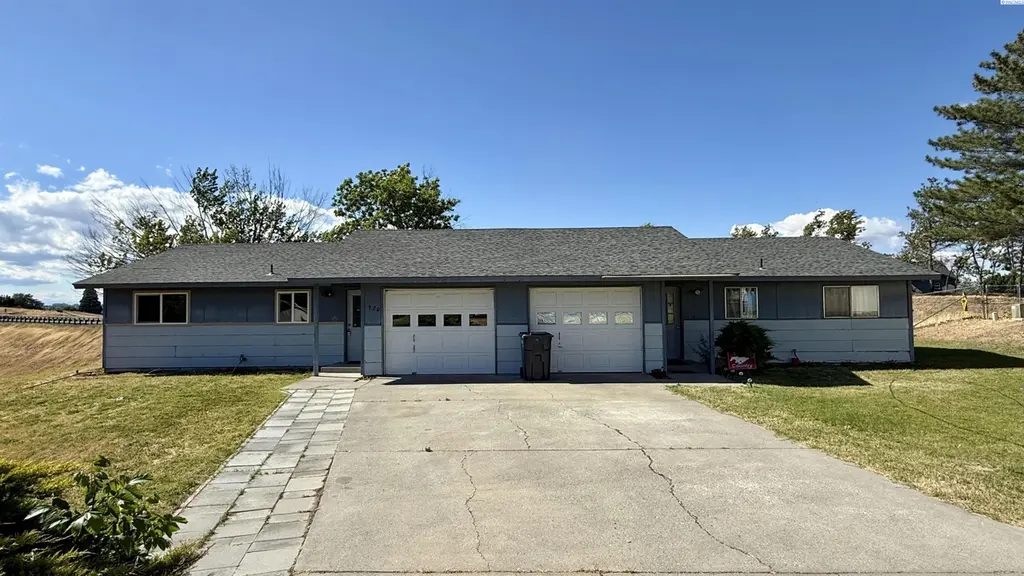
 Triplex
920-924 Burgundy Pl · Prosser, WA
Flood risk 1/10 · Minimal
- FEMA flood zone
- X
- Chance of flooding over 30 yrs
- 0.0%
- Est. flood insurance / yr
- $507 – $1,088
Fire risk 6/10 · Moderate
- Est. fire insurance / yr
- $604 – $1,122
Heat risk 5/10 · Moderate
- Hot days now (above 98°F)
- 7 days/yr
- Hot days in 30 yrs
- 15 days/yr
Wind risk 1/10 · Minimal
- Chance of severe wind over 30 yrs
- —
Air-quality risk 9/10 · Severe
- Unhealthy air days now
- 13 days/yr
- Unhealthy air days in 30 yrs
- 13 days/yr
Risk factors via First Street. Map © Google.
Why this score? — see what drove the D grade
The composite is a weighted blend of 9 inputs, each scored 0–100. Each bar is that input's sub-score; the figure is the points it added to the 100-point composite (weight × sub-score).
- Cash flow +14.4/30.0
- ARV discount +7.5/15.0
- DSCR +4.4/10.0
- Livability +4.0/5.0
- Schools +3.8/10.0
- 1% rule +3.4/10.0
- Rent growth +2.5/5.0
- Condition / age +2.5/5.0
- Appreciation +0.0/10.0
$370,000
🖨 Deal sheet 📄 Offer letter ✓ Due diligence
Multi-family units
County records classify this as Multi-Family (2-4 Unit). Listing-text estimate: 3 units. confirmed
Listing remarks
MLS# 293734 Investor opportunity in Prosser! This single-story duplex sits on a generous 1/3-acre lot and offers immediate income potential. The property features a tenant-occupied 2-bedroom, 1-bath unit providing established rental income, while the 3-bedroom, 1-bath unit has recently been updated with fresh interior paint, new carpet, and new windows. Ideal for investors seeking cash flow or owner-occupants looking to offset their mortgage by living in one unit and renting the other. With separate living spaces, recent improvements, and room to enjoy on a large lot, this duplex presents a versatile investment opportunity with long-term potential.
Key facts
- Recently updated
- New carpet
- Large lot
Tags
Property features AI
Exterior
- Parking: Detached garage; 1 covered parking space (1 garage space, 1 total parking space)
- Utilities: Public water; Sewer connected; Electricity connected
- Home design: Residential income property; Duplex
- Construction: Wood siding and frame construction; Composition roof
- Exterior features: Patio; Partial fencing; Cul-de-sac lot; Paved road access
Interior
- Kitchen: Dishwasher; Refrigerator; Range hood; Range; Oven
- Heating & cooling: Electric heating; Baseboard heating; Wall unit cooling
- Interior features: Ceiling fan(s); Drapes
Neighborhood map
What this means for you Summary
Snapshot
- This is a 3 × 1-bed/?-bath units multifamily listed at $370k.
Deal economics
- At list price, monthly cash flow is $75 ($895/yr) — positive. Per door: $25/mo.
- The deal already cash-flows at list — no discount required.
- To meet the 1% rule (rent ≥ 1% of price), the offer needs to be $310k (16.2% below list).
- Recommended offer: $310k (16.2% below list) — sets the bar for 1% rule.
- Cap rate 6.5% vs local median 2.8% in Prosser — top-decile yield for the area; either an underpriced asset or a hidden risk that comps aren't pricing in. Stress-test before assuming the spread holds.
Location & tenants
- Location reads 80/100 on livability (#91 in WA, #1,785 nationally) — a professional / high-income tenant draw. Strengths: commute A+, housing A+, health & safety A+; Watch: schools C-, amenities D+, employment D.
- Prosser School District (town): math 36% / reading 46% proficiency, ranked #208 of 291 in WA (top 72%) — families likely to look elsewhere, expect single-tenant / working-renter base with shorter leases.
- Market conditions: 231 active listings in the ZIP; 2 comparable units currently listed for rent nearby; 1,532 units permitted in Benton County in 2024 (389 in 5+ unit buildings).
Forward outlook
- Local home prices are declining (-3.0%/yr); year-one equity from $3k of loan paydown is wiped out by about $11k of value loss. Plan a longer hold.
- Benton County population projected at +32% by 2050 — long-run rental-demand tailwind backs the buy-and-hold thesis.
Negotiation context
- Only 7 days on market — expect competitive offers; lowballing is unlikely to land.
Risks & watch-outs
- Climate carrying-cost: major wildfire risk; extreme-heat days projected 7→15/yr by 2055 (HVAC capex compounding) — expect insurance premiums to compound above CPI over the hold.
Questions for the listing agent
- Can we see the unit-by-unit rent roll, current vacancy, and any below-market leases? What's the average tenancy length?
- What capital expenditures (roof, boiler, parking lot, exteriors) have been made in the last 5 years, and what's planned in the next 2?
- Built in 1978 — when were the roof, HVAC, electrical panel, plumbing, and water heater last replaced?
- Is there a deadline driving the sale (1031 exchange, divorce, estate, relocation)? That informs how much negotiation room exists.
- The area grade is low — what's the realistic commute time and amenity access for the typical tenant pool here? Any planned neighborhood developments (good or bad) we should know about?
- What's the average days-on-market for RENTAL listings here right now (not sales)? A rising rental-DOM trend means longer vacancies and softer asking-rent achievability than the comps imply.
- What's the recent tenant-quality profile in this submarket — average credit score on applications, eviction rate, late-payment / NSF rate, and stable-employment percentage? A property-management company in the area should have these aggregated.
- How much new apartment / multifamily construction is in the pipeline within 1–3 miles? Heavy new supply (>2% of stock underway) typically softens rents 12–24 months out; light construction supports rent growth.
Investment metrics
- 1% rule
- 0.84% ✗
- Cap rate
- 6.53%
- Cash-on-cash
- 0.86%
- DSCR
- 1.04
- GRM
- 9.9
CMA / ARV
No comps found within radius.
Projected returns pro-forma
-3.0% appreciation · 3.0% rent growth · sell at horizon
- IRR
- -14.9%
- Equity multiple
- 0.47×
- Total profit
- $-55,272
- Equity at exit
- $55,168
- IRR
- -6.4%
- Equity multiple
- 0.59×
- Total profit
- $-42,280
- Equity at exit
- $31,991
Cash invested: $103,600 (down + closing). Projections, not guarantees.
Landlord ↔ Tenant lean methodology
- Overall (STATE)
- 28 Tenant-Leaning
- State Washington
- 28 Tenant-Leaning · D+8
- County
- — inherits STATE
- City
- — inherits STATE
ZIP-level market 99350
- Home prices YoY
- -31.6%
- Active inventory
- 231
- Price-to-rent
- 29.8×
Monthly cashflow live
- Estimated rent
- $3,100 medium interval (Pro) →
- Mortgage (P&I)
- −$1,940
- Tax from tax record
- −$280 /mo · $3,359/yr
- Insurance
- −$154
- HOA
- −$0
- Vacancy / Maint / Mgmt
- −$651
- Net cashflow
- $75
Break-even live
3-unit breakdown (identical units grouped — click to expand)
| Units | Beds | Baths | Est. rent |
|---|---|---|---|
| 3× units | 1 | — | $3,099 |
| #1 | 1 | — | $1,033 |
| #2 | 1 | — | $1,033 |
| #3 | 1 | — | $1,033 |
| Total (3 units) | $3,100 | ||
UW: 25.0% down · 7.5% · 30yr · 1.5% tax · 5.0% vac · 8.0% maint · 8.0% mgmt
Financing live
Cash to close
- Down payment
- $92,500
- Closing costs
- $11,100
- Reserves months
- —
- Total cash needed
- —
Loan-product check · same deal, 3 products live
Conventional
25% down · 7.5% · 30yr
- Down + closing
- —
- Monthly P&I
- —
- Monthly cashflow
- —
- DSCR
- —
- Eligible?
- —
Personal DTI + credit; lowest rate.
DSCR
20% down · 8.5% · 30yr
- Down + closing
- —
- Monthly P&I
- —
- Monthly cashflow
- —
- DSCR
- —
- Eligible?
- —
No personal income docs; deal must DSCR.
Hard money
10% down · 12.0% · 12mo
- Down + closing
- —
- Monthly P&I
- —
- Monthly cashflow
- —
- DSCR
- —
- Eligible?
- —
Short-term bridge; refi at stabilization.
Rent comps 2 comps
| Address | Beds | Baths | Sqft | Rent | $/sqft | DOM | Units | Dist |
|---|---|---|---|---|---|---|---|---|
| 915-959 Hidden Lane PR Prosser, WA | 3.0 | 2.5 | 1905 | $2,350 | $1.23 | 21d | 1 | 0.85mi |
| 50 Molly Rose Ct Prosser, WA | 3.0 | 2.0 | 1580 | $2,400 | $1.52 | 43d | 1 | 0.86mi |
Listing history 8 events
-
2026-06-17status $370,000 Pending 7 DOM
-
2026-06-17days on market $370,000 Active 7 DOM
-
2026-06-16days on market $370,000 Active 6 DOM
-
2026-06-15days on market $370,000 Active 5 DOM
-
2026-06-15days on market $370,000 Active 4 DOM
-
2026-06-13days on market $370,000 Active 3 DOM
-
2026-06-12remarks 656-char remark
-
2026-06-12$370,000 Active 2 DOM
ⓘ Source: listings_history table (triggers on properties + properties_extension) + one-shot
backfill from property_details.listing_events for pre-trigger history.
Tax reassessment forecast WA · Resets to sale price
- Current annual tax
- $3,359 · $280/mo
- Projected year-2 tax
- $3,626 · $302/mo
- Expected delta
- +$267/yr (+$22/mo · 7.9%)
ⓘ Screening estimate from a state-policy table — verify with the county assessor before closing.
Climate risk First Street
- Flood 1/10 Low FEMA zone X · 0% chance over 30 yrs
- Wildfire 6/10 Major
- Heat 5/10 Major 7 d/yr ≥98°F today · 15 d/yr by 30 yrs out
- Wind 1/10 Low
- Air quality 9/10 Extreme 13 unhealthy d/yr today · 13 by 30 yrs out
Nearby sold comps map
Loading sold comps map…
Walkable amenities ~0.75 mi
Loading nearby amenities…
Taxation est. · year 1
- Rental income
- $37,200
- − Mortgage interest
- −$20,726
- − Property taxes
- −$3,359
- − Insurance
- −$1,850
- − Repairs & maintenance
- −$2,976
- − Management
- −$2,976
- − Depreciation
- −$10,764
- Taxable loss
- −$5,451
- Est. tax savings @ 24.0%
- +$1,308
- After-tax cash flow
- $2,203/yr
For passive investors: Depreciation is non-cash, so a rental often shows a tax loss while cash-flowing — sheltering income. Rental losses are passive: they offset passive income freely, and up to $25,000/yr can offset ordinary (W-2) income if you actively participate and your MAGI is under $100k (phasing out to $0 by $150k); unused losses carry forward. On sale, claimed depreciation is recaptured at up to 25%, and gains may owe capital-gains tax (a 1031 exchange can defer both). Figures are a year-1 estimate at your 24.0% rate — not tax advice; consult a CPA.
Schools (NCES district)
- District
- Prosser School District
- NCES district ID
- 5306900
- Math proficiency
- 36% ▼ -2.00%
- Reading proficiency
- 46% ▬ 0.00%
- Median HH income
- $52,089
- Composite
- 37.89/100
- National rank
- #8699
- State rank
- #208 of 291 in WA
Livability — Prosser
- Score
- 80/100
- State rank
- #91
- US rank
- #1785
Category grades
Schools grade is shown separately in the Schools card above.
Census & demographics
- Census place
- Prosser, WA
- Population (ZIP)
- 14,278
Population outlook (Benton County) Hauer SSP2
- Today (2025)
- 219,421 people
- By 2030
- 233,813 · +6.6%
- By 2040
- 262,134 · +19.5%
- By 2050
- 290,100 · +32.2%
- By 2075
- 363,525 · +65.7%
- By 2100
- 418,667 · +90.8%
Race, ethnicity, and origin ACS 2023
- Race & ethnicity
- White 50% Hispanic / Latino 46% Two or more races 17% Asian 2% Native American 1%
- Hispanic origin (detail)
- Mexican 43%
- Common ancestry
- Italian 3% Iranian 3% Slovak 2%
- Foreign-born
- 15% · Canada
- Languages at home
- 64% English-only · Spanish 34% Other Asian/Pacific 1%
Political lean MEDSL · Benton
- 2024 margin
- Strong R (+21.9) · D 37.7% · R 59.6% · Other 2.7%
- 2008→2024 swing
- +4.2pp toward D · 2008: -26.1pp · 2024: -21.9pp
- All cycles
- 2024: R+21.9 2020: R+21.0 2016: R+26.6 2012: R+27.0 2008: R+26.1
Not yet ingested
- Civics
- —
Market trends
- HPI YoY
- ▼ -118.73%
- Current HPI
- 256.9999
- Rent YoY
- —
- Metro
- —
- State GDP YoY
- ▲ 4.65%
- F500 in state
- 22
Industry mix (Fortune 500 HQ in WA)
| Industry | F500 HQs | Revenue |
|---|---|---|
| Retail | 2 | $269B |
|
||
| Technology / Retail | 1 | $638B |
|
||
| Technology | 1 | $245B |
|
||
| Telecommunications | 1 | $38B |
|
||
| Food / Beverage | 1 | $36B |
|
||
| Automotive / Trucks | 1 | $34B |
|
||
Price history
1 event — show timeline
- 2026-06-11 Listed $370,000 PACMLS
Property tax history
+8.2%/yrLatest (2026): $3,359 · -2.6% YoY. Source: county tax records.
Cash-flow waterfall
monthlySold comps — $/sqft
last 12 mo · ≤1 miLoading sold comps…