 Multi-family
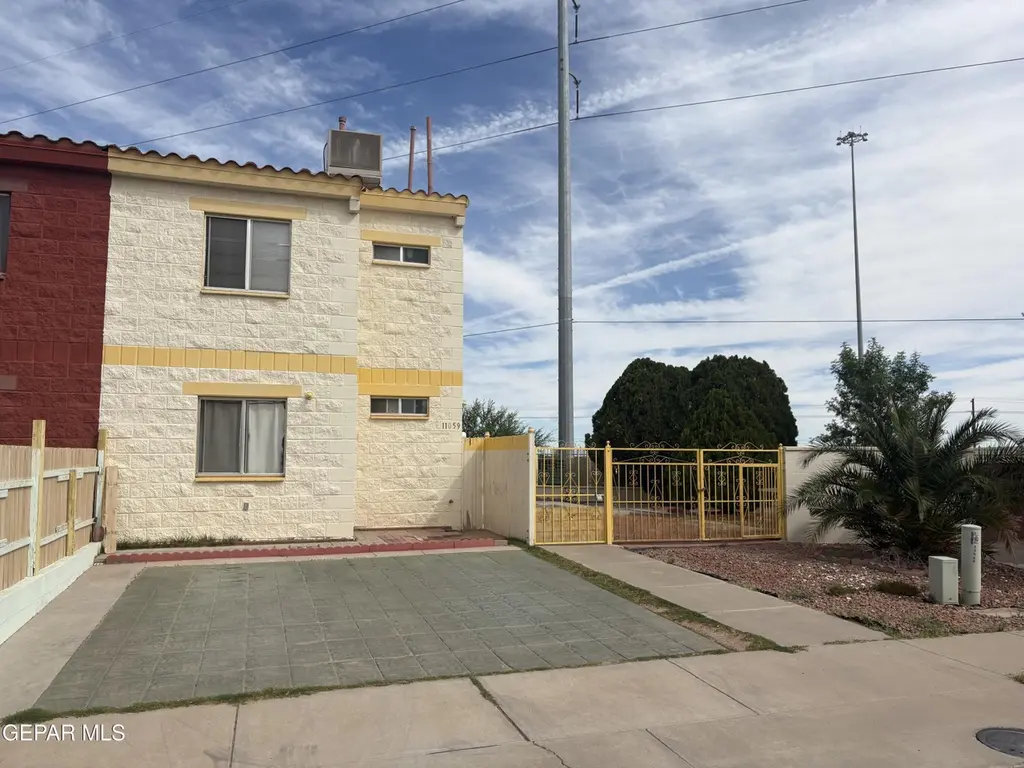
11059 Dandelion Way · El Paso, TX
Flood risk 1/10 · Minimal
- FEMA flood zone
- X
- Chance of flooding over 30 yrs
- 0.0%
- Est. flood insurance / yr
- $507 – $1,088
Fire risk 3/10 · Minor
- Est. fire insurance / yr
- $1,222 – $2,270
Heat risk 6/10 · Moderate
- Hot days now (above 100°F)
- 7 days/yr
- Hot days in 30 yrs
- 25 days/yr
Wind risk 1/10 · Minimal
- Chance of severe wind over 30 yrs
- —
Air-quality risk 3/10 · Minor
- Unhealthy air days now
- 2 days/yr
- Unhealthy air days in 30 yrs
- 2 days/yr
Risk factors via First Street. Map © Google.
Why this score? — see what drove the B- grade
The composite is a weighted blend of 9 inputs, each scored 0–100. Each bar is that input's sub-score; the figure is the points it added to the 100-point composite (weight × sub-score).
- Cash flow +30.0/30.0
- 1% rule +10.0/10.0
- DSCR +10.0/10.0
- ARV discount +7.5/15.0
- Livability +4.0/5.0
- Rent growth +3.0/5.0
- Schools +2.6/10.0
- Condition / age +2.5/5.0
- Appreciation +0.0/10.0
$139,000
🖨 Deal sheet 📄 Offer letter ✓ Due diligence
Multi-family units
County records classify this as Multi-Family (2-4 Unit). Listing-text estimate: 1 unit. estimate disagrees with records
Listing remarks
Affordable and inviting 3 bedroom 2 bath home, with a low maintenance yard where you'll find the perfect place to to enjoy a quiet morning or unwind at the end of the day. Situated on a cup-de-sac with easy access to Montana Ave, Global Reach & Loop 375, near dining and entertainment. Great opportunity for buyers looking for a starter home or investment t property. Schedule your appointment to visit today!
Key facts
- 3,718 sq ft lot
- Built 1999
- Listed 3 days
Property features AI
Finance
- HOA & community: HOA: Dana Properties; HOA fee $45 quarterly; HOA covers common area and front landscape
Exterior
- Utilities: Community sewer
- Home design: Duplex
- Construction: Brick construction; Pitched roof
- Exterior features: Walled backyard with back yard access; Fenced yard
Interior
- Kitchen: Free-standing gas oven
- Bedrooms: Master bedroom is on the upper level
- Flooring: Vinyl flooring
- Bathrooms: 2 full bathrooms
- Heating & cooling: Natural gas central heating; Evaporative cooling
- Interior features: Ceiling fans; Living/dining combo; Master bedroom upstairs; No window treatments
Neighborhood map
What this means for you Summary
Snapshot
- This is a 3-bed/2.0-bath multifamily listed at $139k.
Deal economics
- At list price, monthly cash flow is $1k ($13k/yr) — positive.
- The deal already cash-flows at list — no discount required.
- Meets the 1% rule at list price ($3k rent vs $139k).
Location & tenants
- Location reads 81/100 on livability (#23 in TX, #1,375 nationally) — a professional / high-income tenant draw. Strengths: commute A+, cost of living A+, housing A+; Watch: employment D+.
- Ysleta ISD (urban): math 27% / reading 35% proficiency, ranked #626 of 826 in TX (top 76%) — families likely to look elsewhere, expect single-tenant / working-renter base with shorter leases; 68% free/reduced lunch — lower-income household profile, screen leases tightly.
- Zoned schools: J M Hanks H S (math 28% / reading 48%, grade F, #880 of 1,632 statewide, top 54%, 1,454 students, 64% FRL) — zoned schools at 64% FRL track the district average.
- Market conditions: Rents rising (+2.0%/yr); 228 active listings in the ZIP; 28 comparable units currently listed for rent nearby; rentals at typical pace (median 14d on market — plan ~3-4 weeks tenant-placement turnaround); 2,196 units permitted in El Paso County in 2024 (143 in 5+ unit buildings).
- At $2,627/mo this rent would consume 47% of the median local household income ($67k/yr) (locally 2856% of renters already pay >50% of income on rent) — very limited rent-growth headroom before tenants either downsize or default.
Forward outlook
- Local home prices are declining (-3.0%/yr); year-one equity from $961 of loan paydown is wiped out by about $4k of value loss. Plan a longer hold.
- El Paso County population projected at +10% by 2050 — modest demand growth; plan on rents tracking national, not racing it.
- At projected returns (-3.0% appreciation + 2.0% rent growth), your $39k cash investment doubles in ~4 years — after that, you're playing with house money.
Negotiation context
- Only 3 days on market — expect competitive offers; lowballing is unlikely to land.
Risks & watch-outs
- Climate carrying-cost: extreme-heat days projected 7→25/yr by 2055 (HVAC capex compounding) — expect insurance premiums to compound above CPI over the hold.
Questions for the listing agent
- What does the HOA fee cover, when was the last increase, and are there any pending special assessments or reserve-fund shortfalls?
- Is there a deadline driving the sale (1031 exchange, divorce, estate, relocation)? That informs how much negotiation room exists.
- Schools are B-rated — typically a magnet for longer-tenancy family renters. What's the average tenant stay here, and is there a school-zone premium baked into asking?
- What's the average days-on-market for RENTAL listings here right now (not sales)? A rising rental-DOM trend means longer vacancies and softer asking-rent achievability than the comps imply.
- What's the recent tenant-quality profile in this submarket — average credit score on applications, eviction rate, late-payment / NSF rate, and stable-employment percentage? A property-management company in the area should have these aggregated.
- How much new apartment / multifamily construction is in the pipeline within 1–3 miles? Heavy new supply (>2% of stock underway) typically softens rents 12–24 months out; light construction supports rent growth.
Investment metrics
- 1% rule
- 1.89% ✓
- Cap rate
- 15.47%
- Cash-on-cash
- 32.79%
- DSCR
- 2.46
- GRM
- 4.4
CMA / ARV
No comps found within radius.
Projected returns pro-forma
-3.0% appreciation · 2.04% rent growth · sell at horizon
- IRR
- 26.8%
- Equity multiple
- 2.10×
- Total profit
- $42,766
- Equity at exit
- $20,725
- IRR
- 33.8%
- Equity multiple
- 3.95×
- Total profit
- $114,628
- Equity at exit
- $12,018
Cash invested: $38,920 (down + closing). Projections, not guarantees.
Landlord ↔ Tenant lean methodology
- Overall (STATE)
- 87 Strongly Landlord-Friendly
- State Texas
- 87 Strongly Landlord-Friendly · R+5
- County
- — inherits STATE
- City
- — inherits STATE
ZIP-level market 79936
- Home prices YoY
- -25.9%
- Rents YoY
- 2.0%
- Active inventory
- 228
- Price-to-rent
- 8.8×
Monthly cashflow live
- Estimated rent
- $2,627 medium interval (Pro) →
- Mortgage (P&I)
- −$729
- Tax from tax record
- −$210 /mo · $2,520/yr
- Insurance
- −$58
- HOA
- −$15
- Vacancy / Maint / Mgmt
- −$552
- Net cashflow
- $1,063
Break-even live
2-unit breakdown (identical units grouped — click to expand)
| Units | Beds | Baths | Est. rent |
|---|---|---|---|
| 2× units | 3 | 2 | $2,626 |
| #1 | 3 | 2 | $1,313 |
| #2 | 3 | 2 | $1,313 |
| Total (2 units) | $2,627 | ||
UW: 25.0% down · 7.5% · 30yr · 1.5% tax · 5.0% vac · 8.0% maint · 8.0% mgmt
Financing live
Cash to close
- Down payment
- $34,750
- Closing costs
- $4,170
- Reserves months
- —
- Total cash needed
- —
Loan-product check · same deal, 3 products live
Conventional
25% down · 7.5% · 30yr
- Down + closing
- —
- Monthly P&I
- —
- Monthly cashflow
- —
- DSCR
- —
- Eligible?
- —
Personal DTI + credit; lowest rate.
DSCR
20% down · 8.5% · 30yr
- Down + closing
- —
- Monthly P&I
- —
- Monthly cashflow
- —
- DSCR
- —
- Eligible?
- —
No personal income docs; deal must DSCR.
Hard money
10% down · 12.0% · 12mo
- Down + closing
- —
- Monthly P&I
- —
- Monthly cashflow
- —
- DSCR
- —
- Eligible?
- —
Short-term bridge; refi at stabilization.
Rent comps 28 comps
| Address | Beds | Baths | Sqft | Rent | $/sqft | DOM | Units | Dist |
|---|---|---|---|---|---|---|---|---|
| 3558 E Glen Dr Unit B El Paso, TX | 3.0 | 2.0 | 1350 | $1,250 | $0.93 | 21d | 1 | 0.23mi |
| 11040 Sunshine Ct #1 El Paso, TX | 3.0 | 1.0 | 901 | $1,250 | $1.39 | 21d | 1 | 0.24mi |
| 3425 E Glen Dr El Paso, TX | 3.0 | 2.0 | 1173 | $1,495 | $1.27 | 43d | 1 | 0.59mi |
| 3329 Running Deer Dr El Paso, TX | 4.0 | 2.0 | 1410 | $1,575 | $1.12 | 14d | 1 | 0.84mi |
| 10805 Hitchcock Ave El Paso, TX | 4.0 | 2.0 | 1472 | $1,750 | $1.19 | 11d | 1 | 0.94mi |
| 3104 Wayside St Unit D El Paso, TX | 2.0 | 2.0 | 1400 | $1,400 | $1.00 | 43d | 1 | 1.10mi |
| 3541 Peerless Pl El Paso, TX | 1.0–2.0 | 1.0–2.0 | 712 | $1,050 | $1.47 | 14d | 1 | 1.13mi |
| 3028 E Glen Dr Unit A El Paso, TX | 2.0 | 1.0 | 949 | $895 | $0.94 | 43d | 1 | 1.15mi |
| 11409 Chickasaw Dr El Paso, TX | 3.0 | 2.0 | 1014 | $1,800 | $1.78 | 10d | 1 | 1.15mi |
| 3022 E Glen Dr Unit A El Paso, TX | 2.0 | 1.0 | 949 | $895 | $0.94 | 43d | 1 | 1.16mi |
| 3006 E Glen Dr Unit 3006 El Paso, TX | 2.0 | 1.0 | 968 | $1,200 | $1.24 | 2d | 1 | 1.18mi |
| 2918 E Glen Dr Unit B El Paso, TX | 3.0 | 2.0 | 1376 | $1,450 | $1.05 | 2d | 1 | 1.21mi |
| 2905 Beachcomber Dr Unit A El Paso, TX | 2.0 | 1.0 | 900 | $1,350 | $1.50 | 11d | 1 | 1.22mi |
| 2905 Beachcomber Dr Unit B El Paso, TX | 2.0 | 1.0 | 900 | $1,275 | $1.42 | 2d | 1 | 1.22mi |
| 2901 Beachcomber Dr Unit B El Paso, TX | 2.0 | 2.0 | 1098 | $1,095 | $1.00 | 11d | 1 | 1.23mi |
| 10605 Kinross Ave Unit B El Paso, TX | 2.0 | 1.5 | 940 | $995 | $1.06 | 23d | 1 | 1.23mi |
| 10555 Kinross Ave El Paso, TX | 3.0 | 2.0 | 1231 | $1,350 | $1.10 | 11d | 1 | 1.27mi |
| 2917 E Glen Dr Unit B El Paso, TX | 2.0 | 1.0 | 724 | $965 | $1.33 | 2d | 1 | 1.27mi |
| 2807 Beachcomber Dr El Paso, TX | 3.0 | 2.0 | 1396 | $1,500 | $1.07 | 43d | 1 | 1.31mi |
| 11275 Pebble Hills Blvd El Paso, TX | 2.0 | 1.5 | 1080 | $1,150 | $1.06 | 14d | 1 | 1.33mi |
| 3228 Isla Cocoa Ln El Paso, TX | 2.0 | 2.0 | 962 | $1,300 | $1.35 | 43d | 1 | 1.33mi |
| 3225 Isla Banderas Way El Paso, TX | 2.0 | 2.0 | 1458 | $1,295 | $0.89 | 14d | 1 | 1.34mi |
| 3225 Isla Banderas Way El Paso, TX | 2.0 | 2.0 | 1458 | $1,295 | $0.89 | 23d | 1 | 1.34mi |
| 11128 Wharf Cove Dr El Paso, TX | 4.0 | 2.0 | 1310 | $1,700 | $1.30 | 43d | 1 | 1.36mi |
| 11242 Wharf Cove Dr Unit A El Paso, TX | 2.0 | 1.0 | 900 | $1,250 | $1.39 | 43d | 1 | 1.39mi |
| 11224 Wharf Cove Dr Unit A El Paso, TX | 2.0 | 1.0 | 841 | $1,100 | $1.31 | 19d | 1 | 1.42mi |
| 3208 Isla Morada Dr El Paso, TX | 3.0 | 2.0 | 1458 | $1,500 | $1.03 | 11d | 1 | 1.43mi |
| 11280 Pebble Hills Blvd El Paso, TX | 1.0–2.0 | 1.0–2.0 | 785 | $1,205 | $1.54 | 2d | 2 | 1.44mi |
HOA detail
- Monthly dues
- $15 · $180/yr
Listing history 4 events
-
2026-06-18days on market $139,000 Active 3 DOM
-
2026-06-17days on market $139,000 Active 2 DOM
-
2026-06-16remarks 411-char remark
-
2026-06-16$139,000 Active 1 DOM
ⓘ Source: listings_history table (triggers on properties + properties_extension) + one-shot
backfill from property_details.listing_events for pre-trigger history.
Tax reassessment forecast TX · Resets to sale price
- Current annual tax
- $2,520 · $210/mo
- Projected year-2 tax
- $2,544 · $212/mo
- Expected delta
- +$23/yr (+$2/mo · 0.9%)
ⓘ Screening estimate from a state-policy table — verify with the county assessor before closing.
Climate risk First Street
- Flood 1/10 Low FEMA zone X · 0% chance over 30 yrs
- Wildfire 3/10 Moderate
- Heat 6/10 Major 7 d/yr ≥100°F today · 25 d/yr by 30 yrs out
- Wind 1/10 Low
- Air quality 3/10 Moderate 2 unhealthy d/yr today · 2 by 30 yrs out
Nearby sold comps map
Loading sold comps map…
Walkable amenities ~0.75 mi
Loading nearby amenities…
Taxation est. · year 1
- Rental income
- $31,524
- − Mortgage interest
- −$7,786
- − Property taxes
- −$2,520
- − Insurance
- −$695
- − Repairs & maintenance
- −$2,522
- − Management
- −$2,522
- − HOA
- −$180
- − Depreciation
- −$4,044
- Taxable income
- $11,255
- Est. tax owed @ 24.0%
- −$2,701
- After-tax cash flow
- $10,060/yr
For passive investors: Depreciation is non-cash, so a rental often shows a tax loss while cash-flowing — sheltering income. Rental losses are passive: they offset passive income freely, and up to $25,000/yr can offset ordinary (W-2) income if you actively participate and your MAGI is under $100k (phasing out to $0 by $150k); unused losses carry forward. On sale, claimed depreciation is recaptured at up to 25%, and gains may owe capital-gains tax (a 1031 exchange can defer both). Figures are a year-1 estimate at your 24.0% rate — not tax advice; consult a CPA.
Schools (NCES district)
- District
- Ysleta ISD
- NCES district ID
- 4846680
- Math proficiency
- 27% ▼ -31.00%
- Reading proficiency
- 35% ▼ -11.00%
- Median HH income
- $35,826
- Composite
- 25.65/100
- National rank
- #7400
- State rank
- #626 of 826 in TX
Livability — El Paso
- Score
- 81/100
- State rank
- #23
- US rank
- #1375
Category grades
Schools grade is shown separately in the Schools card above.
Census & demographics
- Census place
- El Paso, TX
- County
- El Paso County · 761,266 people
- City population
- 630,223
- Metro
- El Paso, TX
- Population (ZIP)
- 102,991
- Household income
- $67,198
- Rent vs Own
- Severe rent burden
- 2856.0
Population outlook (El Paso County) Hauer SSP2
- Today (2025)
- 897,899 people
- By 2030
- 922,694 · +2.8%
- By 2040
- 960,492 · +7.0%
- By 2050
- 982,919 · +9.5%
- By 2075
- 997,266 · +11.1%
- By 2100
- 900,630 · +0.3%
Race, ethnicity, and origin ACS 2023
- Neighborhood character
- Predominantly Hispanic (86%)
- Race & ethnicity
- Hispanic / Latino 86% Two or more races 40% White 9% Black 3% Asian 1%
- Hispanic origin (detail)
- Mexican 82% Puerto Rican 1%
- Foreign-born
- 20% · Canada
- Languages at home
- 32% English-only · Spanish 66%
Political lean MEDSL · El Paso
- 2024 margin
- D (+15.1) · D 57.0% · R 41.8% · Other 1.2%
- 2008→2024 swing
- -17.4pp toward R · 2008: 32.5pp · 2024: 15.1pp
- All cycles
- 2024: D+15.1 2020: D+35.1 2016: D+43.2 2012: D+32.6 2008: D+32.5
Not yet ingested
- Civics
- —
Market trends
- HPI YoY
- ▼ -86.55%
- Current HPI
- 247.851
- Rent YoY
- ▲ 2.04%
- Metro
- El Paso, TX
- State GDP YoY
- ▲ 3.95%
- F500 in state
- 110
Industry mix (Fortune 500 HQ in TX)
| Industry | F500 HQs | Revenue |
|---|---|---|
| Energy | 16 | $1,198B |
|
||
| Technology | 5 | $198B |
|
||
| Engineering / Construction | 4 | $72B |
|
||
| Energy Services | 3 | $60B |
|
||
| Utilities | 3 | $41B |
|
||
| Healthcare | 2 | $330B |
|
||
Price history
2 events — show timeline
- 2026-06-15 Listed $139,000 GEPARMLS
- 2026-05-07 Sold (Public Records) — Public Records
Property tax history
+5.1%/yrLatest (2025): $2,520 · +10.7% YoY. Source: county tax records.
Cash-flow waterfall
monthlySold comps — $/sqft
last 12 mo · ≤1 miLoading sold comps…