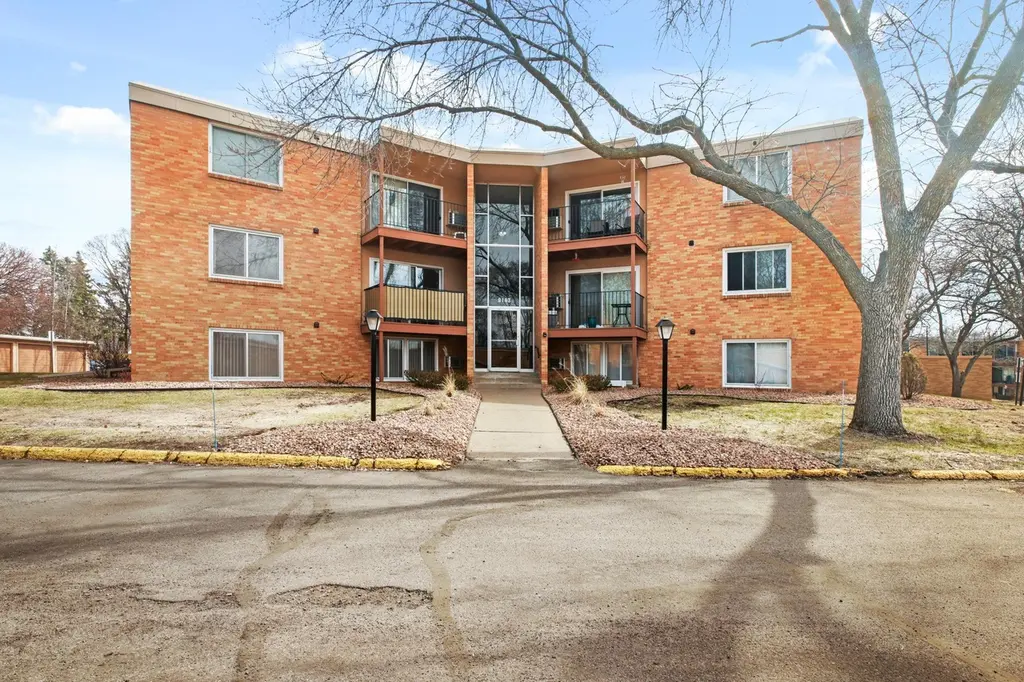
9143 Highway 55 #103 · Golden Valley, MN
Flood risk 1/10 · Minimal
- FEMA flood zone
- X (unshaded)
- Chance of flooding over 30 yrs
- 0.0%
- Est. flood insurance / yr
- $507 – $1,088
Fire risk 1/10 · Minimal
- Est. fire insurance / yr
- $888 – $1,650
Heat risk 2/10 · Minimal
- Hot days now (above 98°F)
- 7 days/yr
- Hot days in 30 yrs
- 13 days/yr
Wind risk 2/10 · Minimal
- Chance of severe wind over 30 yrs
- —
Air-quality risk 2/10 · Minimal
- Unhealthy air days now
- 2 days/yr
- Unhealthy air days in 30 yrs
- 2 days/yr
Risk factors via First Street. Map © Google.
Why this score? — see what drove the A- grade
The composite is a weighted blend of 9 inputs, each scored 0–100. Each bar is that input's sub-score; the figure is the points it added to the 100-point composite (weight × sub-score).
- Cash flow +29.7/30.0
- ARV discount +15.0/15.0
- 1% rule +10.0/10.0
- DSCR +10.0/10.0
- Schools +4.6/10.0
- Rent growth +4.4/5.0
- Livability +4.1/5.0
- Condition / age +2.5/5.0
- Appreciation +0.0/10.0
$109,000
🖨 Deal sheet 📄 Offer letter ✓ Due diligence
Listing remarks MLS
Step into comfort and simplicity with this beautifully refreshed 2-bedroom condo in Golden Valley. From the moment you step in, you’ll notice the brand-new carpet and updated appliances that make everyday living feel easy. The space is clean, functional, and ready for you to move right in—no projects, no delays. Enjoy warm days by the community pool, and appreciate the convenience of your own 1-car garage. Located just minutes from Highway 169, 394, and Highway 55, getting anywhere in the metro is quick and stress-free. With a low, stable HOA and an affordable price point, this is a rare opportunity to own instead of rent without sacrificing comfort or location. Cats, birds, and fish are welcome, so your companions can feel at home too.
Key facts
- Updated appliances
- Brand new carpet
- $447 HOA
Tags
Neighborhood map
What this means for you Summary
Snapshot
- This is a 2-bed/1.0-bath condo listed at $109k.
Deal economics
- At list price, monthly cash flow is $396 ($5k/yr) — positive.
- The deal already cash-flows at list — no discount required.
- Meets the 1% rule at list price ($2k rent vs $109k).
- Recommended offer: $102k (6.0% below list) — sets the bar for market timing.
- Cap rate 10.6% vs local median 2.8% in Golden Valley — top-decile yield for the area; either an underpriced asset or a hidden risk that comps aren't pricing in. Stress-test before assuming the spread holds.
Location & tenants
- Location reads 82/100 on livability (#40 in MN, #1,110 nationally) — a professional / high-income tenant draw. Strengths: crime A+, commute A+, employment A+; Watch: amenities F, cost of living D-.
- Hopkins Public School District (suburban): math 48% / reading 57% proficiency, ranked #75 of 301 in MN (top 25%) — acceptable for families but not a draw, mixed tenant base, ~2y average lease.
- Market conditions: Rents rising fast (+7.4%/yr); 126 active listings in the ZIP; 16 comparable units currently listed for rent nearby; rentals leasing fast (median 3d on market — plan ~1-2 weeks tenant-placement turnaround); solid renter incomes; 4,651 units permitted in Hennepin County in 2024 (2,443 in 5+ unit buildings).
Forward outlook
- Local home prices are declining (-3.0%/yr); year-one equity from $754 of loan paydown is wiped out by about $3k of value loss. Plan a longer hold.
- Hennepin County population projected at +30% by 2050 — long-run rental-demand tailwind backs the buy-and-hold thesis.
- At projected returns (-3.0% appreciation + 7.4% rent growth), your $31k cash investment doubles in ~6 years — after that, you're playing with house money.
Negotiation context
- It's been on market 76 days — a 6% lower offer ($102k) is reasonable based on typical stale-listing flexibility.
- Current owner paid $35k; list at $109k implies a 211% gain — meaningful room to come down on a strong offer.
Risks & watch-outs
- Watch-outs: HOA is 22% of rent.
Questions for the listing agent
- It's been on market 76 days. Have you received any prior offers? Is the seller open to a 6% concession, seller financing, or rate buy-down credit?
- Built in 1963 — when were the roof, HVAC, electrical panel, plumbing, and water heater last replaced?
- What does the HOA fee cover, when was the last increase, and are there any pending special assessments or reserve-fund shortfalls?
- Any open or pending special assessments — roof, HVAC, plumbing, elevator, façade? What's the per-unit balance and payoff schedule, and is the seller paying it off at close or rolling it to the buyer?
- Why hasn't it sold? Are there any deal-killer items the seller is aware of (foundation, flood, title, zoning, code violations)?
- Is there a deadline driving the sale (1031 exchange, divorce, estate, relocation)? That informs how much negotiation room exists.
- Schools are B-rated — typically a magnet for longer-tenancy family renters. What's the average tenant stay here, and is there a school-zone premium baked into asking?
- What's the average days-on-market for RENTAL listings here right now (not sales)? A rising rental-DOM trend means longer vacancies and softer asking-rent achievability than the comps imply.
- What's the recent tenant-quality profile in this submarket — average credit score on applications, eviction rate, late-payment / NSF rate, and stable-employment percentage? A property-management company in the area should have these aggregated.
- How much new apartment / multifamily construction is in the pipeline within 1–3 miles? Heavy new supply (>2% of stock underway) typically softens rents 12–24 months out; light construction supports rent growth.
Investment metrics
- 1% rule
- 1.86% ✓
- Cap rate
- 10.65%
- Cash-on-cash
- 15.56%
- DSCR
- 1.69
- GRM
- 4.5
CMA / ARV
- ARV (median comp)
- $147,782
- List price
- $109,000
- Delta
- -26.24%
- Verdict
- UNDERPRICED
- Comps
- 2 within 2.0 mi
Projected returns pro-forma
-3.0% appreciation · 7.4% rent growth · sell at horizon
- IRR
- 13.2%
- Equity multiple
- 1.56×
- Total profit
- $17,221
- Equity at exit
- $16,252
- IRR
- 26.2%
- Equity multiple
- 3.98×
- Total profit
- $90,826
- Equity at exit
- $9,424
Cash invested: $30,520 (down + closing). Projections, not guarantees.
Landlord ↔ Tenant lean methodology
- Overall (STATE)
- 46 Balanced
- State Minnesota
- 46 Balanced · D+2
- County
- — inherits STATE
- City
- — inherits STATE
ZIP-level market 55427
- Rents YoY
- 7.4%
- Active inventory
- 126
- Price-to-rent
- 4.5×
Monthly cashflow live
- Estimated rent
- $2,027 high interval (Pro) →
- Mortgage (P&I)
- −$572
- Tax from tax record
- −$142 /mo · $1,704/yr
- Insurance
- −$45
- HOA
- −$447
- Vacancy / Maint / Mgmt
- −$426
- Net cashflow
- $396
Break-even live
UW: 25.0% down · 7.5% · 30yr · 1.5% tax · 5.0% vac · 8.0% maint · 8.0% mgmt
Financing live
Cash to close
- Down payment
- $27,250
- Closing costs
- $3,270
- Reserves months
- —
- Total cash needed
- —
Loan-product check · same deal, 3 products live
Conventional
25% down · 7.5% · 30yr
- Down + closing
- —
- Monthly P&I
- —
- Monthly cashflow
- —
- DSCR
- —
- Eligible?
- —
Personal DTI + credit; lowest rate.
DSCR
20% down · 8.5% · 30yr
- Down + closing
- —
- Monthly P&I
- —
- Monthly cashflow
- —
- DSCR
- —
- Eligible?
- —
No personal income docs; deal must DSCR.
Hard money
10% down · 12.0% · 12mo
- Down + closing
- —
- Monthly P&I
- —
- Monthly cashflow
- —
- DSCR
- —
- Eligible?
- —
Short-term bridge; refi at stabilization.
Rent comps 16 comps
| Address | Beds | Baths | Sqft | Rent | $/sqft | DOM | Units | Dist |
|---|---|---|---|---|---|---|---|---|
| 9201 Golden Valley Rd Minneapolis, MN | 1.0–2.0 | 1.0–2.0 | 926 | $2,733 | $2.95 | 1d | 19 | 0.10mi |
| 9140 Golden Valley Rd Minneapolis, MN | 1.0–2.0 | 1.0 | 662 | $1,500 | $2.26 | 3d | 5 | 0.18mi |
| 200 Nathan Ln N Plymouth, MN | 1.0–2.0 | 1.0–2.0 | 926 | $1,908 | $2.06 | 1d | 5 | 0.43mi |
| 8350 Golden Valley Rd Golden Valley, MN | 1.0–2.0 | 1.0–2.0 | 995 | $2,035 | $2.05 | 3d | 9 | 0.52mi |
| 10010 6th Ave N Minneapolis, MN | 1.0–3.0 | 1.0–2.0 | 1100 | $2,980 | $2.71 | 1d | 22 | 0.56mi |
| 135 Nathan Ln N Minneapolis, MN | 2.0 | 1.0–2.0 | 800 | $1,750 | $2.19 | 1d | 20 | 0.59mi |
| 400 Ford Rd Minneapolis, MN | 1.0–3.0 | 1.0–2.0 | 1025 | $1,735 | $1.69 | 1d | 9 | 0.61mi |
| 640 Wisconsin Ave N Golden Valley, MN | 1.0–3.0 | 1.0–2.0 | 1118 | $2,952 | $2.64 | 1d | 99 | 0.61mi |
| 10101 Highway 55 Minneapolis, MN | 1.0–2.0 | 1.0 | 805 | $1,495 | $1.86 | 5d | 6 | 0.62mi |
| 275 Shelard Pkwy St Louis Park, MN | 1.0–2.0 | 1.0–2.0 | 900 | $1,709 | $1.90 | 5d | 11 | 0.62mi |
| 301 Shelard Pkwy Minneapolis, MN | 3.0 | 1.0–2.0 | 987 | $2,322 | $2.35 | 1d | 16 | 0.65mi |
| 1305 Flag Ave N Unit Labs Golden Valley, MN | 1.0 | 1.0 | 850 | $1,500 | $1.76 | 10d | 1 | 0.71mi |
| 1305 Flag Ave N Unit 2 Golden Valley, MN | 1.0 | 1.0 | 800 | $1,650 | $2.06 | 17d | 1 | 0.71mi |
| 9920 Wayzata Blvd Minneapolis, MN | 2.0 | 1.0–2.5 | 942 | $3,236 | $3.43 | 1d | 28 | 0.73mi |
| 1349 Pennsylvania Ave S Minneapolis, MN | 2.0 | 1.0 | 850 | $1,550 | $1.82 | 43d | 1 | 1.35mi |
| 1020 W Medicine Lake Dr Minneapolis, MN | 1.0–3.0 | 1.0–2.0 | 1272 | $2,169 | $1.70 | 3d | 4 | 1.38mi |
HOA detail condo
- Monthly dues
- $447 · $5,364/yr
- Likely covers
- pool
- Assessments
- None detected in remarks — confirm with the listing agent.
Listing history 16 events
-
2026-06-18days on market $109,000 Active 76 DOM
-
2026-06-17days on market $109,000 Active 75 DOM
-
2026-06-16days on market $109,000 Active 74 DOM
-
2026-06-15days on market $109,000 Active 73 DOM
-
2026-06-13days on market $109,000 Active 71 DOM
-
2026-06-13days on market $109,000 Active 70 DOM
-
2026-06-09days on market $109,000 Active 67 DOM
-
2026-06-08days on market $109,000 Active 66 DOM
-
2026-06-07days on market $109,000 Active 65 DOM
-
2026-06-04days on market $109,000 Active 62 DOM
-
2026-06-03days on market $109,000 Active 61 DOM
-
2026-06-02days on market $109,000 Active 60 DOM
-
2026-06-01days on market $109,000 Active 59 DOM
-
2026-05-31days on market $109,000 Active 58 DOM
-
2026-04-03$109,000 Active 760-char remark
Show marketing remark (760 chars)
Step into comfort and simplicity with this beautifully refreshed 2-bedroom condo in Golden Valley. From the moment you step in, you’ll notice the brand-new carpet and updated appliances that make everyday living feel easy. The space is clean, functional, and ready for you to move right in—no projects, no delays. Enjoy warm days by the community pool, and appreciate the convenience of your own 1-car garage. Located just minutes from Highway 169, 394, and Highway 55, getting anywhere in the metro is quick and stress-free. With a low, stable HOA and an affordable price point, this is a rare opportunity to own instead of rent without sacrificing comfort or location. Cats, birds, and fish are welcome, so your companions can feel at home too.
-
1979-01-01soldstatus $35,000
ⓘ Source: listings_history table (triggers on properties + properties_extension) + one-shot
backfill from property_details.listing_events for pre-trigger history.
Tax reassessment forecast MN · Partial reset (capped growth)
- Current annual tax
- $1,704 · $142/mo
- Projected year-2 tax
- $1,704 · $142/mo
- Expected delta
- $0/yr ($0/mo · 0.0%)
ⓘ Screening estimate from a state-policy table — verify with the county assessor before closing.
Climate risk First Street
- Flood 1/10 Low FEMA zone X (unshaded) · 0% chance over 30 yrs
- Wildfire 1/10 Low
- Heat 2/10 Low 7 d/yr ≥98°F today · 13 d/yr by 30 yrs out
- Wind 2/10 Low
- Air quality 2/10 Low 2 unhealthy d/yr today · 2 by 30 yrs out
Nearby sold comps map
Loading sold comps map…
Walkable amenities ~0.75 mi
Loading nearby amenities…
Taxation est. · year 1
- Rental income
- $24,329
- − Mortgage interest
- −$6,106
- − Property taxes
- −$1,704
- − Insurance
- −$545
- − Repairs & maintenance
- −$1,946
- − Management
- −$1,946
- − HOA
- −$5,364
- − Depreciation
- −$3,171
- Taxable income
- $3,547
- Est. tax owed @ 24.0%
- −$851
- After-tax cash flow
- $3,897/yr
For passive investors: Depreciation is non-cash, so a rental often shows a tax loss while cash-flowing — sheltering income. Rental losses are passive: they offset passive income freely, and up to $25,000/yr can offset ordinary (W-2) income if you actively participate and your MAGI is under $100k (phasing out to $0 by $150k); unused losses carry forward. On sale, claimed depreciation is recaptured at up to 25%, and gains may owe capital-gains tax (a 1031 exchange can defer both). Figures are a year-1 estimate at your 24.0% rate — not tax advice; consult a CPA.
Schools (NCES district)
- District
- Hopkins Public School District
- NCES district ID
- 2714260
- Math proficiency
- 48% ▼ -6.00%
- Reading proficiency
- 57% ▼ -2.00%
- Median HH income
- $66,915
- Composite
- 46.44/100
- National rank
- #2448
- State rank
- #75 of 301 in MN
Livability — Golden Valley
- Score
- 82/100
- State rank
- #40
- US rank
- #1110
Category grades
Schools grade is shown separately in the Schools card above.
Census & demographics
- Census place
- Golden Valley, MN
- County
- Hennepin County · 1,150,272 people
- City population
- 28,452
- Metro
- Minneapolis-St. Paul-Bloomington, MN-WI
- Population (ZIP)
- 24,764
- Household income
- $92,821
- Rent vs Own
- Severe rent burden
- 663.0
Population outlook (Hennepin County) Hauer SSP2
- Today (2025)
- 1,405,227 people
- By 2030
- 1,492,650 · +6.2%
- By 2040
- 1,660,157 · +18.1%
- By 2050
- 1,823,498 · +29.8%
- By 2075
- 2,221,283 · +58.1%
- By 2100
- 2,509,976 · +78.6%
Race, ethnicity, and origin ACS 2023
- Neighborhood character
- Predominantly White (70%)
- Race & ethnicity
- White 70% Black 13% Two or more races 8% Hispanic / Latino 6% Asian 4%
- Hispanic origin (detail)
- Mexican 4%
- Common ancestry
- Portuguese 12% Scottish 3% Romanian 3%
- Foreign-born
- 13% · Canada, Vietnam
- Languages at home
- 87% English-only · Spanish 5% Russian/Polish/Slavic 2% Other Indo-European 2%
Political lean MEDSL · Hennepin
- 2024 margin
- Solid D (+42.6) · D 70.2% · R 27.5% · Other 2.3%
- 2008→2024 swing
- +14.0pp toward D · 2008: 28.6pp · 2024: 42.6pp
- All cycles
- 2024: D+42.6 2020: D+43.2 2016: D+35.3 2012: D+27.1 2008: D+28.6
Not yet ingested
- Civics
- —
Market trends
- HPI YoY
- ▼ -267.55%
- Current HPI
- 235.3888
- Rent YoY
- ▲ 7.40%
- Metro
- Minneapolis-St. Paul-Bloomington, MN-WI
- State GDP YoY
- ▲ 2.41%
- F500 in state
- 34
Industry mix (Fortune 500 HQ in MN)
| Industry | F500 HQs | Revenue |
|---|---|---|
| Healthcare | 2 | $407B |
|
||
| Retail | 2 | $150B |
|
||
| Consumer Goods | 2 | $32B |
|
||
| Industrial Machinery | 2 | $6B |
|
||
| Agriculture | 1 | $40B |
|
||
| Healthcare / Medical Devices | 1 | $32B |
|
||
Price history
+211.4% since first listed2 events — show timeline
- 2026-04-03 Listed $109,000 NORTHSTARMLS as Distributed by MLS Grid
- 1979-01-01 Sold (Public Records) $35,000 Public Records
Property tax history
+5.9%/yrLatest (2025): $1,704 · +9.5% YoY. Source: county tax records.
Cash-flow waterfall
monthlySold comps — $/sqft
last 12 mo · ≤1 miLoading sold comps…