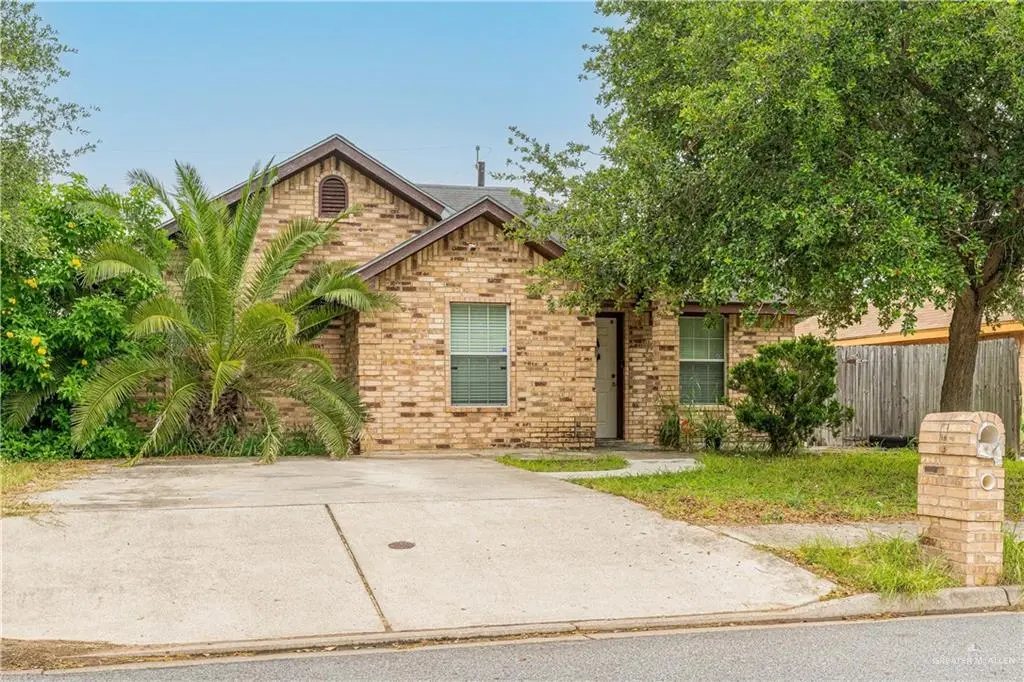
1925 S 31st St · McAllen, TX
Flood risk 5/10 · Moderate
- FEMA flood zone
- X (shaded)
- Chance of flooding over 30 yrs
- 0.24%
- Est. flood insurance / yr
- $507 – $1,088
Fire risk 4/10 · Minor
- Est. fire insurance / yr
- $1,222 – $2,270
Heat risk 9/10 · Severe
- Hot days now (above 111°F)
- 7 days/yr
- Hot days in 30 yrs
- 22 days/yr
Wind risk 8/10 · Major
- Chance of severe wind over 30 yrs
- 98.0%
Air-quality risk 2/10 · Minimal
- Unhealthy air days now
- 1 days/yr
- Unhealthy air days in 30 yrs
- 2 days/yr
Risk factors via First Street. Map © Google.
Why this score? — see what drove the D grade
The composite is a weighted blend of 9 inputs, each scored 0–100. Each bar is that input's sub-score; the figure is the points it added to the 100-point composite (weight × sub-score).
- Cash flow +13.8/30.0
- ARV discount +9.0/15.0
- 1% rule +4.8/10.0
- DSCR +4.2/10.0
- Livability +3.8/5.0
- Schools +3.3/10.0
- Condition / age +2.5/5.0
- Rent growth +1.4/5.0
- Appreciation +0.4/10.0
$157,000
🖨 Deal sheet (PDF) 📄 Offer letter ✓ Due diligence
Listing remarks
Welcome to 1925 S 31st St, a charming McAllen home offering comfort, convenience, and great potential. This 3 bedroom, 1 bathroom home features a functional layout with approximately 1,048 sq ft of living space, making it a great option for first-time buyers, investors, or anyone looking for an affordable opportunity in the heart of McAllen. Located near schools, shopping, dining, and major roadways, this property offers everyday convenience with easy access to everything the city has to offer. Whether you are searching for your next home or a smart investment, 1925 S 31st St is a property worth taking a closer look at. Schedule your showing today and come see the possibilities!
Key facts
- 5,540 sq ft lot
- Built 2010
Property features AI
Finance
- HOA & community: No homeowners association; Community curbs
Exterior
- Parking: No garage, no carport
- Utilities: Public water; City sewer; Electric service
- Home design: Brick construction; Shingle roof; Slab foundation; Paved road access
- Construction: Brick construction; Slab foundation; Shingle roof
- Exterior features: Mature trees; Patio; Curb and gutters
Interior
- Kitchen: Microwave; Electric water heater
- Bedrooms: Living area(s): 1
- Flooring: Tile
- Bathrooms: 1 full bathroom
- Heating & cooling: Central heating (electric); Central air conditioning (electric); Thermostat
- Interior features: Laminate countertops; Ceiling fans; Decorative / high ceilings; Microwave; Mini blinds
- Laundry & utility: Laundry area with washer/dryer connection
Neighborhood map
What this means for you Summary
Snapshot
- This is a 3-bed/1.0-bath single-family listed at $157k.
Deal economics
- At list price, monthly cash flow is $14 ($173/yr) — positive.
- The deal already cash-flows at list — no discount required.
- To meet the 1% rule (rent ≥ 1% of price), the offer needs to be $154k (2.1% below list).
- Recommended offer: $154k (2.1% below list) — sets the bar for 1% rule.
- Cap rate 6.4% vs local median 3.7% in McAllen — top-decile yield for the area; either an underpriced asset or a hidden risk that comps aren't pricing in. Stress-test before assuming the spread holds.
Location & tenants
- Location reads 76/100 on livability (#119 in TX, #3,771 nationally) — a middle-class / working-renter tenant base. Strengths: cost of living A+, housing A+, health & safety A+; Watch: employment D, amenities F, commute F.
- Mcallen ISD (urban): math 34% / reading 45% proficiency, ranked #440 of 826 in TX (top 53%) — families likely to look elsewhere, expect single-tenant / working-renter base with shorter leases.
- Zoned schools: Escandon El (math 17% / reading 17%, grade F, #3,836 of 4,322 statewide, top 91%, 495 students, 94% FRL); Brown Middle (math 24% / reading 17%, grade F, #1,407 of 1,662 statewide, top 86%, 585 students, 90% FRL); Mcallen H S (math 30% / reading 57%, grade F, #704 of 1,632 statewide, top 43%, 2,133 students, 63% FRL) — zoned schools average 82% FRL vs 50% district-wide (32 pts higher); higher-poverty schools than district average — tighter screening recommended.
- Zoned-school proficiency averages 27% at this address vs 40% district-wide (-12 pts) — the specific schools serving this property underperform the Mcallen ISD average; the district grade overstates school quality for this exact location.
- Market conditions: Rents falling (-4.2%/yr); 214 active listings in the ZIP; 40 comparable units currently listed for rent nearby; rentals at typical pace (median 26d on market — plan ~3-4 weeks tenant-placement turnaround); 40% of comp listings sitting > 30 days — soft ceiling on asking rent; 7,378 units permitted in Hidalgo County in 2024 (641 in 5+ unit buildings).
- This rent runs 35% of the median local income ($53k/yr) — at the standard rent-burdened threshold; future hikes will face affordability resistance.
Forward outlook
- Local home prices are declining (-3.0%/yr); year-one equity from $1k of loan paydown is wiped out by about $5k of value loss. Plan a longer hold.
- Hidalgo County population projected at +28% by 2050 — long-run rental-demand tailwind backs the buy-and-hold thesis.
Negotiation context
- Only 1 days on market — expect competitive offers; lowballing is unlikely to land.
Risks & watch-outs
- Climate carrying-cost: moderate flood risk; severe wind risk, 98% chance of damaging wind over 30y; extreme-heat days projected 7→22/yr by 2055 (HVAC capex compounding) — expect insurance premiums to compound above CPI over the hold.
Questions for the listing agent
- Is there a deadline driving the sale (1031 exchange, divorce, estate, relocation)? That informs how much negotiation room exists.
- Schools are B-rated — typically a magnet for longer-tenancy family renters. What's the average tenant stay here, and is there a school-zone premium baked into asking?
- The area grade is low — what's the realistic commute time and amenity access for the typical tenant pool here? Any planned neighborhood developments (good or bad) we should know about?
- What's the average days-on-market for RENTAL listings here right now (not sales)? A rising rental-DOM trend means longer vacancies and softer asking-rent achievability than the comps imply.
- What's the recent tenant-quality profile in this submarket — average credit score on applications, eviction rate, late-payment / NSF rate, and stable-employment percentage? A property-management company in the area should have these aggregated.
- How much new for-sale + rental construction is in the pipeline within 1–3 miles? Heavy new supply typically softens prices + rents 12–24 months out; constrained supply supports both.
Investment metrics
- 1% rule
- 0.98% ✗
- Cap rate
- 6.40%
- Cash-on-cash
- 0.39%
- DSCR
- 1.02
- GRM
- 8.5
CMA / ARV
- ARV (on-the-fly)
- $162,440
- Comps found
- 3
Show comp detail 3 sales within ~0.75 mi
| Address | Dist | Beds/Ba | Sqft | Sold | Price | $/sf | Match |
|---|---|---|---|---|---|---|---|
| 1932 S 32nd St | 0.10mi | 3/1.5 | 1,098 (+5%) | 7mo | $170,000 | $155 | 80 |
| 2117 S 30 1/2 St | 0.23mi | 3/2.0 | 1,161 (+11%) | 11mo | $159,000 | $137 | 58 |
| 709 S 27 1/2 St | 0.72mi | 3/2.0 | 1,148 (+10%) | 13mo | $209,700 | $183 | 36 |
Match score weights: distance 35% · size 25% · config 20% · recency 20%. Top-matched comps best support the ARV.
Projected returns pro-forma
-3.0% appreciation · 0.0% rent growth · sell at horizon
- IRR
- -19.4%
- Equity multiple
- 0.34×
- Total profit
- $-28,938
- Equity at exit
- $23,409
- IRR
- -21.2%
- Equity multiple
- 0.07×
- Total profit
- $-41,053
- Equity at exit
- $13,574
Cash invested: $43,960 (down + closing). Projections, not guarantees.
Landlord ↔ Tenant lean methodology
- Overall (STATE)
- 87 Strongly Landlord-Friendly
- State Texas
- 87 Strongly Landlord-Friendly · R+5
- County
- — inherits STATE
- City
- — inherits STATE
ZIP-level market 78503
- Home prices YoY
- -4.2%
- Rents YoY
- -4.2%
- Active inventory
- 214
- Price-to-rent
- 8.5×
Monthly cashflow live
- Estimated rent
- $1,538 high interval (Pro) →
- Mortgage (P&I)
- −$823
- Tax from tax record
- −$312 /mo · $3,741/yr
- Insurance
- −$65
- HOA
- −$0
- Vacancy / Maint / Mgmt
- −$323
- Net cashflow
- $14
Break-even live
Sensitivity live
| Price | -10% $103 | -5% $59 | +0% $14 | +5% $-30 | +10% $-74 |
|---|---|---|---|---|---|
| Rent | -10% $-107 | -5% $-46 | +0% $14 | +5% $75 | +10% $136 |
| Rate | -1.0pp $93 | -0.5pp $54 | base $14 | +0.5pp $-26 | +1.0pp $-68 |
UW: 25.0% down · 7.5% · 30yr · 1.5% tax · 5.0% vac · 8.0% maint · 8.0% mgmt
Financing live
Cash to close
- Down payment
- $39,250
- Closing costs
- $4,710
- Reserves months
- —
- Total cash needed
- —
Loan-product check · same deal, 3 products live
Conventional
25% down · 7.5% · 30yr
- Down + closing
- —
- Monthly P&I
- —
- Monthly cashflow
- —
- DSCR
- —
- Eligible?
- —
Personal DTI + credit; lowest rate.
DSCR
20% down · 8.5% · 30yr
- Down + closing
- —
- Monthly P&I
- —
- Monthly cashflow
- —
- DSCR
- —
- Eligible?
- —
No personal income docs; deal must DSCR.
Hard money
10% down · 12.0% · 12mo
- Down + closing
- —
- Monthly P&I
- —
- Monthly cashflow
- —
- DSCR
- —
- Eligible?
- —
Short-term bridge; refi at stabilization.
Rent comps 40 comps
| Address | Beds | Baths | Sqft | Rent | $/sqft | DOM | Units | Dist |
|---|---|---|---|---|---|---|---|---|
| 1901 S 38th St Unit 11 MCALLEN 78503 McAllen, TX | 2.0 | 2.0 | 880 | $920 | $1.05 | 45d | 1 | 0.40mi |
| 2500 S Ware Rd Unit 34 McAllen, TX | 2.0 | 1.0 | 730 | $800 | $1.10 | 45d | 1 | 0.59mi |
| 4217 Colbath Ave McAllen, TX | 3.0 | 2.0 | 1250 | $1,550 | $1.24 | 25d | 5 | 0.72mi |
| 4217 Colbath Ave McAllen, TX | 3.0 | 2.0 | 1250 | $1,550 | $1.24 | 16d | 4 | 0.72mi |
| 4217 Colbath Ave Unit 430A McAllen, TX | 3.0 | 2.0 | 1307 | $1,500 | $1.15 | 25d | 1 | 0.74mi |
| 4217 Colbath Ave Unit 220B McAllen, TX | 3.0 | 2.0 | 1168 | $1,500 | $1.28 | 25d | 1 | 0.74mi |
| 4217 Colbath Ave Unit 320A McAllen, TX | 3.0 | 2.0 | 1307 | $1,500 | $1.15 | 25d | 1 | 0.74mi |
| 4217 Colbath Ave Unit 210A McAllen, TX | 3.0 | 2.0 | 1333 | $1,700 | $1.28 | 25d | 1 | 0.74mi |
| 2313 N 43rd St Unit 1 McAllen, TX | 2.0 | 2.0 | 950 | $1,300 | $1.37 | 45d | 1 | 0.86mi |
| 317 S 28th St Unit 3 McAllen, TX | 2.0 | 1.0 | 800 | $800 | $1.00 | 45d | 1 | 0.99mi |
| 317 S 28th St Unit 4 McAllen, TX | 2.0 | 1.0 | 800 | $750 | $0.94 | 45d | 1 | 0.99mi |
| 4912 Toronto Ave Unit 2 McAllen, TX | 2.0 | 2.5 | 1333 | $1,670 | $1.25 | 16d | 1 | 1.07mi |
| 4808 Toronto Ave McAllen, TX | 3.0 | 2.5 | 1333 | $1,545 | $1.16 | 21d | 1 | 1.07mi |
| 4904 Toronto Ave Unit 1 McAllen, TX | 3.0 | 2.5 | 1333 | $1,545 | $1.16 | 21d | 1 | 1.07mi |
| 4908 Toronto Ave McAllen, TX | 3.0 | 2.5 | 1333 | $1,545 | $1.16 | 21d | 1 | 1.07mi |
| 4808 Toronto Ave Unit 1 McAllen, TX | 3.0 | 2.5 | 1333 | $1,545 | $1.16 | 16d | 1 | 1.07mi |
| 4916 Toronto Ave McAllen, TX | 3.0 | 2.5 | 1333 | $1,545 | $1.16 | 16d | 1 | 1.07mi |
| 4800 Tyler Ave Unit 3 McAllen, TX | 3.0 | 2.5 | 1412 | $1,995 | $1.41 | 16d | 1 | 1.08mi |
| 4904 Tyler Ave Unit 4 McAllen, TX | 3.0 | 2.5 | 1412 | $1,745 | $1.24 | 25d | 1 | 1.08mi |
| 4804 Tyler Ave Unit 1 McAllen, TX | 3.0 | 2.5 | 1412 | $1,950 | $1.38 | 16d | 1 | 1.08mi |
| 4908 Tyler Ave McAllen, TX | 3.0 | 2.5 | 1412 | $1,695 | $1.20 | 46d | 1 | 1.08mi |
| 4804 Tyler Ave McAllen, TX | 3.0 | 2.5 | 1412 | $1,745 | $1.24 | 25d | 1 | 1.08mi |
| 4912 Tyler Ave Apt 2 McAllen, TX | 3.0 | 2.5 | 1412 | $1,745 | $1.24 | 25d | 1 | 1.08mi |
| 4912 Tyler Ave McAllen, TX | 3.0 | 2.5 | 1412 | $1,695 | $1.20 | 45d | 1 | 1.08mi |
| 4908 Tyler Ave Apt 1 McAllen, TX | 3.0 | 2.5 | 1412 | $1,745 | $1.24 | 25d | 1 | 1.08mi |
| 4901 Tyler Ave McAllen, TX | 3.0 | 2.5 | 1333 | $1,545 | $1.16 | 25d | 1 | 1.09mi |
| 4905 Tyler Ave Unit 3 McAllen, TX | 3.0 | 2.5 | 1333 | $1,890 | $1.42 | 45d | 1 | 1.09mi |
| 4905 Tyler Ave McAllen, TX | 3.0 | 2.5 | 1333 | $1,545 | $1.16 | 21d | 1 | 1.09mi |
| 4805 Tyler Ave McAllen, TX | 3.0 | 2.5 | 1333 | $1,545 | $1.16 | 25d | 1 | 1.09mi |
| 4905 Tyler Ave Unit 4 McAllen, TX | 2.0 | 2.5 | 1077 | $1,750 | $1.62 | 45d | 1 | 1.09mi |
| 4909 Tyler Ave Apt 3 McAllen, TX | 3.0 | 2.5 | 1333 | $1,545 | $1.16 | 25d | 1 | 1.09mi |
| 4901 Tyler Ave Unit 3 McAllen, TX | 3.0 | 2.5 | 1333 | $1,795 | $1.35 | 45d | 1 | 1.09mi |
| 4801 Tyler Ave Unit 2 McAllen, TX | 2.0 | 2.5 | 1077 | $1,750 | $1.62 | 45d | 1 | 1.09mi |
| 4801 Tyler Ave McAllen, TX | 3.0 | 2.5 | 1333 | $1,495 | $1.12 | 45d | 1 | 1.09mi |
| 1700 Toronto Ave McAllen, TX | 3.0 | 2.0 | 1500 | $1,750 | $1.17 | 45d | 1 | 1.14mi |
| 2114 Galveston Ave W Unit 3 McAllen, TX | 3.0 | 2.5 | 1064 | $1,350 | $1.27 | 45d | 1 | 1.15mi |
| 2108 Galveston Ave W Unit 4 McAllen, TX | 3.0 | 2.5 | 1064 | $1,500 | $1.41 | 45d | 1 | 1.15mi |
| 2108 Galveston Ave W Unit 5 McAllen, TX | 3.0 | 2.5 | 1064 | $1,350 | $1.27 | 45d | 1 | 1.15mi |
| 4900 Toronto Ave McAllen, TX | 3.0 | 2.5 | 1333 | $1,545 | $1.16 | 25d | 1 | 1.16mi |
| 4900 Tyler Ave McAllen, TX | 2.0–3.0 | 2.5 | 1244 | $1,745 | $1.40 | 16d | 1 | 1.18mi |
Listing history 2 events
-
2026-06-03remarks 687-char remark
-
2026-06-03$157,000 Active 1 DOM
ⓘ Source: listings_history table (triggers on properties + properties_extension) + one-shot
backfill from property_details.listing_events for pre-trigger history.
Tax reassessment forecast TX · Resets to sale price
- Current annual tax
- $3,741 · $312/mo
- Projected year-2 tax
- $3,741 · $312/mo
- Expected delta
- $0/yr ($0/mo · 0.0%)
ⓘ Screening estimate from a state-policy table — verify with the county assessor before closing.
Climate risk First Street
- Flood 5/10 Major FEMA zone X (shaded) · 24% chance over 30 yrs
- Wildfire 4/10 Moderate
- Heat 9/10 Extreme 7 d/yr ≥111°F today · 22 d/yr by 30 yrs out
- Wind 8/10 Severe 98% chance of damaging wind over 30 yrs
- Air quality 2/10 Low 1 unhealthy d/yr today · 2 by 30 yrs out
Nearby sold comps map
Loading sold comps map…
Walkable amenities ~0.75 mi
Loading nearby amenities…
Taxation est. · year 1
- Rental income
- $18,454
- − Mortgage interest
- −$8,794
- − Property taxes
- −$3,741
- − Insurance
- −$785
- − Repairs & maintenance
- −$1,476
- − Management
- −$1,476
- − Depreciation
- −$4,567
- Taxable loss
- −$2,387
- Est. tax savings @ 24.0%
- +$573
- After-tax cash flow
- $745/yr
For passive investors: Depreciation is non-cash, so a rental often shows a tax loss while cash-flowing — sheltering income. Rental losses are passive: they offset passive income freely, and up to $25,000/yr can offset ordinary (W-2) income if you actively participate and your MAGI is under $100k (phasing out to $0 by $150k); unused losses carry forward. On sale, claimed depreciation is recaptured at up to 25%, and gains may owe capital-gains tax (a 1031 exchange can defer both). Figures are a year-1 estimate at your 24.0% rate — not tax advice; consult a CPA.
Schools (NCES district)
- District
- Mcallen ISD
- NCES district ID
- 4829670
- Math proficiency
- 34% ▼ -22.00%
- Reading proficiency
- 45% ▼ -5.00%
- Median HH income
- $40,805
- Composite
- 33.16/100
- National rank
- #5551
- State rank
- #440 of 826 in TX
Livability — McAllen
- Score
- 76/100
- State rank
- #119
- US rank
- #3771
Category grades
Schools grade is shown separately in the Schools card above.
Census & demographics
- Census place
- McAllen, TX
- County
- Hidalgo County · 623,128 people
- City population
- 144,650
- Metro
- McAllen-Edinburg-Mission, TX
- Population (ZIP)
- 22,621
- Household income
- $53,322
- Rent vs Own
- Severe rent burden
- 762.0
Population outlook (Hidalgo County) Hauer SSP2
- Today (2025)
- 955,232 people
- By 2030
- 1,009,774 · +5.7%
- By 2040
- 1,120,332 · +17.3%
- By 2050
- 1,225,036 · +28.2%
- By 2075
- 1,439,189 · +50.7%
- By 2100
- 1,533,429 · +60.5%
Race, ethnicity, and origin ACS 2023
- Neighborhood character
- Predominantly Hispanic (92%)
- Race & ethnicity
- Hispanic / Latino 92% Two or more races 34% White 3% Asian 1%
- Hispanic origin (detail)
- Mexican 88%
- Common ancestry
- Lithuanian 2%
- Foreign-born
- 29% · Canada
- Languages at home
- 13% English-only · Spanish 86%
Political lean MEDSL · Hidalgo
- 2024 margin
- Toss-up / Even · D 48.1% · R 51.0%
- 2008→2024 swing
- -41.6pp toward R · 2008: 38.7pp · 2024: -2.9pp
- All cycles
- 2024: R+2.9 2020: D+17.1 2016: D+40.5 2012: D+41.8 2008: D+38.7
Not yet ingested
- Civics
- —
Market trends
- HPI YoY
- ▼ -9.15%
- Current HPI
- 208.4757
- Rent YoY
- ▼ -4.21%
- Metro
- McAllen-Edinburg-Mission, TX
- State GDP YoY
- ▲ 3.95%
- F500 in state
- 110
Industry mix (Fortune 500 HQ in TX)
| Industry | F500 HQs | Revenue |
|---|---|---|
| Energy | 16 | $1,198B |
|
||
| Technology | 5 | $198B |
|
||
| Engineering / Construction | 4 | $72B |
|
||
| Energy Services | 3 | $60B |
|
||
| Utilities | 3 | $41B |
|
||
| Healthcare | 2 | $330B |
|
||
Price history
2 events — show timeline
- 2026-06-03 Listed $157,000 MCALLENMLS
- 2003-12-05 Sold (Public Records) — Public Records
Property tax history
+7.2%/yrLatest (2025): $3,741 · +15.3% YoY. Source: county tax records.
Cash-flow waterfall
monthlySold comps — $/sqft
last 12 mo · ≤1 miLoading sold comps…