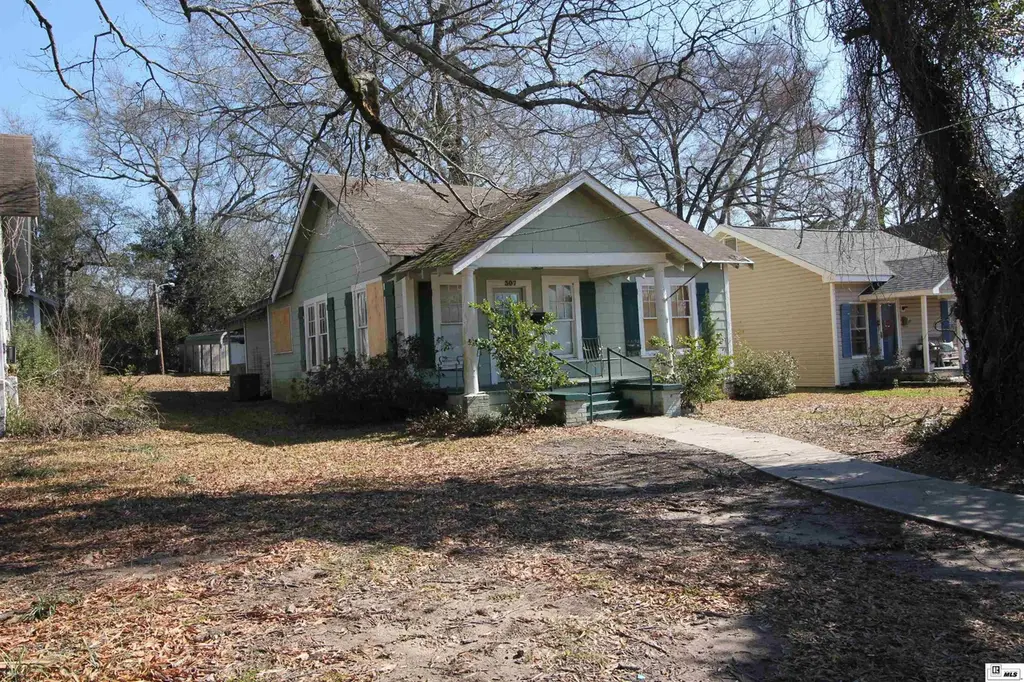
307 S Bevill St · Winnfield, LA
Flood risk No data
- FEMA flood zone
- —
- Chance of flooding over 30 yrs
- —
- Est. flood insurance / yr
- —
Fire risk No data
- Est. fire insurance / yr
- —
Heat risk No data
- Hot days now (above threshold)
- —
- Hot days in 30 yrs
- —
Wind risk No data
- Chance of severe wind over 30 yrs
- —
Air-quality risk No data
- Unhealthy air days now
- —
- Unhealthy air days in 30 yrs
- —
Risk factors via First Street. Map © Google.
Why this score? — see what drove the A- grade
The composite is a weighted blend of 9 inputs, each scored 0–100. Each bar is that input's sub-score; the figure is the points it added to the 100-point composite (weight × sub-score).
- Cash flow +30.0/30.0
- ARV discount +15.0/15.0
- 1% rule +10.0/10.0
- DSCR +10.0/10.0
- Appreciation +6.6/10.0
- Livability +2.9/5.0
- Rent growth +2.5/5.0
- Condition / age +2.5/5.0
- Schools +2.0/10.0
$65,000
🖨 Deal sheet 📄 Offer letter ✓ Due diligence
Listing remarks MLS
Investment potential! Calling all flippers and DIY enthusiasts, this 3 bedroom home in the heart of winnfield offers a great opportunity. Close to the center of town with a quick drive to all local amenities. Features a front and back porch and an additional storage building in the back yard. Schedule your tour today!
Key facts
- Front and back porch
- Listed 132 days
Tags
Neighborhood map
What this means for you Summary
Snapshot
- This is a 3-bed/1.0-bath single-family listed at $65k.
Deal economics
- At list price, monthly cash flow is $369 ($4k/yr) — positive.
- The deal already cash-flows at list — no discount required.
- Meets the 1% rule at list price ($987 rent vs $65k).
- Recommended offer: $57k (12.0% below list) — sets the bar for market timing.
Location & tenants
- Location reads 57/100 on livability (#319 in LA) — a working-class tenant base; expect higher turnover. Strengths: cost of living A+, housing A; Watch: health & safety C-, crime F, amenities F.
- Winn Parish (rural): math 20% / reading 30% proficiency, ranked #61 of 98 in LA (top 62%) — low school quality limits family demand, transient renter base, plan for 1-2y turnover; 66% free/reduced lunch — lower-income household profile, screen leases tightly.
- Market conditions: 28 active listings in the ZIP; 1 units permitted in Winn Parish in 2024 (0 in 5+ unit buildings).
Forward outlook
- In year one you build about $3k of equity ($449 loan paydown + $2k appreciation (3.2% local appreciation)).
- Winn County population projected at -24% by 2050 — secular population decline; favor cash flow + early exit over multi-decade hold.
- At projected returns (3.2% appreciation + 3.0% rent growth), your $18k cash investment doubles in ~3 years — after that, you're playing with house money.
Negotiation context
- It's been on market 132 days — a 12% lower offer ($57k) is reasonable based on typical stale-listing flexibility.
- 2 sale attempts since 7y ago with the ask held roughly flat each time — persistent listings suggest the price (not the market) is what's stuck; bring a comps-based counter.
Questions for the listing agent
- It's been on market 132 days. Have you received any prior offers? Is the seller open to a 12% concession, seller financing, or rate buy-down credit?
- Why hasn't it sold? Are there any deal-killer items the seller is aware of (foundation, flood, title, zoning, code violations)?
- Is there a deadline driving the sale (1031 exchange, divorce, estate, relocation)? That informs how much negotiation room exists.
- Crime grade is F in this area — have there been break-ins, vandalism, or insurance claims at this property in the last 3 years? What carrier currently insures it and at what premium?
- What's the average days-on-market for RENTAL listings here right now (not sales)? A rising rental-DOM trend means longer vacancies and softer asking-rent achievability than the comps imply.
- What's the recent tenant-quality profile in this submarket — average credit score on applications, eviction rate, late-payment / NSF rate, and stable-employment percentage? A property-management company in the area should have these aggregated.
- How much new for-sale + rental construction is in the pipeline within 1–3 miles? Heavy new supply typically softens prices + rents 12–24 months out; constrained supply supports both.
Investment metrics
- 1% rule
- 1.52% ✓
- Cap rate
- 13.11%
- Cash-on-cash
- 24.36%
- DSCR
- 2.08
- GRM
- 5.5
CMA / ARV
- ARV (median comp)
- $88,053
- List price
- $65,000
- Delta
- -26.18%
- Verdict
- UNDERPRICED
- Comps
- 3 within 1.0 mi
Show comp detail 2 sales within ~0.75 mi
| Address | Dist | Beds/Ba | Sqft | Sold | Price | $/sf | Match |
|---|---|---|---|---|---|---|---|
| 301 Pecan St | 0.51mi | 3/1.0 | 1,245 (+4%) | 3mo | $124,500 | $100 | 67 |
| 1306 N Boundary St | 0.59mi | 3/1.5 | 1,309 (+9%) | 20mo | $35,000 | $27 | 39 |
Match score weights: distance 35% · size 25% · config 20% · recency 20%. Top-matched comps best support the ARV.
Projected returns pro-forma
3.19% appreciation · 3.0% rent growth · sell at horizon
- IRR
- 30.8%
- Equity multiple
- 2.76×
- Total profit
- $31,998
- Equity at exit
- $29,913
- IRR
- 31.0%
- Equity multiple
- 5.40×
- Total profit
- $80,135
- Equity at exit
- $46,641
Cash invested: $18,200 (down + closing). Projections, not guarantees.
Landlord ↔ Tenant lean methodology
- Overall (STATE)
- 90 Strongly Landlord-Friendly
- State Louisiana
- 90 Strongly Landlord-Friendly · R+12
- County
- — inherits STATE
- City
- — inherits STATE
ZIP-level market 71483
- Home prices YoY
- 3.9%
- Active inventory
- 28
- Price-to-rent
- 5.5×
Monthly cashflow live
- Estimated rent
- $987 medium interval (Pro) →
- Mortgage (P&I)
- −$341
- Tax from tax record
- −$43 /mo · $510/yr
- Insurance
- −$27
- HOA
- −$0
- Vacancy / Maint / Mgmt
- −$207
- Net cashflow
- $369
Break-even live
UW: 25.0% down · 7.5% · 30yr · 1.5% tax · 5.0% vac · 8.0% maint · 8.0% mgmt
Financing live
Cash to close
- Down payment
- $16,250
- Closing costs
- $1,950
- Reserves months
- —
- Total cash needed
- —
Loan-product check · same deal, 3 products live
Conventional
25% down · 7.5% · 30yr
- Down + closing
- —
- Monthly P&I
- —
- Monthly cashflow
- —
- DSCR
- —
- Eligible?
- —
Personal DTI + credit; lowest rate.
DSCR
20% down · 8.5% · 30yr
- Down + closing
- —
- Monthly P&I
- —
- Monthly cashflow
- —
- DSCR
- —
- Eligible?
- —
No personal income docs; deal must DSCR.
Hard money
10% down · 12.0% · 12mo
- Down + closing
- —
- Monthly P&I
- —
- Monthly cashflow
- —
- DSCR
- —
- Eligible?
- —
Short-term bridge; refi at stabilization.
Listing history 17 events
-
2026-06-18days on market $65,000 Active 132 DOM
-
2026-06-17days on market $65,000 Active 131 DOM
-
2026-06-16days on market $65,000 Active 130 DOM
-
2026-06-15days on market $65,000 Active 129 DOM
-
2026-06-13days on market $65,000 Active 127 DOM
-
2026-06-12days on market $65,000 Active 126 DOM
-
2026-06-09days on market $65,000 Active 123 DOM
-
2026-06-08days on market $65,000 Active 122 DOM
-
2026-06-07days on market $65,000 Active 121 DOM
-
2026-06-07days on market $65,000 Active 120 DOM
-
2026-06-04days on market $65,000 Active 117 DOM
-
2026-06-02days on market $65,000 Active 116 DOM
-
2026-06-01days on market $65,000 Active 115 DOM
-
2026-05-31days on market $65,000 Active 114 DOM
-
2026-05-31days on market $65,000 Active 113 DOM
-
2026-01-19$65,000 Active 319-char remark
Show marketing remark (319 chars)
Investment potential! Calling all flippers and DIY enthusiasts, this 3 bedroom home in the heart of winnfield offers a great opportunity. Close to the center of town with a quick drive to all local amenities. Features a front and back porch and an additional storage building in the back yard. Schedule your tour today!
-
2019-05-13$65,000
ⓘ Source: listings_history table (triggers on properties + properties_extension) + one-shot
backfill from property_details.listing_events for pre-trigger history.
Tax reassessment forecast LA · Resets to sale price
- Current annual tax
- $510 · $43/mo
- Projected year-2 tax
- $510 · $43/mo
- Expected delta
- $0/yr ($0/mo · -0.0%)
ⓘ Screening estimate from a state-policy table — verify with the county assessor before closing.
Nearby sold comps map
Loading sold comps map…
Walkable amenities ~0.75 mi
Loading nearby amenities…
Taxation est. · year 1
- Rental income
- $11,847
- − Mortgage interest
- −$3,641
- − Property taxes
- −$510
- − Insurance
- −$325
- − Repairs & maintenance
- −$948
- − Management
- −$948
- − Depreciation
- −$1,891
- Taxable income
- $3,584
- Est. tax owed @ 24.0%
- −$860
- After-tax cash flow
- $3,573/yr
For passive investors: Depreciation is non-cash, so a rental often shows a tax loss while cash-flowing — sheltering income. Rental losses are passive: they offset passive income freely, and up to $25,000/yr can offset ordinary (W-2) income if you actively participate and your MAGI is under $100k (phasing out to $0 by $150k); unused losses carry forward. On sale, claimed depreciation is recaptured at up to 25%, and gains may owe capital-gains tax (a 1031 exchange can defer both). Figures are a year-1 estimate at your 24.0% rate — not tax advice; consult a CPA.
Schools (NCES district)
- District
- Winn Parish
- NCES district ID
- 2202010
- Math proficiency
- 20% ▼ -38.00%
- Reading proficiency
- 30% ▼ -39.00%
- Median HH income
- $32,872
- Composite
- 20.39/100
- National rank
- #8592
- State rank
- #61 of 98 in LA
Livability — Winnfield
- Score
- 57/100
- State rank
- #319
- US rank
- #21768
Category grades
Schools grade is shown separately in the Schools card above.
Census & demographics
- Census place
- Winnfield, LA
- Population (ZIP)
- 9,360
Population outlook (Winn County) Hauer SSP2
- Today (2025)
- 13,367 people
- By 2030
- 12,675 · -5.2%
- By 2040
- 11,391 · -14.8%
- By 2050
- 10,231 · -23.5%
- By 2075
- 7,699 · -42.4%
- By 2100
- 5,547 · -58.5%
Race, ethnicity, and origin ACS 2023
- Neighborhood character
- Diverse neighborhood (Simpson 0.59)
- Race & ethnicity
- White 53% Black 35% Hispanic / Latino 10% Two or more races 4%
- Hispanic origin (detail)
- Mexican 2% Cuban 2%
- Common ancestry
- Lithuanian 3% Slovak 2% Serbian 1%
- Foreign-born
- 7% · Canada, Jamaica
- Languages at home
- 92% English-only · Spanish 4% Other Indo-European 1% French/Haitian/Cajun 1%
Political lean MEDSL · Winn
- 2024 margin
- Solid R (+54.4) · D 22.4% · R 76.8%
- 2008→2024 swing
- -16.2pp toward R · 2008: -38.2pp · 2024: -54.4pp
- All cycles
- 2024: R+54.4 2020: R+49.4 2016: R+46.5 2012: R+40.1 2008: R+38.2
Not yet ingested
- Civics
- —
Market trends
- HPI YoY
- ▲ 3.19%
- Current HPI
- 84.0519
- Rent YoY
- —
- Metro
- —
- State GDP YoY
- ▲ 3.29%
- F500 in state
- 10
Industry mix (Fortune 500 HQ in LA)
| Industry | F500 HQs | Revenue |
|---|---|---|
| Telecommunications | 2 | $23B |
|
||
| Utilities | 1 | $12B |
|
||
| Wholesale / Distribution | 1 | $5B |
|
||
| Advertising | 1 | $2B |
|
||
Price history
+0.0% since first listed2 events — show timeline
- 2026-01-19 Listed $65,000 NELABOR
- 2019-05-13 Listed $65,000 AcadianaMLS
Property tax history
-2.0%/yrLatest (2025): $510 · +0.0% YoY. Source: county tax records.
Cash-flow waterfall
monthlySold comps — $/sqft
last 12 mo · ≤1 miLoading sold comps…