 Duplex
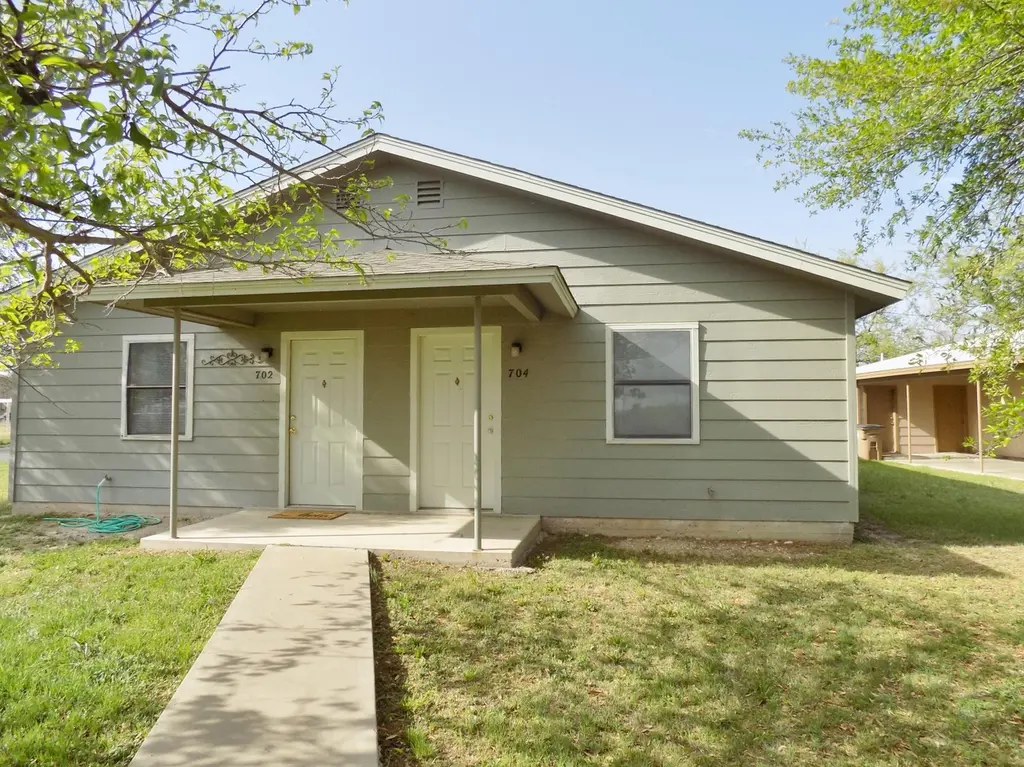
702 E Highland Blvd · San Angelo, TX
Flood risk 1/10 · Minimal
- FEMA flood zone
- X (unshaded)
- Chance of flooding over 30 yrs
- 0.0%
- Est. flood insurance / yr
- $507 – $1,088
Fire risk 4/10 · Minor
- Est. fire insurance / yr
- $1,222 – $2,270
Heat risk 7/10 · Major
- Hot days now (above 104°F)
- 7 days/yr
- Hot days in 30 yrs
- 23 days/yr
Wind risk 4/10 · Minor
- Chance of severe wind over 30 yrs
- 15.0%
Air-quality risk 1/10 · Minimal
- Unhealthy air days now
- 0 days/yr
- Unhealthy air days in 30 yrs
- 0 days/yr
Risk factors via First Street. Map © Google.
Why this score? — see what drove the C grade
The composite is a weighted blend of 9 inputs, each scored 0–100. Each bar is that input's sub-score; the figure is the points it added to the 100-point composite (weight × sub-score).
- Cash flow +23.9/30.0
- DSCR +7.7/10.0
- ARV discount +7.5/15.0
- 1% rule +6.8/10.0
- Rent growth +4.6/5.0
- Livability +3.7/5.0
- Schools +2.6/10.0
- Condition / age +2.5/5.0
- Appreciation +0.0/10.0
$211,250
🖨 Deal sheet 📄 Offer letter ✓ Due diligence
Multi-family units
County records classify this as Multi-Family (2-4 Unit). Listing-text estimate: 2 units. confirmed
Listing remarks MLS
Actual Addresses are: 702, 704, 706, 708, 712, 714 Highland. Attention Investors! 3 duplexes are priced to have great cashflow with $2625.00 rental income. 4 - 2 bedroom, 1 bath units and 2 - 1 bedroom, 1 bath unit. built in 1988. Call today for an appointment.
Key facts
- 6,316 sq ft lot
- 2 parking spots
- Built 1988
Property features AI
Exterior
- Parking: Carport; Detached carport; 2 carport spaces
- Security: Smoke detector(s)
- Utilities: Public water; Public sewer; Electricity connected; Water connected; Sewer connected
- Home design: Duplex (residential income property); One level
- Exterior features: Paved, public-maintained city street frontage; Residential lot zoning; Lot dimensions approximately 50 x 137 (0.15 acres)
Interior
- Heating & cooling: Central heating (electric); Central air conditioning (electric); Ceiling fan(s)
- Interior features: Ceiling fans; Smoke detectors; Electric water heater
Neighborhood map
What this means for you Summary
Snapshot
- This is a 2 × 2-bed/1-bath units multifamily listed at $211k.
Deal economics
- At list price, monthly cash flow is $409 ($5k/yr) — positive. Per door: $204/mo.
- The deal already cash-flows at list — no discount required.
- Meets the 1% rule at list price ($2k rent vs $211k).
- Recommended offer: $208k (1.5% below list) — sets the bar for market timing.
- Cap rate 8.6% vs local median 3.8% in San Angelo — top-decile yield for the area; either an underpriced asset or a hidden risk that comps aren't pricing in. Stress-test before assuming the spread holds.
Location & tenants
- Location reads 73/100 on livability (#199 in TX) — a middle-class / working-renter tenant base. Strengths: cost of living A+, housing A+, health & safety A+; Watch: employment C-, amenities F, commute F.
- San Angelo ISD (urban): math 27% / reading 33% proficiency, ranked #627 of 826 in TX (top 76%) — families likely to look elsewhere, expect single-tenant / working-renter base with shorter leases.
- Zoned schools: Ft Concho El (math 59% / reading 65%, grade B, #321 of 4,322 statewide, top 8%, 476 students, 46% FRL); Glenn Middle (math 25% / reading 29%, grade F, #1,177 of 1,662 statewide, top 72%, 1,258 students, 53% FRL); Central H S (math 22% / reading 43%, grade F, #1,029 of 1,632 statewide, top 64%, 3,065 students, 48% FRL) — zoned schools at 49% FRL track the district average.
- Market conditions: Rents rising fast (+8.5%/yr); 227 active listings in the ZIP; 4 comparable units currently listed for rent nearby; rentals at typical pace (median 21d on market — plan ~3-4 weeks tenant-placement turnaround); 233 units permitted in Tom Green County in 2024 (0 in 5+ unit buildings).
- At $2,493/mo this rent would consume 60% of the median local household income ($49k/yr) (locally 1255% of renters already pay >50% of income on rent) — very limited rent-growth headroom before tenants either downsize or default.
Forward outlook
- Local home prices are declining (-3.0%/yr); year-one equity from $1k of loan paydown is wiped out by about $6k of value loss. Plan a longer hold.
- Tom Green County population projected at +35% by 2050 — long-run rental-demand tailwind backs the buy-and-hold thesis.
- At projected returns (-3.0% appreciation + 8.0% rent growth), your $59k cash investment doubles in ~8 years — after that, you're playing with house money.
Negotiation context
- It's been on market 19 days — a 2% lower offer ($208k) is reasonable based on typical stale-listing flexibility.
- 2 sale attempts since 14y ago with the ask held roughly flat each time — persistent listings suggest the price (not the market) is what's stuck; bring a comps-based counter.
Risks & watch-outs
- Climate carrying-cost: extreme-heat days projected 7→23/yr by 2055 (HVAC capex compounding) — expect insurance premiums to compound above CPI over the hold.
Questions for the listing agent
- Can we see the unit-by-unit rent roll, current vacancy, and any below-market leases? What's the average tenancy length?
- What capital expenditures (roof, boiler, parking lot, exteriors) have been made in the last 5 years, and what's planned in the next 2?
- Is there a deadline driving the sale (1031 exchange, divorce, estate, relocation)? That informs how much negotiation room exists.
- Schools are F-rated, which usually means shorter tenancies and higher turnover. Who's the typical renter profile here, and what's been the actual vacancy rate?
- What's the average days-on-market for RENTAL listings here right now (not sales)? A rising rental-DOM trend means longer vacancies and softer asking-rent achievability than the comps imply.
- What's the recent tenant-quality profile in this submarket — average credit score on applications, eviction rate, late-payment / NSF rate, and stable-employment percentage? A property-management company in the area should have these aggregated.
- How much new apartment / multifamily construction is in the pipeline within 1–3 miles? Heavy new supply (>2% of stock underway) typically softens rents 12–24 months out; light construction supports rent growth.
Investment metrics
- 1% rule
- 1.18% ✓
- Cap rate
- 8.62%
- Cash-on-cash
- 8.30%
- DSCR
- 1.37
- GRM
- 7.1
CMA / ARV
- ARV (on-the-fly)
- $61,880
- Comps found
- 1
Show comp detail 1 sale within ~0.75 mi
| Address | Dist | Beds/Ba | Sqft | Sold | Price | $/sf | Match |
|---|---|---|---|---|---|---|---|
| 513 Powell St | 0.29mi | —/— | 1,942 (+10%) | 2mo | $67,100 | $35 | 68 |
Match score weights: distance 35% · size 25% · config 20% · recency 20%. Top-matched comps best support the ARV.
Projected returns pro-forma
-3.0% appreciation · 8.0% rent growth · sell at horizon
- IRR
- 2.1%
- Equity multiple
- 1.09×
- Total profit
- $5,092
- Equity at exit
- $31,498
- IRR
- 16.3%
- Equity multiple
- 2.66×
- Total profit
- $98,344
- Equity at exit
- $18,265
Cash invested: $59,150 (down + closing). Projections, not guarantees.
Landlord ↔ Tenant lean methodology
- Overall (STATE)
- 87 Strongly Landlord-Friendly
- State Texas
- 87 Strongly Landlord-Friendly · R+5
- County
- — inherits STATE
- City
- — inherits STATE
ZIP-level market 76903
- Rents YoY
- 8.5%
- Active inventory
- 227
- Price-to-rent
- 14.1×
Monthly cashflow live
- Estimated rent
- $2,493 high interval (Pro) →
- Mortgage (P&I)
- −$1,108
- Tax from tax record
- −$365 /mo · $4,376/yr
- Insurance
- −$88
- HOA
- −$0
- Vacancy / Maint / Mgmt
- −$524
- Net cashflow
- $409
Break-even live
2-unit breakdown (identical units grouped — click to expand)
| Units | Beds | Baths | Est. rent |
|---|---|---|---|
| 2× units | 2 | 1 | $2,494 |
| #1 | 2 | 1 | $1,247 |
| #2 | 2 | 1 | $1,247 |
| Total (2 units) | $2,493 | ||
UW: 25.0% down · 7.5% · 30yr · 1.5% tax · 5.0% vac · 8.0% maint · 8.0% mgmt
Financing live
Cash to close
- Down payment
- $52,812
- Closing costs
- $6,338
- Reserves months
- —
- Total cash needed
- —
Loan-product check · same deal, 3 products live
Conventional
25% down · 7.5% · 30yr
- Down + closing
- —
- Monthly P&I
- —
- Monthly cashflow
- —
- DSCR
- —
- Eligible?
- —
Personal DTI + credit; lowest rate.
DSCR
20% down · 8.5% · 30yr
- Down + closing
- —
- Monthly P&I
- —
- Monthly cashflow
- —
- DSCR
- —
- Eligible?
- —
No personal income docs; deal must DSCR.
Hard money
10% down · 12.0% · 12mo
- Down + closing
- —
- Monthly P&I
- —
- Monthly cashflow
- —
- DSCR
- —
- Eligible?
- —
Short-term bridge; refi at stabilization.
Rent comps 4 comps
| Address | Beds | Baths | Sqft | Rent | $/sqft | DOM | Units | Dist |
|---|---|---|---|---|---|---|---|---|
| 1569 Clayton St San Angelo, TX | 3.0 | 2.0 | 1372 | $1,850 | $1.35 | 44d | 1 | 0.63mi |
| 1320 Orient St San Angelo, TX | 3.0 | 2.0 | 1298 | $1,595 | $1.23 | 20d | 1 | 0.69mi |
| 206 Van Zandt St San Angelo, TX | 3.0 | 2.0 | 2128 | $1,800 | $0.85 | 20d | 1 | 0.73mi |
| 15 N Bell St San Angelo, TX | 3.0 | 1.0 | 1288 | $1,850 | $1.44 | 20d | 1 | 1.05mi |
Listing history 14 events
-
2026-06-19days on market $211,250 Active 19 DOM
-
2026-06-18days on market $211,250 Active 18 DOM
-
2026-06-17days on market $211,250 Active 17 DOM
-
2026-06-16days on market $211,250 Active 16 DOM
-
2026-06-15days on market $211,250 Active 15 DOM
-
2026-06-14days on market $211,250 Active 13 DOM
-
2026-06-13days on market $211,250 Active 12 DOM
-
2026-06-10days on market $211,250 Active 10 DOM
-
2026-06-09days on market $211,250 Active 9 DOM
-
2026-06-08days on market $211,250 Active 8 DOM
-
2026-06-07days on market $211,250 Active 7 DOM
-
2026-06-02days on market $211,250 Active 2 DOM
-
2026-06-01remarks 120-char remark
-
2026-06-01$211,250 Active 1 DOM
ⓘ Source: listings_history table (triggers on properties + properties_extension) + one-shot
backfill from property_details.listing_events for pre-trigger history.
Tax reassessment forecast TX · Resets to sale price
- Current annual tax
- $4,376 · $365/mo
- Projected year-2 tax
- $4,376 · $365/mo
- Expected delta
- $0/yr ($0/mo · 0.0%)
ⓘ Screening estimate from a state-policy table — verify with the county assessor before closing.
Climate risk First Street
- Flood 1/10 Low FEMA zone X (unshaded) · 0% chance over 30 yrs
- Wildfire 4/10 Moderate
- Heat 7/10 Severe 7 d/yr ≥104°F today · 23 d/yr by 30 yrs out
- Wind 4/10 Moderate 15% chance of damaging wind over 30 yrs
- Air quality 1/10 Low 0 unhealthy d/yr today · 0 by 30 yrs out
Nearby sold comps map
Loading sold comps map…
Walkable amenities ~0.75 mi
Loading nearby amenities…
Taxation est. · year 1
- Rental income
- $29,916
- − Mortgage interest
- −$11,833
- − Property taxes
- −$4,376
- − Insurance
- −$1,056
- − Repairs & maintenance
- −$2,393
- − Management
- −$2,393
- − Depreciation
- −$6,145
- Taxable income
- $1,719
- Est. tax owed @ 24.0%
- −$413
- After-tax cash flow
- $4,495/yr
For passive investors: Depreciation is non-cash, so a rental often shows a tax loss while cash-flowing — sheltering income. Rental losses are passive: they offset passive income freely, and up to $25,000/yr can offset ordinary (W-2) income if you actively participate and your MAGI is under $100k (phasing out to $0 by $150k); unused losses carry forward. On sale, claimed depreciation is recaptured at up to 25%, and gains may owe capital-gains tax (a 1031 exchange can defer both). Figures are a year-1 estimate at your 24.0% rate — not tax advice; consult a CPA.
Schools (NCES district)
- District
- San Angelo ISD
- NCES district ID
- 4838700
- Math proficiency
- 27% ▼ -9.00%
- Reading proficiency
- 33% ▼ -3.00%
- Median HH income
- $43,501
- Composite
- 25.56/100
- National rank
- #7427
- State rank
- #627 of 826 in TX
Livability — San Angelo
- Score
- 73/100
- State rank
- #199
- US rank
- #5030
Category grades
Schools grade is shown separately in the Schools card above.
Census & demographics
- Census place
- San Angelo, TX
- County
- Tom Green County · 113,188 people
- City population
- 81,357
- Metro
- San Angelo, TX
- Population (ZIP)
- 29,947
- Household income
- $49,498
- Rent vs Own
- Severe rent burden
- 1255.0
Population outlook (Tom Green County) Hauer SSP2
- Today (2025)
- 135,110 people
- By 2030
- 144,090 · +6.6%
- By 2040
- 162,561 · +20.3%
- By 2050
- 182,158 · +34.8%
- By 2075
- 232,274 · +71.9%
- By 2100
- 268,218 · +98.5%
Race, ethnicity, and origin ACS 2023
- Neighborhood character
- Diverse neighborhood (Simpson 0.56)
- Race & ethnicity
- Hispanic / Latino 56% White 36% Two or more races 26% Black 5%
- Hispanic origin (detail)
- Mexican 49% Puerto Rican 1%
- Common ancestry
- Italian 1% Serbian 1% Slovak 1%
- Foreign-born
- 10% · Canada
- Languages at home
- 66% English-only · Spanish 33%
Political lean MEDSL · Tom Green
- 2024 margin
- Solid R (+48.0) · D 25.5% · R 73.5% · Other 1.0%
- 2008→2024 swing
- -6.3pp toward R · 2008: -41.7pp · 2024: -48.0pp
- All cycles
- 2024: R+48.0 2020: R+44.4 2016: R+47.9 2012: R+47.9 2008: R+41.7
Not yet ingested
- Civics
- —
Market trends
- HPI YoY
- ▼ -164.90%
- Current HPI
- 217.0406
- Rent YoY
- ▲ 8.46%
- Metro
- San Angelo, TX
- State GDP YoY
- ▲ 3.95%
- F500 in state
- 110
Industry mix (Fortune 500 HQ in TX)
| Industry | F500 HQs | Revenue |
|---|---|---|
| Energy | 16 | $1,198B |
|
||
| Technology | 5 | $198B |
|
||
| Engineering / Construction | 4 | $72B |
|
||
| Energy Services | 3 | $60B |
|
||
| Utilities | 3 | $41B |
|
||
| Healthcare | 2 | $330B |
|
||
Price history
+28.0% since first listed3 events — show timeline
- 2026-05-31 Listed $211,250 SAAR TX
- 2012-02-29 Sold (MLS) — SAAR TX
- 2012-02-01 Listed $165,000 SAAR TX
Property tax history
+9.1%/yrLatest (2025): $4,376 · +38.2% YoY. Source: county tax records.
Cash-flow waterfall
monthlySold comps — $/sqft
last 12 mo · ≤1 miLoading sold comps…