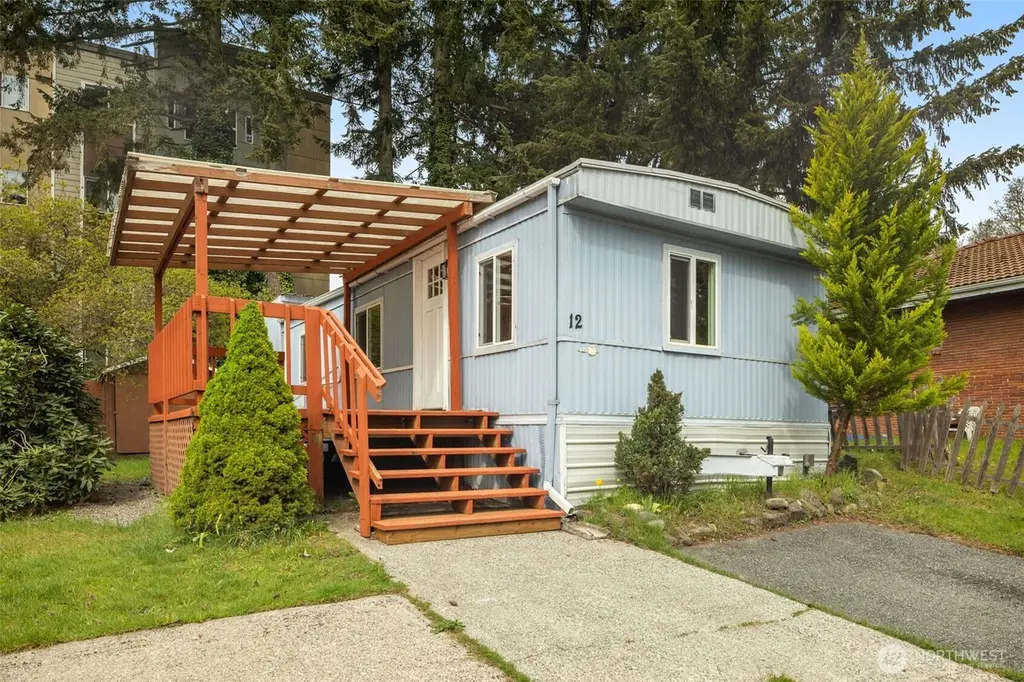
24222 54th Ave W #12 · Mountlake Terrace, WA
Flood risk No data
- FEMA flood zone
- —
- Chance of flooding over 30 yrs
- —
- Est. flood insurance / yr
- —
Fire risk No data
- Est. fire insurance / yr
- —
Heat risk No data
- Hot days now (above threshold)
- —
- Hot days in 30 yrs
- —
Wind risk No data
- Chance of severe wind over 30 yrs
- —
Air-quality risk No data
- Unhealthy air days now
- —
- Unhealthy air days in 30 yrs
- —
Risk factors via First Street. Map © Google.
Why this score? — see what drove the B+ grade
The composite is a weighted blend of 9 inputs, each scored 0–100. Each bar is that input's sub-score; the figure is the points it added to the 100-point composite (weight × sub-score).
- Cash flow +30.0/30.0
- ARV discount +14.4/15.0
- 1% rule +10.0/10.0
- DSCR +10.0/10.0
- Schools +5.4/10.0
- Livability +4.2/5.0
- Condition / age +2.5/5.0
- Rent growth +2.4/5.0
- Appreciation +0.0/10.0
$114,900
🖨 Deal sheet 📄 Offer letter ✓ Due diligence
Listing remarks
Welcome home to easy, well-situated living in this move-in ready gem, nestled in Young's MHP, a 55+ community. This charming 2-bedroom, 1-bath home has been updated throughout - featuring new carpet, fresh interior paint, and updated lighting fixtures that give the space a bright, modern feel. Stay comfortable year-round with forced air heating and an efficient ductless mini-split system providing A/C. Outside, you'll find a covered deck and a convenient storage shed for all your extras, plus an ADA-compliant aluminum wheelchair ramp for easy, accessible entry. One of the standout features of this park is the exceptionally low space rent – under $700 per month – making this an i
Key facts
- 2 parking spots
- Built 1978
- Listed 32 days
Property features AI
Finance
- Other: Buyer to verify school assignments
- Financial info: Listing terms: Cash or Conventional
- HOA & community: Located in Young's Mobile Home Park (about 71 homes); Park approved for sale; Senior community status noted; Pets allowed — see remarks; Land lease: $698
Exterior
- Parking: 2 open/uncovered parking spaces
- Utilities: Electric energy; Public water (City of Mountlake Terrace); Public sewer (City of Mountlake Terrace); Power provided by SnoPUD; Electric water heater
- Home design: Manufactured single-wide home; One story; East-facing
- Construction: Built by Liberty (model 56 / 14 ridgewood); Metal/vinyl construction materials; Aluminum skirting; Torch down roof; Tie-down foundation; Manufactured after June 15, 1976; Mobile home remains in place
- Exterior features: Metal/vinyl exterior; Patio/porch/deck; Double pane windows; Located on a cul-de-sac; Paved access
Interior
- Kitchen: Dishwasher; Refrigerator; Stove/Range
- Bedrooms: 2 bedrooms
- Flooring: Vinyl; Carpet
- Bathrooms: One three-quarter bath (1 shower)
- Heating & cooling: Forced air heating; Has cooling
- Interior features: Water heater; Accessible bathroom; Accessible entrance; Kitchen with eating space; Living room
- Laundry & utility: Washer; Water heater located in utility closet in primary bedroom
Neighborhood map
What this means for you Summary
Snapshot
- This is a 2-bed/1.0-bath manufactured listed at $115k.
Deal economics
- At list price, monthly cash flow is $978 ($12k/yr) — positive.
- The deal already cash-flows at list — no discount required.
- Meets the 1% rule at list price ($2k rent vs $115k).
- Recommended offer: $111k (3.0% below list) — sets the bar for market timing.
- Cap rate 16.5% vs local median 2.1% in Mountlake Terrace — top-decile yield for the area; either an underpriced asset or a hidden risk that comps aren't pricing in. Stress-test before assuming the spread holds.
Location & tenants
- Location reads 85/100 on livability (#28 in WA, #500 nationally) — a professional / high-income tenant draw. Strengths: commute A+, employment A+, housing A+; Watch: cost of living F.
- Edmonds School District (suburban): math 54% / reading 65% proficiency, ranked #53 of 291 in WA (top 18%) — acceptable for families but not a draw, mixed tenant base, ~2y average lease.
- Market conditions: Rents soft (-0.5%/yr); 82 active listings in the ZIP; 19 comparable units currently listed for rent nearby; rentals leasing fast (median 5d on market — plan ~1-2 weeks tenant-placement turnaround); solid renter incomes; 3,982 units permitted in Snohomish County in 2024 (1,492 in 5+ unit buildings).
Forward outlook
- Local home prices are declining (-3.0%/yr); year-one equity from $794 of loan paydown is wiped out by about $3k of value loss. Plan a longer hold.
- Snohomish County population projected at +30% by 2050 — long-run rental-demand tailwind backs the buy-and-hold thesis.
- At projected returns (-3.0% appreciation + 0.0% rent growth), your $32k cash investment doubles in ~4 years — after that, you're playing with house money.
Negotiation context
- It's been on market 32 days — a 3% lower offer ($111k) is reasonable based on typical stale-listing flexibility.
Questions for the listing agent
- It's been on market 32 days. Have you received any prior offers? Is the seller open to a 3% concession, seller financing, or rate buy-down credit?
- Built in 1978 — when were the roof, HVAC, electrical panel, plumbing, and water heater last replaced?
- Is there a deadline driving the sale (1031 exchange, divorce, estate, relocation)? That informs how much negotiation room exists.
- Schools are A-rated — typically a magnet for longer-tenancy family renters. What's the average tenant stay here, and is there a school-zone premium baked into asking?
- What's the average days-on-market for RENTAL listings here right now (not sales)? A rising rental-DOM trend means longer vacancies and softer asking-rent achievability than the comps imply.
- What's the recent tenant-quality profile in this submarket — average credit score on applications, eviction rate, late-payment / NSF rate, and stable-employment percentage? A property-management company in the area should have these aggregated.
- How much new for-sale + rental construction is in the pipeline within 1–3 miles? Heavy new supply typically softens prices + rents 12–24 months out; constrained supply supports both.
Investment metrics
- 1% rule
- 1.83% ✓
- Cap rate
- 16.51%
- Cash-on-cash
- 36.48%
- DSCR
- 2.62
- GRM
- 4.5
CMA / ARV
- ARV (median comp)
- $135,550
- List price
- $114,900
- Delta
- -15.23%
- Verdict
- UNDERPRICED
- Comps
- 3 within 1.0 mi
Show comp detail 2 sales within ~0.75 mi
| Address | Dist | Beds/Ba | Sqft | Sold | Price | $/sf | Match |
|---|---|---|---|---|---|---|---|
| 24222 54th Ave W #26 | 0.00mi | 2/1.0 | 956 (+0%) | 19mo | $75,000 | $78 | 84 |
| 24313 54th Ave W #3 | 0.05mi | 2/2.0 | 886 (-7%) | 6mo | $135,000 | $152 | 77 |
Match score weights: distance 35% · size 25% · config 20% · recency 20%. Top-matched comps best support the ARV.
Projected returns pro-forma
-3.0% appreciation · 0.0% rent growth · sell at horizon
- IRR
- 29.0%
- Equity multiple
- 2.16×
- Total profit
- $37,462
- Equity at exit
- $17,132
- IRR
- 34.7%
- Equity multiple
- 3.76×
- Total profit
- $88,833
- Equity at exit
- $9,934
Cash invested: $32,172 (down + closing). Projections, not guarantees.
Landlord ↔ Tenant lean methodology
- Overall (STATE)
- 28 Tenant-Leaning
- State Washington
- 28 Tenant-Leaning · D+8
- County
- — inherits STATE
- City
- — inherits STATE
ZIP-level market 98043
- Rents YoY
- -0.5%
- Active inventory
- 82
- Price-to-rent
- 4.5×
Monthly cashflow live
- Estimated rent
- $2,106 high interval (Pro) →
- Mortgage (P&I)
- −$603
- Tax from tax record
- −$35 /mo · $425/yr
- Insurance
- −$48
- HOA
- −$0
- Vacancy / Maint / Mgmt
- −$442
- Net cashflow
- $978
Break-even live
UW: 25.0% down · 7.5% · 30yr · 1.5% tax · 5.0% vac · 8.0% maint · 8.0% mgmt
Financing live
Cash to close
- Down payment
- $28,725
- Closing costs
- $3,447
- Reserves months
- —
- Total cash needed
- —
Loan-product check · same deal, 3 products live
Conventional
25% down · 7.5% · 30yr
- Down + closing
- —
- Monthly P&I
- —
- Monthly cashflow
- —
- DSCR
- —
- Eligible?
- —
Personal DTI + credit; lowest rate.
DSCR
20% down · 8.5% · 30yr
- Down + closing
- —
- Monthly P&I
- —
- Monthly cashflow
- —
- DSCR
- —
- Eligible?
- —
No personal income docs; deal must DSCR.
Hard money
10% down · 12.0% · 12mo
- Down + closing
- —
- Monthly P&I
- —
- Monthly cashflow
- —
- DSCR
- —
- Eligible?
- —
Short-term bridge; refi at stabilization.
Rent comps 19 comps
| Address | Beds | Baths | Sqft | Rent | $/sqft | DOM | Units | Dist |
|---|---|---|---|---|---|---|---|---|
| 5407 244th St SW Apt B Mountlake Terrace, WA | 2.0 | 1.5 | 850 | $1,880 | $2.21 | 5d | 1 | 0.04mi |
| 5407 244th St SW Unit C Mountlake Terrace, WA | 2.0 | 1.5 | 850 | $2,200 | $2.59 | 18d | 1 | 0.04mi |
| 1795 NE 205th St Shoreline, WA | 1.0 | 1.0 | 654 | $1,724 | $2.63 | 5d | 3 | 0.19mi |
| 19837 25th Ave NE Unit B Shoreline, WA | 2.0 | 1.0 | 900 | $1,795 | $1.99 | 18d | 1 | 0.35mi |
| 19921 19th Ave NE Shoreline, WA | 1.0 | 1.0 | 650 | $1,599 | $2.46 | 4d | 1 | 0.36mi |
| 20057 Ballinger Way NE Shoreline, WA | 1.0–3.0 | 1.0–2.0 | 950 | $1,963 | $2.07 | 3d | 10 | 0.39mi |
| 24000 Van Ry Blvd Mountlake Terrace, WA | 3.0 | 1.0–2.0 | 1013 | $2,947 | $2.91 | 2d | 32 | 0.49mi |
| 23905 Van Ry Blvd Mountlake Terrace, WA | 1.0–2.0 | 1.0–2.0 | 830 | $2,895 | $3.49 | 2d | 24 | 0.50mi |
| 2609 NE 195th St Lake Forest Park, WA | 1.0 | 1.0 | 634 | $1,558 | $2.46 | 3d | 5 | 0.66mi |
| 23005 60th Ave W Mountlake Terrace, WA | 2.0 | 2.0 | 912 | $2,750 | $3.02 | 22d | 1 | 0.89mi |
| 4208 236th St SW Mountlake Terrace, WA | 1.0–3.0 | 1.0–2.0 | 926 | $2,338 | $2.52 | 2d | 26 | 0.90mi |
| 23335 Cedar Way Unit B-102 Mountlake Terrace, WA | 2.0 | 1.0 | 864 | $2,200 | $2.55 | 43d | 1 | 0.95mi |
| 23111 44th Ave W Mountlake Terrace, WA | 2.0 | 1.0 | 820 | $1,945 | $2.37 | 43d | 1 | 1.01mi |
| 18553 8th Ave NE Shoreline, WA | 3.0 | 1.0–2.0 | 895 | $3,096 | $3.46 | 1d | 1 | 1.16mi |
| 2405 N 202nd Pl Shoreline, WA | 1.0–3.0 | 1.0–2.0 | 938 | $2,270 | $2.42 | 5d | 17 | 1.23mi |
| 22817 Lakeview Dr Mountlake Terrace, WA | 1.0–2.0 | 1.0 | 887 | $2,135 | $2.41 | 2d | 8 | 1.31mi |
| 17712 15th Ave NE Shoreline, WA | 2.0 | 1.0–2.0 | 789 | $3,583 | $4.54 | 1d | 108 | 1.41mi |
| 1549 NE 177th St Shoreline, WA | 1.0 | 1.0 | 615 | $1,550 | $2.52 | 24d | 1 | 1.47mi |
| 17567 15th Ave NE Shoreline, WA | 1.0 | 1.0 | 669 | $2,064 | $3.08 | 2d | 7 | 1.47mi |
Listing history 4 events
-
2026-06-02status $114,900 Pending 32 DOM
-
2026-06-01days on market $114,900 Active 32 DOM
-
2026-05-31days on market $114,900 Active 31 DOM
-
2026-04-30$114,900 Active
ⓘ Source: listings_history table (triggers on properties + properties_extension) + one-shot
backfill from property_details.listing_events for pre-trigger history.
Tax reassessment forecast WA · Resets to sale price
- Current annual tax
- $425 · $35/mo
- Projected year-2 tax
- $1,126 · $94/mo
- Expected delta
- +$701/yr (+$58/mo · 165.1%)
ⓘ Screening estimate from a state-policy table — verify with the county assessor before closing.
Nearby sold comps map
Loading sold comps map…
Walkable amenities ~0.75 mi
Loading nearby amenities…
Taxation est. · year 1
- Rental income
- $25,273
- − Mortgage interest
- −$6,436
- − Property taxes
- −$425
- − Insurance
- −$574
- − Repairs & maintenance
- −$2,022
- − Management
- −$2,022
- − Depreciation
- −$3,343
- Taxable income
- $10,451
- Est. tax owed @ 24.0%
- −$2,508
- After-tax cash flow
- $9,227/yr
For passive investors: Depreciation is non-cash, so a rental often shows a tax loss while cash-flowing — sheltering income. Rental losses are passive: they offset passive income freely, and up to $25,000/yr can offset ordinary (W-2) income if you actively participate and your MAGI is under $100k (phasing out to $0 by $150k); unused losses carry forward. On sale, claimed depreciation is recaptured at up to 25%, and gains may owe capital-gains tax (a 1031 exchange can defer both). Figures are a year-1 estimate at your 24.0% rate — not tax advice; consult a CPA.
Schools (NCES district)
- District
- Edmonds School District
- NCES district ID
- 5302400
- Math proficiency
- 54% ▼ -1.00%
- Reading proficiency
- 65% ▬ 0.00%
- Median HH income
- $67,451
- Composite
- 53.94/100
- National rank
- #3026
- State rank
- #53 of 291 in WA
Livability — Mountlake Terrace
- Score
- 85/100
- State rank
- #28
- US rank
- #500
Category grades
Schools grade is shown separately in the Schools card above.
Census & demographics
- Census place
- Mountlake Terrace, WA
- County
- Snohomish County · 786,756 people
- City population
- 23,101
- Metro
- Seattle-Tacoma-Bellevue, WA
- Population (ZIP)
- 23,101
- Household income
- $107,687
- Rent vs Own
- Severe rent burden
- 724.0
Population outlook (Snohomish County) Hauer SSP2
- Today (2025)
- 899,800 people
- By 2030
- 960,975 · +6.8%
- By 2040
- 1,074,447 · +19.4%
- By 2050
- 1,171,954 · +30.2%
- By 2075
- 1,384,849 · +53.9%
- By 2100
- 1,497,296 · +66.4%
Race, ethnicity, and origin ACS 2023
- Neighborhood character
- Diverse neighborhood (Simpson 0.59)
- Race & ethnicity
- White 61% Hispanic / Latino 17% Two or more races 11% Asian 10% Black 4% Native American 1%
- Hispanic origin (detail)
- Mexican 12%
- Common ancestry
- Portuguese 5% Italian 4% Lithuanian 3%
- Foreign-born
- 18% · Canada, China, South Korea
- Languages at home
- 76% English-only · Spanish 12% Other Asian/Pacific 3% Other Indo-European 2%
Political lean MEDSL · Snohomish
- 2024 margin
- D (+19.0) · D 57.8% · R 38.9% · Other 3.3%
- 2008→2024 swing
- +0.1pp no change · 2008: 18.9pp · 2024: 19.0pp
- All cycles
- 2024: D+19.0 2020: D+20.6 2016: D+16.6 2012: D+16.2 2008: D+18.9
Not yet ingested
- Civics
- —
Market trends
- HPI YoY
- ▼ -907.23%
- Current HPI
- 347.9259
- Rent YoY
- ▼ -0.47%
- Metro
- Seattle-Tacoma-Bellevue, WA
- State GDP YoY
- ▲ 4.65%
- F500 in state
- 22
Industry mix (Fortune 500 HQ in WA)
| Industry | F500 HQs | Revenue |
|---|---|---|
| Retail | 2 | $269B |
|
||
| Technology / Retail | 1 | $638B |
|
||
| Technology | 1 | $245B |
|
||
| Telecommunications | 1 | $38B |
|
||
| Food / Beverage | 1 | $36B |
|
||
| Automotive / Trucks | 1 | $34B |
|
||
Price history
2 events — show timeline
- 2026-06-02 Pending — NWMLS as Distributed by MLS Grid
- 2026-04-30 Listed $114,900 NWMLS as Distributed by MLS Grid
Property tax history
+13.1%/yrLatest (2024): $425 · +33.4% YoY. Source: county tax records.
Cash-flow waterfall
monthlySold comps — $/sqft
last 12 mo · ≤1 miLoading sold comps…