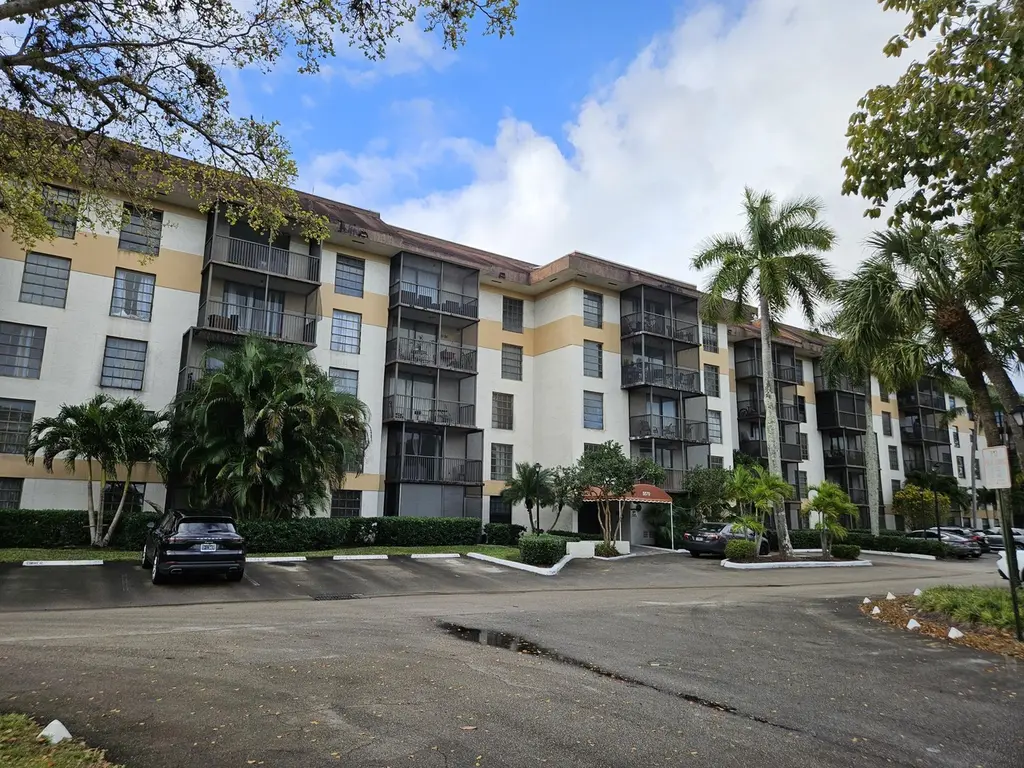
5570 NW 44th St NW Unit 107a · Lauderhill, FL
Flood risk No data
- FEMA flood zone
- —
- Chance of flooding over 30 yrs
- —
- Est. flood insurance / yr
- —
Fire risk No data
- Est. fire insurance / yr
- —
Heat risk No data
- Hot days now (above threshold)
- —
- Hot days in 30 yrs
- —
Wind risk No data
- Chance of severe wind over 30 yrs
- —
Air-quality risk No data
- Unhealthy air days now
- —
- Unhealthy air days in 30 yrs
- —
Risk factors via First Street. Map © Google.
Why this score? — see what drove the D grade
The composite is a weighted blend of 9 inputs, each scored 0–100. Each bar is that input's sub-score; the figure is the points it added to the 100-point composite (weight × sub-score).
- Cash flow +10.6/30.0
- 1% rule +10.0/10.0
- ARV discount +7.5/15.0
- Schools +4.1/10.0
- Livability +4.0/5.0
- DSCR +3.0/10.0
- Condition / age +2.5/5.0
- Rent growth +2.2/5.0
- Appreciation +0.0/10.0
$80,500
🖨 Deal sheet (PDF) 📄 Offer letter ✓ Due diligence
Listing remarks
Spacious 1-bedroom, 1.5 baths condo with a garden view. Unit has a large living/dining area, large bedroom, 1 1/2 baths and a screen balcony. Property has lots of potential and is overall fair condition. Complex has lots of amenities to keep your potential buyer busy. Sold AS IS. BUYER SOLELY RESPONSIBLE TO VERIFY OF ANY ASSESSMENT, HOA FEES, VIOLATIONS ETC.
Key facts
- $675 HOA
- Parking
- Community pool
Property features AI
Finance
- Financial info: HOA fee includes cable TV, insurance, sewer, trash, water, common areas, elevator, roof repairs, and pool service
- HOA & community: Association with amenities: parking, pool, community room; HOA fee paid monthly
Exterior
- Parking: One parking space; Asphalt parking
- Security: Security gate
- Utilities: Public water; Public sewer; Electricity available
- Home design: Condominium; One level; Entry level: 1; Faces north
- Construction: Concrete block with stucco construction; Flat roof; Slab foundation; Five-story building
- Exterior features: No waterfront; Entry foyer
Interior
- Kitchen: Dishwasher; Electric range; Microwave; Refrigerator
- Bedrooms: One main-level bedroom
- Flooring: Laminate flooring; Tile flooring
- Bathrooms: One full bath; One half bath
- Heating & cooling: Central heating; Central air conditioning
- Interior features: Entrance foyer; Unfurnished
- Laundry & utility: Laundry area in bathroom
Neighborhood map
What this means for you Summary
Snapshot
- This is a 1-bed/2.0-bath condo listed at $80k.
Deal economics
- At list price, monthly cash flow is $-40 ($-483/yr) — negative.
- To cash-flow at today's rent, offer at most $73k (8.8% below list).
- Meets the 1% rule at list price ($2k rent vs $80k).
- Recommended offer: $73k (8.8% below list) — sets the bar for cash-flow.
- Cap rate 5.7% vs local median 4.3% in Lauderhill — top-decile yield for the area; either an underpriced asset or a hidden risk that comps aren't pricing in. Stress-test before assuming the spread holds.
Location & tenants
- Location reads 79/100 on livability (#139 in FL, #2,059 nationally) — a middle-class / working-renter tenant base. Strengths: commute A+, cost of living A+, housing A+; Watch: employment D, amenities F.
- Broward (suburban): math 42% / reading 53% proficiency, ranked #46 of 73 in FL (top 63%) — families likely to look elsewhere, expect single-tenant / working-renter base with shorter leases.
- Zoned schools: Park Lakes Elementary School (math 35% / reading 44%, grade F, #1,513 of 2,144 statewide, top 73%, 970 students, 82% FRL); Lauderdale Lakes Middle School (math 21% / reading 26%, grade F, #536 of 571 statewide, top 95%, 816 students, 79% FRL); Piper High School (math 12% / reading 35%, grade F, #533 of 667 statewide, top 80%, 2,310 students, 65% FRL) — zoned schools average 75% FRL vs 51% district-wide (24 pts higher); higher-poverty schools than district average — tighter screening recommended.
- Zoned-school proficiency averages 29% at this address vs 48% district-wide (-19 pts) — the specific schools serving this property underperform the Broward average; the district grade overstates school quality for this exact location.
- Market conditions: Rents soft (-1.4%/yr); 827 active listings in the ZIP; 40 comparable units currently listed for rent nearby; rentals at typical pace (median 21d on market — plan ~3-4 weeks tenant-placement turnaround); 2,111 units permitted in Broward County in 2024 (1,265 in 5+ unit buildings).
- This rent runs 35% of the median local income ($58k/yr) — at the standard rent-burdened threshold; future hikes will face affordability resistance.
Forward outlook
- Local home prices are declining (-3.0%/yr); year-one equity from $557 of loan paydown is wiped out by about $2k of value loss. Plan a longer hold.
- Broward County population projected at +34% by 2050 — long-run rental-demand tailwind backs the buy-and-hold thesis.
Negotiation context
- It's been on market 87 days — a 6% lower offer ($76k) is reasonable based on typical stale-listing flexibility.
Risks & watch-outs
- Watch-outs: property tax is 3.9% of price; HOA is 39% of rent.
Questions for the listing agent
- What do current leases actually rent for vs. the listed asking? Can we see a recent rent roll and the last 12 months of T-12 income?
- It's been on market 87 days. Have you received any prior offers? Is the seller open to a 9% concession, seller financing, or rate buy-down credit?
- Property tax is high relative to price — has the assessment been appealed recently, and will the sale trigger a re-assessment?
- What does the HOA fee cover, when was the last increase, and are there any pending special assessments or reserve-fund shortfalls?
- Any open or pending special assessments — roof, HVAC, plumbing, elevator, façade? What's the per-unit balance and payoff schedule, and is the seller paying it off at close or rolling it to the buyer?
- Why hasn't it sold? Are there any deal-killer items the seller is aware of (foundation, flood, title, zoning, code violations)?
- Is there a deadline driving the sale (1031 exchange, divorce, estate, relocation)? That informs how much negotiation room exists.
- Schools are D-rated, which usually means shorter tenancies and higher turnover. Who's the typical renter profile here, and what's been the actual vacancy rate?
- The area grade is low — what's the realistic commute time and amenity access for the typical tenant pool here? Any planned neighborhood developments (good or bad) we should know about?
- What's the average days-on-market for RENTAL listings here right now (not sales)? A rising rental-DOM trend means longer vacancies and softer asking-rent achievability than the comps imply.
- What's the recent tenant-quality profile in this submarket — average credit score on applications, eviction rate, late-payment / NSF rate, and stable-employment percentage? A property-management company in the area should have these aggregated.
- How much new apartment / multifamily construction is in the pipeline within 1–3 miles? Heavy new supply (>2% of stock underway) typically softens rents 12–24 months out; light construction supports rent growth.
Investment metrics
- 1% rule
- 2.12% ✓
- Cap rate
- 5.69%
- Cash-on-cash
- -2.14%
- DSCR
- 0.90
- GRM
- 3.9
CMA / ARV
No comps found within radius.
Projected returns pro-forma
-3.0% appreciation · 0.0% rent growth · sell at horizon
- IRR
- -28.5%
- Equity multiple
- 0.11×
- Total profit
- $-20,079
- Equity at exit
- $12,003
- IRR
- -99.2%
- Equity multiple
- -0.68×
- Total profit
- $-37,958
- Equity at exit
- $6,960
Cash invested: $22,540 (down + closing). Projections, not guarantees.
Landlord ↔ Tenant lean methodology
- Overall (STATE)
- 87 Strongly Landlord-Friendly
- State Florida
- 87 Strongly Landlord-Friendly · R+3
- County
- — inherits STATE
- City
- — inherits STATE
ZIP-level market 33319
- Rents YoY
- -1.4%
- Active inventory
- 827
- Price-to-rent
- 3.9×
Monthly cashflow live
- Estimated rent
- $1,709 high interval (Pro) →
- Mortgage (P&I)
- −$422
- Tax from tax record
- −$260 /mo · $3,120/yr
- Insurance
- −$34
- HOA
- −$675
- Vacancy / Maint / Mgmt
- −$359
- Net cashflow
- $-40
Break-even live
Sensitivity live
| Price | -10% $5 | -5% $-17 | +0% $-40 | +5% $-63 | +10% $-86 |
|---|---|---|---|---|---|
| Rent | -10% $-175 | -5% $-108 | +0% $-40 | +5% $27 | +10% $95 |
| Rate | -1.0pp $0 | -0.5pp $-20 | base $-40 | +0.5pp $-61 | +1.0pp $-82 |
UW: 25.0% down · 7.5% · 30yr · 1.5% tax · 5.0% vac · 8.0% maint · 8.0% mgmt
Financing live
Cash to close
- Down payment
- $20,125
- Closing costs
- $2,415
- Reserves months
- —
- Total cash needed
- —
Loan-product check · same deal, 3 products live
Conventional
25% down · 7.5% · 30yr
- Down + closing
- —
- Monthly P&I
- —
- Monthly cashflow
- —
- DSCR
- —
- Eligible?
- —
Personal DTI + credit; lowest rate.
DSCR
20% down · 8.5% · 30yr
- Down + closing
- —
- Monthly P&I
- —
- Monthly cashflow
- —
- DSCR
- —
- Eligible?
- —
No personal income docs; deal must DSCR.
Hard money
10% down · 12.0% · 12mo
- Down + closing
- —
- Monthly P&I
- —
- Monthly cashflow
- —
- DSCR
- —
- Eligible?
- —
Short-term bridge; refi at stabilization.
Rent comps 40 comps
| Address | Beds | Baths | Sqft | Rent | $/sqft | DOM | Units | Dist |
|---|---|---|---|---|---|---|---|---|
| 5860 NW 44th St #603 Lauderhill, FL | 2.0 | 2.0 | 1100 | $1,800 | $1.64 | 20d | 1 | 0.06mi |
| 5900 NW 44th St #106 Lauderhill, FL | 2.0 | 2.0 | 1100 | $1,700 | $1.55 | 16d | 1 | 0.12mi |
| 4172 Inverrary Dr #306 Lauderhill, FL | 1.0 | 1.5 | 783 | $1,500 | $1.92 | 12d | 1 | 0.12mi |
| 4176 Inverrary Dr #110 Lauderhill, FL | 2.0 | 2.0 | 972 | $2,000 | $2.06 | 26d | 1 | 0.14mi |
| 4168 Inverrary Dr #408 Lauderhill, FL | 2.0 | 2.0 | 1073 | $1,750 | $1.63 | 26d | 1 | 0.15mi |
| 4166 Inverrary Dr #403 Lauderhill, FL | 2.0 | 2.0 | 972 | $1,750 | $1.80 | 26d | 1 | 0.18mi |
| 4174 Inverrary Dr #903 Lauderhill, FL | 2.0 | 2.0 | 972 | $1,700 | $1.75 | 22d | 1 | 0.18mi |
| 4174 Inverrary Dr #401 Lauderhill, FL | 2.0 | 2.0 | 1116 | $2,100 | $1.88 | 26d | 1 | 0.18mi |
| 4174 Inverrary Dr #1004 Lauderhill, FL | 2.0 | 2.0 | 972 | $1,750 | $1.80 | 26d | 1 | 0.18mi |
| 4174 Inverrary Dr #811 Lauderhill, FL | 1.0 | 1.5 | 783 | $1,550 | $1.98 | 26d | 1 | 0.18mi |
| 4174 Inverrary Dr #303 Lauderhill, FL | 2.0 | 2.0 | 972 | $1,675 | $1.72 | 14d | 1 | 0.18mi |
| 4174 Inverrary Dr #907 Lauderhill, FL | 1.0 | 1.0 | 675 | $1,500 | $2.22 | 26d | 1 | 0.18mi |
| 5530 NW 44th St Lauderhill, FL | 2.0 | 2.0 | 1187 | $2,050 | $1.73 | 26d | 2 | 0.18mi |
| 4156 Inverrary Dr Lauderhill, FL | 1.0–2.0 | 1.5–2.0 | 899 | $1,625 | $1.81 | 1d | 2 | 0.19mi |
| 4156 Inverrary Dr Lauderhill, FL | 2.0 | 2.0 | 993 | $2,200 | $2.22 | 26d | 4 | 0.19mi |
| 4154 Inverrary Dr Lauderhill, FL | 1.0–2.0 | 1.5–2.0 | 877 | $1,250 | $1.42 | 26d | 2 | 0.20mi |
| 4154 Inverrary Dr #206 Lauderhill, FL | 1.0 | 1.5 | 783 | $1,575 | $2.01 | 4d | 1 | 0.20mi |
| 4154 Inverrary Dr #407 Lauderhill, FL | 2.0 | 2.0 | 972 | $1,800 | $1.85 | 12d | 1 | 0.20mi |
| 4158 Inverrary Dr #202 Lauderhill, FL | 2.0 | 2.0 | 1116 | $2,200 | $1.97 | 5d | 1 | 0.21mi |
| 5961 N Falls Circle Dr Lauderhill, FL | 1.0 | 1.5–2.0 | 885 | $1,745 | $1.97 | 5d | 2 | 0.21mi |
| 4152 Inverrary Dr Lauderhill, FL | 2.0 | 2.0 | 1016 | $2,025 | $1.99 | 26d | 2 | 0.22mi |
| 4158 Inverrary Dr Lauderhill, FL | 2.0 | 2.0 | 1044 | $2,100 | $2.01 | 9d | 2 | 0.23mi |
| 4158 Inverrary Dr Lauderhill, FL | 2.0 | 2.0 | 1108 | $2,100 | $1.90 | 19d | 2 | 0.23mi |
| 4164 Inverrary Dr #806 Lauderhill, FL | 1.0 | 1.5 | 783 | $1,600 | $2.04 | 26d | 1 | 0.26mi |
| 4164 Inverrary Dr #102 Lauderhill, FL | 2.0 | 2.0 | 1120 | $2,200 | $1.96 | 17d | 1 | 0.26mi |
| 6010 S Falls Circle Dr #206 Lauderhill, FL | 2.0 | 2.0 | 1093 | $2,350 | $2.15 | 26d | 1 | 0.33mi |
| 6200 NW 44th St #109 Lauderhill, FL | 2.0 | 2.0 | 1092 | $1,850 | $1.69 | 12d | 1 | 0.34mi |
| 6100 NW 44th St #302 Lauderhill, FL | 2.0 | 2.0 | 1092 | $1,800 | $1.65 | 26d | 1 | 0.38mi |
| 3740 Inverrary Dr Lauderhill, FL | 1.0 | 1.5 | 800 | $1,500 | $1.87 | 20d | 3 | 0.40mi |
| 3750 Inverrary Dr Lauderhill, FL | 1.0–2.0 | 1.5–2.0 | 975 | $1,450 | $1.49 | 26d | 3 | 0.41mi |
| 3750 Inverrary Dr Lauderhill, FL | 1.0–2.0 | 1.5–2.0 | 975 | $1,300 | $1.33 | 1d | 3 | 0.41mi |
| 3760 Inverrary Dr Lauderhill, FL | 2.0 | 1.0–2.0 | 800 | $1,725 | $2.16 | 7d | 3 | 0.42mi |
| 3730 Inverrary Dr Unit 1D Lauderhill, FL | 1.0 | 1.5 | 800 | $1,600 | $2.00 | 26d | 1 | 0.42mi |
| 3650 Inverrary Dr Lauderhill, FL | 1.0 | 1.0–1.5 | 610 | $1,570 | $2.57 | 16d | 3 | 0.47mi |
| 3650 Inverrary Dr Lauderhill, FL | 1.0 | 1.5 | 800 | $1,535 | $1.92 | 22d | 2 | 0.47mi |
| 3650 Inverrary Dr Lauderhill, FL | 1.0 | 1.0–1.5 | 610 | $1,570 | $2.57 | 5d | 3 | 0.47mi |
| 6361 N Falls Circle Dr #106 Lauderhill, FL | 1.0 | 2.0 | 870 | $1,540 | $1.77 | 9d | 1 | 0.48mi |
| 6361 N Falls Circle Dr #106 Lauderhill, FL | 1.0 | 2.0 | 870 | $1,550 | $1.78 | 26d | 1 | 0.48mi |
| 3720 Inverrary Dr Lauderhill, FL | 3.0 | 1.0–2.0 | 940 | $1,600 | $1.70 | 12d | 5 | 0.49mi |
| 3710 Inverrary Dr Lauderhill, FL | 1.0 | 1.5 | 900 | $1,674 | $1.86 | 17d | 2 | 0.50mi |
HOA detail condo
- Monthly dues
- $675 · $8,100/yr
- Assessments
- None detected in remarks — confirm with the listing agent.
Listing history 20 events
-
2026-06-21days on market $80,500 Active 87 DOM
-
2026-06-18days on market $80,500 Active 84 DOM
-
2026-06-17days on market $80,500 Active 83 DOM
-
2026-06-16days on market $80,500 Active 82 DOM
-
2026-06-15days on market $80,500 Active 81 DOM
-
2026-06-13days on market $80,500 Active 79 DOM
-
2026-06-09days on market $80,500 Active 75 DOM
-
2026-06-08days on market $80,500 Active 74 DOM
-
2026-06-07days on market $80,500 Active 73 DOM
-
2026-06-04pricedays on market $80,500 Active 70 DOM
-
2026-06-03days on market $84,800 Active 69 DOM
-
2026-06-02days on market $84,800 Active 68 DOM
-
2026-06-01days on market $84,800 Active 67 DOM
-
2026-05-31days on market $84,800 Active 66 DOM
-
2026-04-28price $84,800
-
2026-03-25$89,250 Active
-
2007-03-14soldstatus $105,000
-
2005-01-26soldstatus $83,000
-
2003-07-31soldstatus $57,000
-
1981-02-01soldstatus $45,000
ⓘ Source: listings_history table (triggers on properties + properties_extension) + one-shot
backfill from property_details.listing_events for pre-trigger history.
Tax reassessment forecast FL · Resets to sale price
- Current annual tax
- $3,120 · $260/mo
- Projected year-2 tax
- $3,120 · $260/mo
- Expected delta
- $0/yr ($0/mo · 0.0%)
ⓘ Screening estimate from a state-policy table — verify with the county assessor before closing.
Nearby sold comps map
Loading sold comps map…
Walkable amenities ~0.75 mi
Loading nearby amenities…
Taxation est. · year 1
- Rental income
- $20,513
- − Mortgage interest
- −$4,509
- − Property taxes
- −$3,120
- − Insurance
- −$402
- − Repairs & maintenance
- −$1,641
- − Management
- −$1,641
- − HOA
- −$8,100
- − Depreciation
- −$2,342
- Taxable loss
- −$1,243
- Est. tax savings @ 24.0%
- +$298
- After-tax cash flow
- $-185/yr
For passive investors: Depreciation is non-cash, so a rental often shows a tax loss while cash-flowing — sheltering income. Rental losses are passive: they offset passive income freely, and up to $25,000/yr can offset ordinary (W-2) income if you actively participate and your MAGI is under $100k (phasing out to $0 by $150k); unused losses carry forward. On sale, claimed depreciation is recaptured at up to 25%, and gains may owe capital-gains tax (a 1031 exchange can defer both). Figures are a year-1 estimate at your 24.0% rate — not tax advice; consult a CPA.
Schools (NCES district)
- District
- Broward
- NCES district ID
- 1200180
- Math proficiency
- 42% ▼ -18.00%
- Reading proficiency
- 53% ▼ -5.00%
- Median HH income
- $52,139
- Composite
- 40.88/100
- National rank
- #3621
- State rank
- #46 of 73 in FL
Livability — Lauderhill
- Score
- 79/100
- State rank
- #139
- US rank
- #2059
Category grades
Schools grade is shown separately in the Schools card above.
Census & demographics
- Census place
- Lauderhill, FL
- County
- Broward County · 1,963,430 people
- City population
- 62,807
- Metro
- Miami-Fort Lauderdale-Pompano Beach, FL
- Population (ZIP)
- 54,450
- Household income
- $58,388
- Rent vs Own
- Severe rent burden
- 2809.0
Population outlook (Broward County) Hauer SSP2
- Today (2025)
- 2,207,033 people
- By 2030
- 2,360,704 · +7.0%
- By 2040
- 2,661,208 · +20.6%
- By 2050
- 2,946,698 · +33.5%
- By 2075
- 3,602,273 · +63.2%
- By 2100
- 3,970,984 · +79.9%
Race, ethnicity, and origin ACS 2023
- Neighborhood character
- Diverse neighborhood (Simpson 0.58)
- Race & ethnicity
- Black 61% Hispanic / Latino 17% White 15% Two or more races 11% Asian 4%
- Hispanic origin (detail)
- Puerto Rican 4% Cuban 2% Dominican 1%
- Common ancestry
- Hispanic 13% Romanian 1% Italian 1%
- Foreign-born
- 46% · Canada, Jamaica, Vietnam
- Languages at home
- 64% English-only · Spanish 15% French/Haitian/Cajun 15% Other Indo-European 2%
Political lean MEDSL · Broward
- 2024 margin
- D (+17.0) · D 58.0% · R 41.0%
- 2008→2024 swing
- -17.8pp toward R · 2008: 34.7pp · 2024: 17.0pp
- All cycles
- 2024: D+17.0 2020: D+29.8 2016: D+35.0 2012: D+34.9 2008: D+34.7
Not yet ingested
- Civics
- —
Market trends
- HPI YoY
- ▼ -202.84%
- Current HPI
- 328.4307
- Rent YoY
- ▼ -1.38%
- Metro
- Miami-Fort Lauderdale-Pompano Beach, FL
- State GDP YoY
- ▲ 3.28%
- F500 in state
- 36
Industry mix (Fortune 500 HQ in FL)
| Industry | F500 HQs | Revenue |
|---|---|---|
| Industrial Technology | 2 | $29B |
|
||
| Insurance | 2 | $17B |
|
||
| Retail | 1 | $60B |
|
||
| Technology Distribution | 1 | $58B |
|
||
| Homebuilding | 1 | $35B |
|
||
| Technology Manufacturing | 1 | $35B |
|
||
Price history
+88.4% since first listed6 events — show timeline
- 2026-04-28 Price Changed $84,800 Beaches MLS
- 2026-03-25 Listed $89,250 Beaches MLS
- 2007-03-14 Sold (Public Records) $105,000 Public Records
- 2005-01-26 Sold (Public Records) $83,000 Public Records
- 2003-07-31 Sold (Public Records) $57,000 Public Records
- 1981-02-01 Sold (Public Records) $45,000 Public Records
Property tax history
+14.4%/yrLatest (2025): $3,120 · +3.2% YoY. Source: county tax records.
Cash-flow waterfall
monthlySold comps — $/sqft
last 12 mo · ≤1 miLoading sold comps…