 Triplex
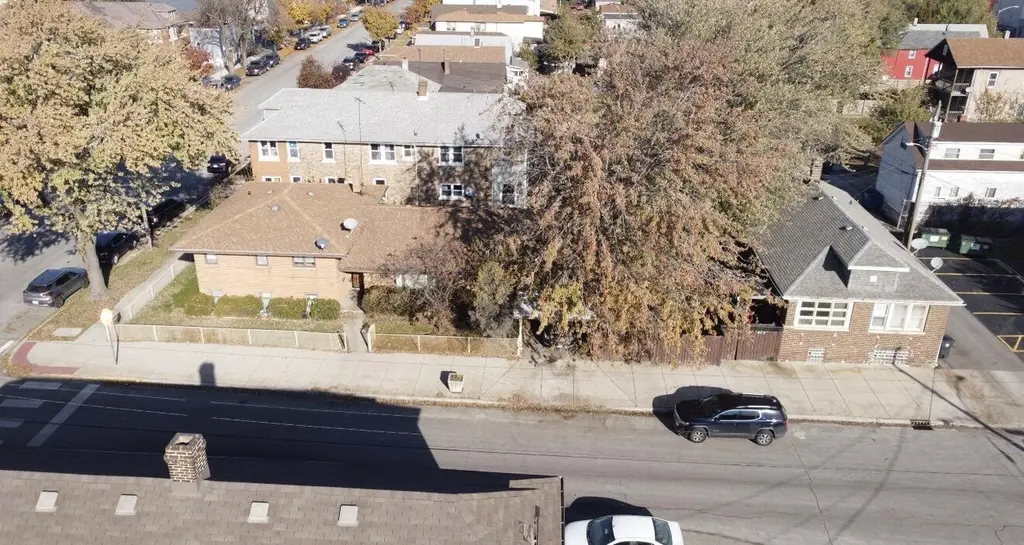
612 W 149th St · East Chicago, IN
Flood risk 1/10 · Minimal
- FEMA flood zone
- X (unshaded)
- Chance of flooding over 30 yrs
- 0.0%
- Est. flood insurance / yr
- $473 – $860
Fire risk 1/10 · Minimal
- Est. fire insurance / yr
- $717 – $1,331
Heat risk 3/10 · Minor
- Hot days now (above 101°F)
- 7 days/yr
- Hot days in 30 yrs
- 15 days/yr
Wind risk 2/10 · Minimal
- Chance of severe wind over 30 yrs
- —
Air-quality risk 4/10 · Minor
- Unhealthy air days now
- 5 days/yr
- Unhealthy air days in 30 yrs
- 6 days/yr
Risk factors via First Street. Map © Google.
Why this score? — see what drove the C grade
The composite is a weighted blend of 9 inputs, each scored 0–100. Each bar is that input's sub-score; the figure is the points it added to the 100-point composite (weight × sub-score).
- Cash flow +20.6/30.0
- ARV discount +7.5/15.0
- DSCR +6.6/10.0
- 1% rule +5.2/10.0
- Appreciation +4.8/10.0
- Rent growth +4.5/5.0
- Livability +3.2/5.0
- Condition / age +2.5/5.0
- Schools +0.8/10.0
$350,000
🖨 Deal sheet 📄 Offer letter ✓ Due diligence
Multi-family units
County records classify this as Multi-Family (2-4 Unit). Listing-text estimate: 3 units. confirmed
Listing remarks MLS
Why settle for one when you can have two? Exceptional opportunity to add a well-performing asset to your investment portfolio or create the perfect setup for a large multi-generational family!! This unique property features two separate brick homes on one parcel, offering an excellent opportunity to expand your investment portfolio or create space for multi-generational living. 614 is a 4 Bed 2.5 Bath 3,148 sq ft Tri-level including a sunroom, Family Room Second Kitchen in Lower Level, 612 is a 3 Bed 3 Bath 2,215 sq ft Bi-level plus a basement unit 3 bedroom with a kitchen and 1 bath. Conveniently located with easy access to Downtown Chicago, this commuter-friendly property offers low taxes and strong income potential. Both units are currently leased, providing immediate cash flow for the next owner.
Key facts
- Basement unit
- Sunroom
- 2 parking spots
Tags
Property features AI
Finance
- Other: 3 total units in the building; Unit 1 (first floor): 4 beds, 3 baths, 5 rooms — Rent $1,600, security deposit $1,600, tenant pays all; Unit 2 (second floor): 3 beds, 3 baths, 4 rooms — Rent $1,400, security deposit $1,400, tenant pays all; Unit 3: 3 beds, 1 bath — Rent $1,000, tenant pays all; Lease terms month-to-month for listed units
- Financial info: Special service area: No; Possession at closing subject to tenants' rights
Exterior
- Parking: 2 parking spaces (total)
- Utilities: Public water; Public sewer
- Home design: Two- to four-unit property; Fee simple ownership; Built more than 90 years ago; Originally built before 1978
- Construction: Brick construction
- Exterior features: Lot less than 0.25 acre; Lot dimensions approximately 0.17
Interior
- Kitchen: Stove; Refrigerator
- Bedrooms: 10 bedrooms total; Building includes 3-bedroom units
- Bathrooms: 4 full bathrooms; 2 half bathrooms
- Heating & cooling: Natural gas heating
- Interior features: Finished partial basement; 10 total rooms
- Laundry & utility: Tenants pay all utilities
Neighborhood map
What this means for you Summary
Snapshot
- This is a 1×3bd/3ba + 1×4bd/2.5ba + 1×3bd/1ba units multifamily listed at $350k.
Deal economics
- At list price, monthly cash flow is $468 ($6k/yr) — positive. Per door: $156/mo.
- The deal already cash-flows at list — no discount required.
- Meets the 1% rule at list price ($4k rent vs $350k).
- Recommended offer: $340k (3.0% below list) — sets the bar for market timing.
Location & tenants
- Location reads 64/100 on livability (#371 in IN) — a middle-class / working-renter tenant base. Strengths: commute A+, cost of living A+, housing A; Watch: health & safety D+, schools F, crime F.
- School City Of East Chicago (suburban): math 7% / reading 15% proficiency, ranked #293 of 301 in IN (top 97%) — low school quality limits family demand, transient renter base, plan for 1-2y turnover; 89% free/reduced lunch — lower-income household profile, screen leases tightly.
- Market conditions: Rents rising fast (+8.1%/yr); 79 active listings in the ZIP; lower-income renter base — watch delinquency; 1,642 units permitted in Lake County in 2024 (14 in 5+ unit buildings).
- At $3,583/mo this rent would consume 102% of the median local household income ($42k/yr) (locally 1227% of renters already pay >50% of income on rent) — very limited rent-growth headroom before tenants either downsize or default.
Forward outlook
- In year one you build about $1k of equity ($2k loan paydown + $-1k appreciation (-0.3% local appreciation)).
- Lake County population projected to shrink 7% by 2050 — rents likely to lag national; underwrite the cash flow, not the appreciation.
- At projected returns (-0.3% appreciation + 8.0% rent growth), your $98k cash investment doubles in ~7 years — after that, you're playing with house money.
Negotiation context
- It's been on market 42 days — a 3% lower offer ($340k) is reasonable based on typical stale-listing flexibility.
- 5 sale attempts since 28y ago with the ask held roughly flat each time — persistent listings suggest the price (not the market) is what's stuck; bring a comps-based counter.
Risks & watch-outs
- Watch-outs: built in 1927 — expect roof / HVAC / electrical / plumbing capex.
Questions for the listing agent
- It's been on market 42 days. Have you received any prior offers? Is the seller open to a 3% concession, seller financing, or rate buy-down credit?
- Can we see the unit-by-unit rent roll, current vacancy, and any below-market leases? What's the average tenancy length?
- What capital expenditures (roof, boiler, parking lot, exteriors) have been made in the last 5 years, and what's planned in the next 2?
- Built in 1927 — when were the roof, HVAC, electrical panel, plumbing, and water heater last replaced?
- Is there a deadline driving the sale (1031 exchange, divorce, estate, relocation)? That informs how much negotiation room exists.
- Schools are F-rated, which usually means shorter tenancies and higher turnover. Who's the typical renter profile here, and what's been the actual vacancy rate?
- Crime grade is F in this area — have there been break-ins, vandalism, or insurance claims at this property in the last 3 years? What carrier currently insures it and at what premium?
- What's the average days-on-market for RENTAL listings here right now (not sales)? A rising rental-DOM trend means longer vacancies and softer asking-rent achievability than the comps imply.
- What's the recent tenant-quality profile in this submarket — average credit score on applications, eviction rate, late-payment / NSF rate, and stable-employment percentage? A property-management company in the area should have these aggregated.
- How much new apartment / multifamily construction is in the pipeline within 1–3 miles? Heavy new supply (>2% of stock underway) typically softens rents 12–24 months out; light construction supports rent growth.
Investment metrics
- 1% rule
- 1.02% ✓
- Cap rate
- 7.90%
- Cash-on-cash
- 5.73%
- DSCR
- 1.26
- GRM
- 8.1
CMA / ARV
- ARV (on-the-fly)
- $93,030
- Comps found
- 1
Show comp detail 1 sale within ~0.75 mi
| Address | Dist | Beds/Ba | Sqft | Sold | Price | $/sf | Match |
|---|---|---|---|---|---|---|---|
| 519 W 144th St | 0.61mi | 3/2.0 | 2,160 (-2%) | 12mo | $90,000 | $42 | 58 |
Match score weights: distance 35% · size 25% · config 20% · recency 20%. Top-matched comps best support the ARV.
Projected returns pro-forma
-0.3% appreciation · 8.0% rent growth · sell at horizon
- IRR
- 7.0%
- Equity multiple
- 1.34×
- Total profit
- $33,569
- Equity at exit
- $96,350
- IRR
- 16.0%
- Equity multiple
- 2.98×
- Total profit
- $194,273
- Equity at exit
- $111,685
Cash invested: $98,000 (down + closing). Projections, not guarantees.
Landlord ↔ Tenant lean methodology
- Overall (STATE)
- 90 Strongly Landlord-Friendly
- State Indiana
- 90 Strongly Landlord-Friendly · R+11
- County
- — inherits STATE
- City
- — inherits STATE
ZIP-level market 46312
- Home prices YoY
- -0.1%
- Rents YoY
- 8.1%
- Active inventory
- 79
- Price-to-rent
- 25.6×
Monthly cashflow live
- Estimated rent
- $3,583 medium interval (Pro) →
- Mortgage (P&I)
- −$1,835
- Tax from tax record
- −$381 /mo · $4,574/yr
- Insurance
- −$146
- HOA
- −$0
- Vacancy / Maint / Mgmt
- −$752
- Net cashflow
- $468
Break-even live
3-unit breakdown (identical units grouped — click to expand)
| Units | Beds | Baths | Est. rent |
|---|---|---|---|
| 1× unit | 3 | 3 | $1,138 |
| 1× unit | 4 | 2.5 | $1,308 |
| 1× unit | 3 | 1 | $1,138 |
| Total (3 units) | $3,583 | ||
UW: 25.0% down · 7.5% · 30yr · 1.5% tax · 5.0% vac · 8.0% maint · 8.0% mgmt
Financing live
Cash to close
- Down payment
- $87,500
- Closing costs
- $10,500
- Reserves months
- —
- Total cash needed
- —
Loan-product check · same deal, 3 products live
Conventional
25% down · 7.5% · 30yr
- Down + closing
- —
- Monthly P&I
- —
- Monthly cashflow
- —
- DSCR
- —
- Eligible?
- —
Personal DTI + credit; lowest rate.
DSCR
20% down · 8.5% · 30yr
- Down + closing
- —
- Monthly P&I
- —
- Monthly cashflow
- —
- DSCR
- —
- Eligible?
- —
No personal income docs; deal must DSCR.
Hard money
10% down · 12.0% · 12mo
- Down + closing
- —
- Monthly P&I
- —
- Monthly cashflow
- —
- DSCR
- —
- Eligible?
- —
Short-term bridge; refi at stabilization.
Listing history 22 events
-
2026-06-18days on market $350,000 Active 42 DOM
-
2026-06-17days on market $350,000 Active 41 DOM
-
2026-06-16days on market $350,000 Active 40 DOM
-
2026-06-15days on market $350,000 Active 39 DOM
-
2026-06-13days on market $350,000 Active 37 DOM
-
2026-06-13days on market $350,000 Active 36 DOM
-
2026-06-09days on market $350,000 Active 33 DOM
-
2026-06-08days on market $350,000 Active 32 DOM
-
2026-06-07days on market $350,000 Active 31 DOM
-
2026-06-04days on market $350,000 Active 28 DOM
-
2026-06-03days on market $350,000 Active 27 DOM
-
2026-06-02days on market $350,000 Active 26 DOM
-
2026-06-01days on market $350,000 Active 25 DOM
-
2026-05-31days on market $350,000 Active 24 DOM
-
2026-05-07$350,000 Active
-
2025-12-18$350,000 Active 812-char remark
Show marketing remark (812 chars)
Why settle for one when you can have two? Exceptional opportunity to add a well-performing asset to your investment portfolio or create the perfect setup for a large multi-generational family!! This unique property features two separate brick homes on one parcel, offering an excellent opportunity to expand your investment portfolio or create space for multi-generational living. 614 is a 4 Bed 2.5 Bath 3,148 sq ft Tri-level including a sunroom, Family Room Second Kitchen in Lower Level, 612 is a 3 Bed 3 Bath 2,215 sq ft Bi-level plus a basement unit 3 bedroom with a kitchen and 1 bath. Conveniently located with easy access to Downtown Chicago, this commuter-friendly property offers low taxes and strong income potential. Both units are currently leased, providing immediate cash flow for the next owner.
-
2024-03-08historical
-
2022-05-11price $1,200
-
2008-12-01$94,900
-
1998-01-24historical
-
1998-01-07$175,000
-
1998-01-07$175,000
ⓘ Source: listings_history table (triggers on properties + properties_extension) + one-shot
backfill from property_details.listing_events for pre-trigger history.
Tax reassessment forecast IN · Partial reset (capped growth)
- Current annual tax
- $4,574 · $381/mo
- Projected year-2 tax
- $4,574 · $381/mo
- Expected delta
- $0/yr ($0/mo · 0.0%)
ⓘ Screening estimate from a state-policy table — verify with the county assessor before closing.
Climate risk First Street
- Flood 1/10 Low FEMA zone X (unshaded) · 0% chance over 30 yrs
- Wildfire 1/10 Low
- Heat 3/10 Moderate 7 d/yr ≥101°F today · 15 d/yr by 30 yrs out
- Wind 2/10 Low
- Air quality 4/10 Moderate 5 unhealthy d/yr today · 6 by 30 yrs out
Nearby sold comps map
Loading sold comps map…
Walkable amenities ~0.75 mi
Loading nearby amenities…
Taxation est. · year 1
- Rental income
- $42,996
- − Mortgage interest
- −$19,605
- − Property taxes
- −$4,574
- − Insurance
- −$1,750
- − Repairs & maintenance
- −$3,440
- − Management
- −$3,440
- − Depreciation
- −$10,182
- Taxable income
- $5
- Est. tax owed @ 24.0%
- −$1
- After-tax cash flow
- $5,616/yr
For passive investors: Depreciation is non-cash, so a rental often shows a tax loss while cash-flowing — sheltering income. Rental losses are passive: they offset passive income freely, and up to $25,000/yr can offset ordinary (W-2) income if you actively participate and your MAGI is under $100k (phasing out to $0 by $150k); unused losses carry forward. On sale, claimed depreciation is recaptured at up to 25%, and gains may owe capital-gains tax (a 1031 exchange can defer both). Figures are a year-1 estimate at your 24.0% rate — not tax advice; consult a CPA.
Schools (NCES district)
- District
- School City Of East Chicago
- NCES district ID
- 1802880
- Math proficiency
- 7% ▼ -10.00%
- Reading proficiency
- 15% ▼ -7.00%
- Median HH income
- $28,423
- Composite
- 8.36/100
- National rank
- #9909
- State rank
- #293 of 301 in IN
Livability — East Chicago
- Score
- 64/100
- State rank
- #371
- US rank
- #13869
Category grades
Schools grade is shown separately in the Schools card above.
Census & demographics
- Census place
- East Chicago, IN
- County
- Lake County · 422,878 people
- City population
- 26,022
- Metro
- Chicago-Naperville-Elgin, IL-IN-WI
- Population (ZIP)
- 26,022
- Household income
- $42,125
- Rent vs Own
- Severe rent burden
- 1227.0
Population outlook (Lake County) Hauer SSP2
- Today (2025)
- 484,026 people
- By 2030
- 478,091 · -1.2%
- By 2040
- 462,974 · -4.3%
- By 2050
- 449,894 · -7.1%
- By 2075
- 436,169 · -9.9%
- By 2100
- 426,607 · -11.9%
Race, ethnicity, and origin ACS 2023
- Neighborhood character
- Majority Hispanic (56%)
- Race & ethnicity
- Hispanic / Latino 56% Black 36% Two or more races 11% White 7%
- Hispanic origin (detail)
- Mexican 45% Puerto Rican 6%
- Common ancestry
- Romanian 2%
- Foreign-born
- 16% · Canada
- Languages at home
- 59% English-only · Spanish 40%
Political lean MEDSL · Lake
- 2024 margin
- Lean D (+5.6) · D 52.1% · R 46.5% · Other 1.5%
- 2008→2024 swing
- -28.6pp toward R · 2008: 34.3pp · 2024: 5.6pp
- All cycles
- 2024: D+5.6 2020: D+15.1 2016: D+20.6 2012: D+31.0 2008: D+34.3
Not yet ingested
- Civics
- —
Market trends
- HPI YoY
- ▼ -0.30%
- Current HPI
- 267.9232
- Rent YoY
- ▲ 8.06%
- Metro
- Chicago-Naperville-Elgin, IL-IN-WI
- State GDP YoY
- ▲ 2.90%
- F500 in state
- 18
Industry mix (Fortune 500 HQ in IN)
| Industry | F500 HQs | Revenue |
|---|---|---|
| Industrial Machinery | 2 | $37B |
|
||
| Healthcare | 1 | $177B |
|
||
| Pharmaceuticals | 1 | $45B |
|
||
| Metals / Steel | 1 | $18B |
|
||
| Agriculture | 1 | $17B |
|
||
| Packaging | 1 | $12B |
|
||
Price history
+100.0% since first listed8 events — show timeline
- 2026-05-07 Listed $350,000 MRED as Distributed by MLS Grid
- 2025-12-18 Listed $350,000 NIRA MLS as Distributed by MLS Grid
- 2024-03-08 Listing Removed — NIRA MLS as Distributed by MLS Grid
- 2022-05-11 Price Changed $1,200 RENT.
- 2008-12-01 Listed $94,900 NIRA MLS as Distributed by MLS Grid
- 1998-01-24 Listing Removed — NIRA MLS as Distributed by MLS Grid
- 1998-01-07 Listed $175,000 NIRA MLS as Distributed by MLS Grid
- 1998-01-07 Listed $175,000 NIRA MLS as Distributed by MLS Grid
Property tax history
+6.2%/yrLatest (2024): $4,574 · +10.5% YoY. Source: county tax records.
Cash-flow waterfall
monthlySold comps — $/sqft
last 12 mo · ≤1 miLoading sold comps…