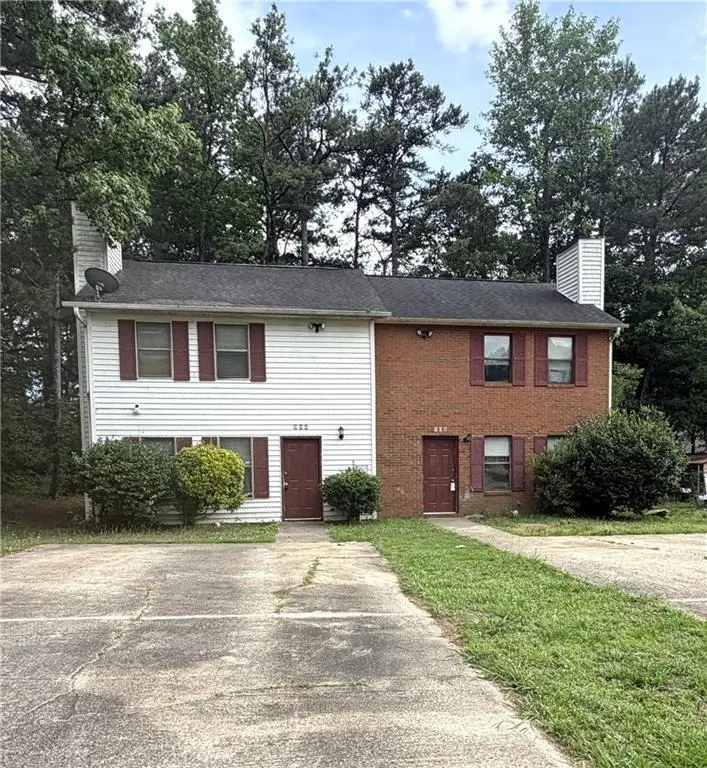
906 Silverwood Dr · Riverdale, GA
Flood risk 1/10 · Minimal
- FEMA flood zone
- X (unshaded)
- Chance of flooding over 30 yrs
- 0.0%
- Est. flood insurance / yr
- $507 – $1,088
Fire risk 1/10 · Minimal
- Est. fire insurance / yr
- $963 – $1,789
Heat risk 6/10 · Moderate
- Hot days now (above 104°F)
- 7 days/yr
- Hot days in 30 yrs
- 18 days/yr
Wind risk 5/10 · Moderate
- Chance of severe wind over 30 yrs
- 26.0%
Air-quality risk 4/10 · Minor
- Unhealthy air days now
- 4 days/yr
- Unhealthy air days in 30 yrs
- 7 days/yr
Risk factors via First Street. Map © Google.
Why this score? — see what drove the D+ grade
The composite is a weighted blend of 9 inputs, each scored 0–100. Each bar is that input's sub-score; the figure is the points it added to the 100-point composite (weight × sub-score).
- Cash flow +16.4/30.0
- Appreciation +10.0/10.0
- DSCR +5.1/10.0
- 1% rule +4.4/10.0
- Livability +3.5/5.0
- ARV discount +2.9/15.0
- Rent growth +2.7/5.0
- Condition / age +2.5/5.0
- Schools +1.3/10.0
$169,900
🖨 Deal sheet 📄 Offer letter ✓ Due diligence
Listing remarks
An incredible opportunity to acquire a complete, side-by-side duplex building in the high-demand rental market of Atlanta/Clayton County. This sale includes BOTH units—906 and 908 Silverwood Drive—offering immediate cash flow and strong long-term yields. Each unit features a highly rentable, two-story layout with a bright living room centered around a cozy fireplace, a formal dining area, and a kitchen on the main floor. Upstairs, the spacious bedrooms provide excellent privacy for tenants. Both units sit on low-maintenance concrete slab foundations with private back patio pads, separate driveways/parking pads, and low-upkeep brick-front accents.
Key facts
- Bright living room
- Private back patio
- Side by side duplex
Tags
Property features AI
Finance
- Financial info: Two units in the community (multi-family)
Exterior
- Parking: Two total parking spaces; Driveway and parking pad; Open parking available
- Utilities: Public water; Public sewer; Electricity available (110 volts)
- Home design: Two levels; Fee simple ownership
- Construction: Brick front with vinyl siding; Composition roof; Slab foundation; Resale condition
- Exterior features: Private yard; Patio
Interior
- Kitchen: Dishwasher; Refrigerator
- Bedrooms: Two bedrooms on the upper level; No special bedroom features listed
- Flooring: Carpet; Laminate; Luxury vinyl
- Bathrooms: Two full bathrooms; One half bathroom (main level)
- Heating & cooling: Central heating; Central air conditioning
- Interior features: One fireplace in the family room; Common wall (attached on one side); Other interior features
- Laundry & utility: No laundry details provided
Neighborhood map
What this means for you Summary
Snapshot
- This is a 3-bed/3.0-bath townhouse listed at $170k.
Deal economics
- At list price, monthly cash flow is $96 ($1k/yr) — positive.
- The deal already cash-flows at list — no discount required.
- To meet the 1% rule (rent ≥ 1% of price), the offer needs to be $160k (5.8% below list).
- Recommended offer: $160k (5.8% below list) — sets the bar for 1% rule.
- Cap rate 7.0% vs local median 5.5% in Riverdale — meaningfully above typical; check what's discounted (condition, days-on-market, listing class) to confirm the premium yield is real.
Location & tenants
- Location reads 70/100 on livability (#100 in GA) — a middle-class / working-renter tenant base. Strengths: cost of living A+, housing A+; Watch: crime D, amenities F, commute F.
- Clayton County (suburban): math 11% / reading 20% proficiency, ranked #155 of 174 in GA (top 89%) — low school quality limits family demand, transient renter base, plan for 1-2y turnover; 78% free/reduced lunch — lower-income household profile, screen leases tightly.
- Zoned schools: West Clayton Elementary School (math 10% / reading 10%, grade F, #1,076 of 1,228 statewide, top 89%, 488 students, 90% FRL); North Clayton Middle School (math 12% / reading 27%, grade F, #356 of 470 statewide, top 78%, 767 students, 90% FRL); North Clayton High School (math 2% / reading 22%, grade F, #336 of 424 statewide, top 80%, 1,206 students, 90% FRL).
- Market conditions: Rents flat; 651 active listings in the ZIP; 40 comparable units currently listed for rent nearby; rentals at typical pace (median 25d on market — plan ~3-4 weeks tenant-placement turnaround); 42% of comp listings sitting > 30 days — soft ceiling on asking rent; 865 units permitted in Clayton County in 2024 (448 in 5+ unit buildings).
Forward outlook
- In year one you build about $18k of equity ($1k loan paydown + $17k appreciation (10.0% local appreciation)).
- Clayton County population projected at +29% by 2050 — long-run rental-demand tailwind backs the buy-and-hold thesis.
- At projected returns (10.0% appreciation + 0.9% rent growth), your $48k cash investment doubles in ~3 years — after that, you're playing with house money.
- By year 3, paydown + projected appreciation supports a ~$46k cash-out refi (75% LTV) — recoverable capital for the next deal without selling this one.
Negotiation context
- Only 9 days on market — expect competitive offers; lowballing is unlikely to land.
- 2 sale attempts with the ask held roughly flat each time — persistent listings suggest the price (not the market) is what's stuck; bring a comps-based counter.
- Current owner paid $49k; list at $170k implies a 247% gain — meaningful room to come down on a strong offer.
Risks & watch-outs
- Climate carrying-cost: moderate wind risk, 26% chance of damaging wind over 30y; extreme-heat days projected 7→18/yr by 2055 (HVAC capex compounding) — expect insurance premiums to compound above CPI over the hold.
Questions for the listing agent
- Is there a deadline driving the sale (1031 exchange, divorce, estate, relocation)? That informs how much negotiation room exists.
- Schools are D-rated, which usually means shorter tenancies and higher turnover. Who's the typical renter profile here, and what's been the actual vacancy rate?
- Crime grade is D in this area — have there been break-ins, vandalism, or insurance claims at this property in the last 3 years? What carrier currently insures it and at what premium?
- The area grade is low — what's the realistic commute time and amenity access for the typical tenant pool here? Any planned neighborhood developments (good or bad) we should know about?
- What's the average days-on-market for RENTAL listings here right now (not sales)? A rising rental-DOM trend means longer vacancies and softer asking-rent achievability than the comps imply.
- What's the recent tenant-quality profile in this submarket — average credit score on applications, eviction rate, late-payment / NSF rate, and stable-employment percentage? A property-management company in the area should have these aggregated.
- How much new for-sale + rental construction is in the pipeline within 1–3 miles? Heavy new supply typically softens prices + rents 12–24 months out; constrained supply supports both.
Investment metrics
- 1% rule
- 0.94% ✗
- Cap rate
- 6.97%
- Cash-on-cash
- 2.43%
- DSCR
- 1.11
- GRM
- 8.9
CMA / ARV
- ARV (on-the-fly)
- $154,000
- Comps found
- 12
Show comp detail 12 sales within ~0.75 mi
| Address | Dist | Beds/Ba | Sqft | Sold | Price | $/sf | Match |
|---|---|---|---|---|---|---|---|
| 5591 Windwood Rd | 0.16mi | 3/2.5 | 1,232 (0%) | 8mo | $52,500 | $43 | 84 |
| 5634 Windwood Rd | 0.06mi | 2/2.5 (-1) | 1,232 (0%) | 12mo | $175,230 | $142 | 80 |
| 979 Hickory Bend Rd | 0.38mi | 3/2.5 | 1,232 (0%) | 2mo | $154,255 | $125 | 79 |
| 941 Windwood Ct | 0.28mi | 3/2.5 | 1,296 (+5%) | 3mo | $195,000 | $150 | 74 |
| 5580 Windwood Rd | 0.18mi | 2/2.5 (-1) | 1,232 (0%) | 15mo | $185,925 | $151 | 72 |
| 758 Boston Cmn | 0.29mi | 3/2.0 | 1,200 (-3%) | 8mo | $165,000 | $138 | 72 |
| 990 Hickory Bend Rd | 0.35mi | 3/2.5 | 1,254 (+2%) | 11mo | $125,000 | $100 | 70 |
| 912 Holden Ln | 0.28mi | 2/2.5 (-1) | 1,232 (0%) | 13mo | $203,000 | $165 | 69 |
| 811 Boston Cmn | 0.23mi | 2/2.0 (-1) | 1,130 (-8%) | 2mo | $125,000 | $111 | 65 |
| 5407 Glen Haven Dr | 0.64mi | 3/2.0 | 1,392 (+13%) | 6mo | $135,000 | $97 | 40 |
| 5405 Glen Haven Dr | 0.64mi | 3/2.0 | 1,392 (+13%) | 6mo | $135,000 | $97 | 39 |
| 1119 Summer Brook Rd | 0.60mi | 3/2.0 | 1,392 (+13%) | 11mo | $135,000 | $97 | 37 |
Match score weights: distance 35% · size 25% · config 20% · recency 20%. Top-matched comps best support the ARV.
Projected returns pro-forma
10.0% appreciation · 0.95% rent growth · sell at horizon
- IRR
- 25.3%
- Equity multiple
- 3.01×
- Total profit
- $95,450
- Equity at exit
- $153,059
- IRR
- 21.8%
- Equity multiple
- 6.68×
- Total profit
- $270,275
- Equity at exit
- $330,078
Cash invested: $47,572 (down + closing). Projections, not guarantees.
Landlord ↔ Tenant lean methodology
- Overall (STATE)
- 90 Strongly Landlord-Friendly
- State Georgia
- 90 Strongly Landlord-Friendly · R+3
- County
- — inherits STATE
- City
- — inherits STATE
ZIP-level market 30349
- Home prices YoY
- 4.6%
- Rents YoY
- 0.9%
- Active inventory
- 651
- Price-to-rent
- 8.9×
Monthly cashflow live
- Estimated rent
- $1,600 high interval (Pro) →
- Mortgage (P&I)
- −$891
- Tax from tax record
- −$206 /mo · $2,468/yr
- Insurance
- −$71
- HOA
- −$0
- Vacancy / Maint / Mgmt
- −$336
- Net cashflow
- $96
Break-even live
UW: 25.0% down · 7.5% · 30yr · 1.5% tax · 5.0% vac · 8.0% maint · 8.0% mgmt
Financing live
Cash to close
- Down payment
- $42,475
- Closing costs
- $5,097
- Reserves months
- —
- Total cash needed
- —
Loan-product check · same deal, 3 products live
Conventional
25% down · 7.5% · 30yr
- Down + closing
- —
- Monthly P&I
- —
- Monthly cashflow
- —
- DSCR
- —
- Eligible?
- —
Personal DTI + credit; lowest rate.
DSCR
20% down · 8.5% · 30yr
- Down + closing
- —
- Monthly P&I
- —
- Monthly cashflow
- —
- DSCR
- —
- Eligible?
- —
No personal income docs; deal must DSCR.
Hard money
10% down · 12.0% · 12mo
- Down + closing
- —
- Monthly P&I
- —
- Monthly cashflow
- —
- DSCR
- —
- Eligible?
- —
Short-term bridge; refi at stabilization.
Rent comps 40 comps
| Address | Beds | Baths | Sqft | Rent | $/sqft | DOM | Units | Dist |
|---|---|---|---|---|---|---|---|---|
| 907 Silverwood Dr #907 Atlanta, GA | 2.0 | 2.5 | 1276 | $1,250 | $0.98 | 20d | 1 | 0.02mi |
| 907 Silverwood Dr #907 Atlanta, GA | 2.0 | 2.5 | 1276 | $1,225 | $0.96 | 43d | 1 | 0.02mi |
| 907 Silverwood Dr Atlanta, GA | 2.0 | 2.5 | 1276 | $1,225 | $0.96 | 20d | 1 | 0.02mi |
| 5614 Windwood Rd Unit 5614 Atlanta, GA | 2.0 | 2.5 | 1232 | $1,295 | $1.05 | 44d | 1 | 0.08mi |
| 945 Silverwood Dr Unit 945 Atlanta, GA | 2.0 | 2.5 | 1232 | $1,275 | $1.03 | 4d | 1 | 0.09mi |
| 5612 Windwood Rd Unit 5614 Atlanta, GA | 2.0 | 2.5 | 1232 | $1,250 | $1.01 | 24d | 1 | 0.09mi |
| 5724 Riverdale Rd Atlanta, GA | 1.0–2.0 | 1.0–2.0 | 1039 | $1,460 | $1.40 | 5d | 1 | 0.17mi |
| 1048 Flat Shoals Rd Atlanta, GA | 1.0–3.0 | 1.0–2.0 | 996 | $1,586 | $1.59 | 2d | 11 | 0.26mi |
| 5569 Pine Gate Dr Atlanta, GA | 3.0 | 2.0 | 1400 | $2,350 | $1.68 | 20d | 1 | 0.27mi |
| 972 Windwood Ct Atlanta, GA | 3.0 | 2.0 | 1224 | $1,671 | $1.37 | 43d | 1 | 0.29mi |
| 1081 Garden Walk Blvd Atlanta, GA | 1.0–2.0 | 1.0–2.0 | 895 | $1,502 | $1.68 | 2d | 35 | 0.31mi |
| 5543 Pine Gate Dr Atlanta, GA | 3.0 | 2.0 | 1352 | $1,615 | $1.19 | 43d | 1 | 0.32mi |
| 5543 Pine Gate Dr Atlanta, GA | 3.0 | 2.0 | 1352 | $1,895 | $1.40 | 12d | 1 | 0.32mi |
| 852 Garden Walk Blvd Atlanta, GA | 1.0–2.0 | 1.0–2.0 | 835 | $1,489 | $1.78 | 43d | 9 | 0.37mi |
| 934 Garden Walk Blvd Atlanta, GA | 1.0–2.0 | 1.0–2.0 | 875 | $1,610 | $1.84 | 2d | 12 | 0.45mi |
| 746 Garden Walk Blvd Atlanta, GA | 1.0–2.0 | 1.0–2.0 | 852 | $1,525 | $1.79 | 2d | 9 | 0.46mi |
| 1110 Garden Walk Blvd Atlanta, GA | 1.0–3.0 | 1.0–2.0 | 1016 | $1,720 | $1.69 | 2d | 22 | 0.49mi |
| 639 Garden Walk Blvd Atlanta, GA | 1.0–2.0 | 1.0–2.0 | 852 | $1,500 | $1.76 | 5d | 8 | 0.49mi |
| 5589 Glen Haven Dr Atlanta, GA | 4.0 | 2.0 | 1400 | $1,725 | $1.23 | 43d | 1 | 0.51mi |
| 1086 Summer Brook Rd Atlanta, GA | 3.0 | 2.0 | 1400 | $1,600 | $1.14 | 43d | 1 | 0.52mi |
| 5475 Glen Haven Dr Atlanta, GA | 2.0 | 2.0 | 1208 | $2,900 | $2.40 | 43d | 1 | 0.53mi |
| 1121 Brookstone Rd Atlanta, GA | 3.0 | 2.0 | 1200 | $1,700 | $1.42 | 43d | 1 | 0.56mi |
| 5415 Glen Haven Dr Atlanta, GA | 3.0 | 2.0 | 1197 | $1,580 | $1.32 | 24d | 1 | 0.62mi |
| 1136 Summer Brook Rd Atlanta, GA | 3.0 | 2.0 | 1416 | $1,599 | $1.13 | 4d | 1 | 0.63mi |
| 5405 Glen Haven Dr Unit Labs Atlanta, GA | 4.0 | 2.0 | 1392 | $2,700 | $1.94 | 43d | 1 | 0.64mi |
| 5890 Riverdale Rd Atlanta, GA | 2.0 | 2.0 | 990 | $1,269 | $1.28 | 24d | 1 | 0.64mi |
| 5890 Riverdale Rd Atlanta, GA | 2.0 | 2.0 | 990 | $1,269 | $1.28 | 44d | 1 | 0.64mi |
| 5890 Riverdale Rd Atlanta, GA | 3.0 | 2.0 | 1121 | $1,559 | $1.39 | 43d | 1 | 0.64mi |
| 6030 Riverdale Rd Atlanta, GA | 1.0–3.0 | 1.0–2.0 | 1043 | $1,895 | $1.82 | 43d | 21 | 0.68mi |
| 6030 Riverdale Rd Riverdale, GA | 2.0 | 2.0 | 1137 | $1,725 | $1.52 | 43d | 1 | 0.72mi |
| 5751 Riverdale Rd Atlanta, GA | 2.0 | 1.5 | 1110 | $1,450 | $1.31 | 24d | 3 | 0.72mi |
| 6114 Riverdale Rd Atlanta, GA | 2.0 | 2.0 | 1113 | $1,735 | $1.56 | 43d | 1 | 0.78mi |
| 5689 Isleworth Way Atlanta, GA | 3.0 | 2.0 | 1248 | $1,800 | $1.44 | 15d | 1 | 0.82mi |
| 563 Briar Hill Ct Riverdale, GA | 1.0–2.0 | 1.0–2.0 | 1132 | $1,350 | $1.19 | 18d | 9 | 0.83mi |
| 471 Eagles Crossing Cir Riverdale, GA | 3.0 | 2.5 | 1481 | $1,700 | $1.15 | 43d | 1 | 0.83mi |
| 828 Overlook Ter Atlanta, GA | 3.0 | 2.5 | 1270 | $1,495 | $1.18 | 3d | 1 | 0.84mi |
| 465 Eagles Crossing Cir Riverdale, GA | 3.0 | 2.0 | 1315 | $1,500 | $1.14 | 43d | 1 | 0.84mi |
| 5420 Riverdale Rd Atlanta, GA | 2.0 | 1.0–2.0 | 1075 | $1,225 | $1.14 | 5d | 1 | 0.85mi |
| 5922 Heatherwood Ln Riverdale, GA | 3.0 | 2.0 | 1026 | $1,535 | $1.50 | 24d | 1 | 0.85mi |
| 5801 Riverdale Rd Atlanta, GA | 2.0 | 1.5 | 1150 | $1,275 | $1.11 | 5d | 1 | 0.87mi |
Listing history 7 events
-
2026-06-18days on market $169,900 Active 9 DOM
-
2026-06-17days on market $169,900 Active 8 DOM
-
2026-06-16days on market $169,900 Active 7 DOM
-
2026-06-15days on market $169,900 Active 6 DOM
-
2026-06-13days on market $169,900 Active 4 DOM
-
2026-06-10remarks 654-char remark
-
2026-06-10$169,900 Active 1 DOM
ⓘ Source: listings_history table (triggers on properties + properties_extension) + one-shot
backfill from property_details.listing_events for pre-trigger history.
Tax reassessment forecast GA · Resets to sale price
- Current annual tax
- $2,468 · $206/mo
- Projected year-2 tax
- $2,468 · $206/mo
- Expected delta
- $0/yr ($0/mo · 0.0%)
ⓘ Screening estimate from a state-policy table — verify with the county assessor before closing.
Climate risk First Street
- Flood 1/10 Low FEMA zone X (unshaded) · 0% chance over 30 yrs
- Wildfire 1/10 Low
- Heat 6/10 Major 7 d/yr ≥104°F today · 18 d/yr by 30 yrs out
- Wind 5/10 Major 26% chance of damaging wind over 30 yrs
- Air quality 4/10 Moderate 4 unhealthy d/yr today · 7 by 30 yrs out
Nearby sold comps map
Loading sold comps map…
Walkable amenities ~0.75 mi
Loading nearby amenities…
Taxation est. · year 1
- Rental income
- $19,195
- − Mortgage interest
- −$9,517
- − Property taxes
- −$2,468
- − Insurance
- −$850
- − Repairs & maintenance
- −$1,536
- − Management
- −$1,536
- − Depreciation
- −$4,943
- Taxable loss
- −$1,653
- Est. tax savings @ 24.0%
- +$397
- After-tax cash flow
- $1,552/yr
For passive investors: Depreciation is non-cash, so a rental often shows a tax loss while cash-flowing — sheltering income. Rental losses are passive: they offset passive income freely, and up to $25,000/yr can offset ordinary (W-2) income if you actively participate and your MAGI is under $100k (phasing out to $0 by $150k); unused losses carry forward. On sale, claimed depreciation is recaptured at up to 25%, and gains may owe capital-gains tax (a 1031 exchange can defer both). Figures are a year-1 estimate at your 24.0% rate — not tax advice; consult a CPA.
Schools (NCES district)
- District
- Clayton County
- NCES district ID
- 1301230
- Math proficiency
- 11% ▼ -13.00%
- Reading proficiency
- 20% ▼ -9.00%
- Median HH income
- $42,266
- Composite
- 13.41/100
- National rank
- #9527
- State rank
- #155 of 174 in GA
Livability — Riverdale
- Score
- 70/100
- State rank
- #100
- US rank
- #7907
Category grades
Schools grade is shown separately in the Schools card above.
Census & demographics
- County
- Fulton County · 1,094,430 people
- City population
- 127,674
- Metro
- Atlanta-Sandy Springs-Alpharetta, GA
- Population (ZIP)
- 79,872
- Household income
- $67,023
- Rent vs Own
- Severe rent burden
- 4258.0
Population outlook (Clayton County) Hauer SSP2
- Today (2025)
- 310,777 people
- By 2030
- 329,762 · +6.1%
- By 2040
- 368,052 · +18.4%
- By 2050
- 401,196 · +29.1%
- By 2075
- 472,488 · +52.0%
- By 2100
- 500,446 · +61.0%
Race, ethnicity, and origin ACS 2023
- Neighborhood character
- Predominantly Black (89%)
- Race & ethnicity
- Black 89% Hispanic / Latino 5% Two or more races 4% White 3%
- Foreign-born
- 9% · Canada
- Languages at home
- 88% English-only · Spanish 6% French/Haitian/Cajun 1%
Political lean MEDSL · Clayton
- 2024 margin
- Solid D (+69.2) · D 84.3% · R 15.1%
- 2008→2024 swing
- +2.8pp toward D · 2008: 66.4pp · 2024: 69.2pp
- All cycles
- 2024: D+69.2 2020: D+70.9 2016: D+71.9 2012: D+70.1 2008: D+66.4
Not yet ingested
- Civics
- —
Market trends
- HPI YoY
- ▲ 18.01%
- Current HPI
- 407.99
- Rent YoY
- ▲ 0.95%
- Metro
- Atlanta-Sandy Springs-Alpharetta, GA
- State GDP YoY
- ▲ 2.66%
- F500 in state
- 28
Industry mix (Fortune 500 HQ in GA)
| Industry | F500 HQs | Revenue |
|---|---|---|
| Paper / Packaging | 2 | $29B |
|
||
| Retail | 1 | $160B |
|
||
| Transportation / Logistics | 1 | $91B |
|
||
| Airlines | 1 | $62B |
|
||
| Consumer Goods | 1 | $47B |
|
||
| Utilities | 1 | $25B |
|
||
Price history
+70.1% since first listed8 events — show timeline
- 2026-06-07 Listed $169,900 FMLS
- 2026-02-28 Listing Removed — GAMLS
- 2025-10-31 Listed $190,000 GAMLS
- 2017-12-13 Sold (Public Records) $48,900 Public Records
- 1995-07-05 Sold (Public Records) $78,000 Public Records
- 1991-03-27 Sold (Public Records) $54,000 Public Records
- 1990-12-11 Sold (Public Records) $75,000 Public Records
- 1985-06-28 Sold (Public Records) $99,900 Public Records
Property tax history
+5.5%/yrLatest (2025): $2,468 · +8.5% YoY. Source: county tax records.
Cash-flow waterfall
monthlySold comps — $/sqft
last 12 mo · ≤1 miLoading sold comps…