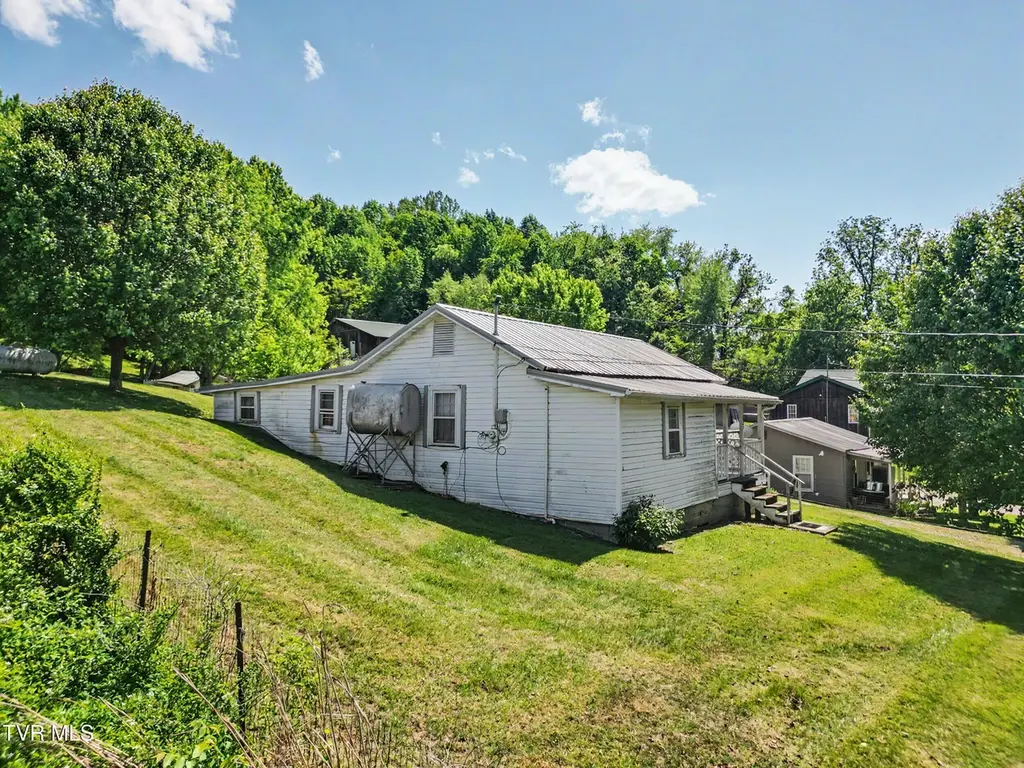
1825 Old Asheville Hwy · Greeneville, TN
Flood risk 1/10 · Minimal
- FEMA flood zone
- X (unshaded)
- Chance of flooding over 30 yrs
- 0.0%
- Est. flood insurance / yr
- $473 – $860
Fire risk 4/10 · Minor
- Est. fire insurance / yr
- $949 – $1,763
Heat risk 4/10 · Minor
- Hot days now (above 101°F)
- 7 days/yr
- Hot days in 30 yrs
- 20 days/yr
Wind risk 2/10 · Minimal
- Chance of severe wind over 30 yrs
- —
Air-quality risk 3/10 · Minor
- Unhealthy air days now
- 2 days/yr
- Unhealthy air days in 30 yrs
- 3 days/yr
Risk factors via First Street. Map © Google.
Why this score? — see what drove the C+ grade
The composite is a weighted blend of 9 inputs, each scored 0–100. Each bar is that input's sub-score; the figure is the points it added to the 100-point composite (weight × sub-score).
- Cash flow +27.5/30.0
- DSCR +9.6/10.0
- ARV discount +7.5/15.0
- 1% rule +6.3/10.0
- Livability +3.3/5.0
- Rent growth +2.5/5.0
- Condition / age +2.5/5.0
- Schools +2.1/10.0
- Appreciation +0.0/10.0
$105,000
🖨 Deal sheet 📄 Offer letter ✓ Due diligence
Listing remarks
MOTIVATED SELLER!!!! Investor opportunity just outside the city limits with no city taxes! Conveniently located in southern Greene County, this approximately 0.6 ± acre property offers beautiful country scenery and approximately 100 feet of road frontage along Old Asheville Highway. The home features 2 bedrooms with potential for a 3rd bedroom and 1 bathroom. Ideal opportunity for investors, renovators, or buyers looking for a fixer-upper with plenty of potential. County taxes are currently under $400 annually. Convenient location with easy access to Greeneville while still enjoying a peaceful country setting. Buyer and buyer's agent to verify all information. Property is being sold
Key facts
- Road frontage
- Convenient location
- 0.6 acre lot
Tags
Property features AI
Finance
- Other: Zoning: A-1
Exterior
- Utilities: Electricity connected; Water connected; Septic tank
- Home design: Single-family house; One story; Fixer condition; Rolling slope lot
- Construction: Vinyl siding; Block foundation; Metal roof; Built as a house (single family residence)
- Exterior features: Front porch; Back yard fencing; Shed(s)
Interior
- Kitchen: Range; Refrigerator
- Bedrooms: 5 total rooms (includes bedrooms and living spaces)
- Flooring: Laminate flooring
- Bathrooms: 1 full bathroom
- Heating & cooling: Propane heating; Window air conditioning unit(s)
- Interior features: Range; Refrigerator
Neighborhood map
What this means for you Summary
Snapshot
- This is a 2-bed/1.0-bath single-family listed at $105k.
Deal economics
- At list price, monthly cash flow is $310 ($4k/yr) — positive.
- The deal already cash-flows at list — no discount required.
- Meets the 1% rule at list price ($1k rent vs $105k).
- Recommended offer: $102k (3.0% below list) — sets the bar for market timing.
- Cap rate 9.8% vs local median 2.7% in Greeneville — top-decile yield for the area; either an underpriced asset or a hidden risk that comps aren't pricing in. Stress-test before assuming the spread holds.
Location & tenants
- Location reads 66/100 on livability (#125 in TN) — a middle-class / working-renter tenant base. Strengths: cost of living A+, housing A+, health & safety A+; Watch: amenities F, commute F, employment F.
- Greene County (rural): math 27% / reading 24% proficiency, ranked #83 of 139 in TN (top 60%) — low school quality limits family demand, transient renter base, plan for 1-2y turnover.
- Zoned schools: Camp Creek Elementary (math 27% / reading 22%, grade F, #546 of 952 statewide, top 61%, 318 students, 0% FRL); South Greene High School (math 27% / reading 37%, grade F, #56 of 332 statewide, top 20%, 523 students, 0% FRL) — zoned schools average 0% FRL vs 58% district-wide (58 pts lower); this property's tenant base skews higher-income than the district average.
- Market conditions: 252 active listings in the ZIP; 333 units permitted in Greene County in 2024 (72 in 5+ unit buildings).
Forward outlook
- Local home prices are declining (-3.0%/yr); year-one equity from $726 of loan paydown is wiped out by about $3k of value loss. Plan a longer hold.
- Greene County population projected to shrink 8% by 2050 — rents likely to lag national; underwrite the cash flow, not the appreciation.
- At projected returns (-3.0% appreciation + 3.0% rent growth), your $29k cash investment doubles in ~9 years — after that, you're playing with house money.
Negotiation context
- It's been on market 39 days — a 3% lower offer ($102k) is reasonable based on typical stale-listing flexibility.
Risks & watch-outs
- Watch-outs: built in 1938 — expect roof / HVAC / electrical / plumbing capex.
Questions for the listing agent
- It's been on market 39 days. Have you received any prior offers? Is the seller open to a 3% concession, seller financing, or rate buy-down credit?
- Built in 1938 — when were the roof, HVAC, electrical panel, plumbing, and water heater last replaced?
- Is there a deadline driving the sale (1031 exchange, divorce, estate, relocation)? That informs how much negotiation room exists.
- Schools are D-rated, which usually means shorter tenancies and higher turnover. Who's the typical renter profile here, and what's been the actual vacancy rate?
- What's the average days-on-market for RENTAL listings here right now (not sales)? A rising rental-DOM trend means longer vacancies and softer asking-rent achievability than the comps imply.
- What's the recent tenant-quality profile in this submarket — average credit score on applications, eviction rate, late-payment / NSF rate, and stable-employment percentage? A property-management company in the area should have these aggregated.
- How much new for-sale + rental construction is in the pipeline within 1–3 miles? Heavy new supply typically softens prices + rents 12–24 months out; constrained supply supports both.
Investment metrics
- 1% rule
- 1.13% ✓
- Cap rate
- 9.84%
- Cash-on-cash
- 12.67%
- DSCR
- 1.56
- GRM
- 7.4
CMA / ARV
No comps found within radius.
Projected returns pro-forma
-3.0% appreciation · 3.0% rent growth · sell at horizon
- IRR
- 2.4%
- Equity multiple
- 1.09×
- Total profit
- $2,717
- Equity at exit
- $15,656
- IRR
- 12.0%
- Equity multiple
- 1.94×
- Total profit
- $27,653
- Equity at exit
- $9,078
Cash invested: $29,400 (down + closing). Projections, not guarantees.
Landlord ↔ Tenant lean methodology
- Overall (STATE)
- 87 Strongly Landlord-Friendly
- State Tennessee
- 87 Strongly Landlord-Friendly · R+13
- County
- — inherits STATE
- City
- — inherits STATE
ZIP-level market 37743
- Home prices YoY
- -8.5%
- Active inventory
- 252
- Price-to-rent
- 7.4×
Monthly cashflow live
- Estimated rent
- $1,185 medium interval (Pro) →
- Mortgage (P&I)
- −$551
- Tax from tax record
- −$32 /mo · $379/yr
- Insurance
- −$44
- HOA
- −$0
- Vacancy / Maint / Mgmt
- −$249
- Net cashflow
- $310
Break-even live
UW: 25.0% down · 7.5% · 30yr · 1.5% tax · 5.0% vac · 8.0% maint · 8.0% mgmt
Financing live
Cash to close
- Down payment
- $26,250
- Closing costs
- $3,150
- Reserves months
- —
- Total cash needed
- —
Loan-product check · same deal, 3 products live
Conventional
25% down · 7.5% · 30yr
- Down + closing
- —
- Monthly P&I
- —
- Monthly cashflow
- —
- DSCR
- —
- Eligible?
- —
Personal DTI + credit; lowest rate.
DSCR
20% down · 8.5% · 30yr
- Down + closing
- —
- Monthly P&I
- —
- Monthly cashflow
- —
- DSCR
- —
- Eligible?
- —
No personal income docs; deal must DSCR.
Hard money
10% down · 12.0% · 12mo
- Down + closing
- —
- Monthly P&I
- —
- Monthly cashflow
- —
- DSCR
- —
- Eligible?
- —
Short-term bridge; refi at stabilization.
Listing history 17 events
-
2026-06-19days on market $105,000 Active 39 DOM
-
2026-06-18days on market $105,000 Active 38 DOM
-
2026-06-17days on market $105,000 Active 37 DOM
-
2026-06-16days on market $105,000 Active 36 DOM
-
2026-06-15days on market $105,000 Active 35 DOM
-
2026-06-14days on market $105,000 Active 33 DOM
-
2026-06-12days on market $105,000 Active 32 DOM
-
2026-06-09days on market $105,000 Active 29 DOM
-
2026-06-08remarks 692-char remark
-
2026-06-08days on market $105,000 Active 28 DOM
-
2026-06-07days on market $105,000 Active 27 DOM
-
2026-06-05days on market $105,000 Active 24 DOM
-
2026-06-02pricedays on market $105,000 Active 22 DOM
-
2026-06-01days on market $115,000 Active 21 DOM
-
2026-05-31days on market $115,000 Active 20 DOM
-
2026-05-30days on market $115,000 Active 19 DOM
-
2026-05-11$115,000 Active
ⓘ Source: listings_history table (triggers on properties + properties_extension) + one-shot
backfill from property_details.listing_events for pre-trigger history.
Tax reassessment forecast TN · Resets to sale price
- Current annual tax
- $379 · $32/mo
- Projected year-2 tax
- $746 · $62/mo
- Expected delta
- +$366/yr (+$31/mo · 96.7%)
ⓘ Screening estimate from a state-policy table — verify with the county assessor before closing.
Climate risk First Street
- Flood 1/10 Low FEMA zone X (unshaded) · 0% chance over 30 yrs
- Wildfire 4/10 Moderate
- Heat 4/10 Moderate 7 d/yr ≥101°F today · 20 d/yr by 30 yrs out
- Wind 2/10 Low
- Air quality 3/10 Moderate 2 unhealthy d/yr today · 3 by 30 yrs out
Nearby sold comps map
Loading sold comps map…
Walkable amenities ~0.75 mi
Loading nearby amenities…
Taxation est. · year 1
- Rental income
- $14,225
- − Mortgage interest
- −$5,882
- − Property taxes
- −$379
- − Insurance
- −$525
- − Repairs & maintenance
- −$1,138
- − Management
- −$1,138
- − Depreciation
- −$3,055
- Taxable income
- $2,108
- Est. tax owed @ 24.0%
- −$506
- After-tax cash flow
- $3,220/yr
For passive investors: Depreciation is non-cash, so a rental often shows a tax loss while cash-flowing — sheltering income. Rental losses are passive: they offset passive income freely, and up to $25,000/yr can offset ordinary (W-2) income if you actively participate and your MAGI is under $100k (phasing out to $0 by $150k); unused losses carry forward. On sale, claimed depreciation is recaptured at up to 25%, and gains may owe capital-gains tax (a 1031 exchange can defer both). Figures are a year-1 estimate at your 24.0% rate — not tax advice; consult a CPA.
Schools (NCES district)
- District
- Greene County
- NCES district ID
- 4701470
- Math proficiency
- 27% ▼ -14.00%
- Reading proficiency
- 24% ▼ -7.00%
- Median HH income
- $37,517
- Composite
- 21.3/100
- National rank
- #8388
- State rank
- #83 of 139 in TN
Livability — Greeneville
- Score
- 66/100
- State rank
- #125
- US rank
- #11825
Category grades
Schools grade is shown separately in the Schools card above.
Census & demographics
- County
- Greene County · 45,638 people
- City population
- 45,638
- Metro
- Greeneville, TN
- Population (ZIP)
- 24,548
- Household income
- $54,566
- Rent vs Own
- Severe rent burden
- 390.0
Population outlook (Greene County) Hauer SSP2
- Today (2025)
- 68,624 people
- By 2030
- 68,114 · -0.7%
- By 2040
- 66,167 · -3.6%
- By 2050
- 63,038 · -8.1%
- By 2075
- 55,274 · -19.5%
- By 2100
- 45,527 · -33.7%
Race, ethnicity, and origin ACS 2023
- Neighborhood character
- Predominantly White (91%)
- Race & ethnicity
- White 91% Two or more races 5% Hispanic / Latino 2% Black 2%
- Common ancestry
- Serbian 3% Italian 2% Romanian 2%
- Foreign-born
- 2% · Canada
- Languages at home
- 97% English-only · Spanish 2%
Political lean MEDSL · Greene
- 2024 margin
- Solid R (+65.7) · D 16.6% · R 82.3% · Other 1.2%
- 2008→2024 swing
- -25.0pp toward R · 2008: -40.7pp · 2024: -65.7pp
- All cycles
- 2024: R+65.7 2020: R+60.7 2016: R+61.0 2012: R+46.0 2008: R+40.7
Not yet ingested
- Civics
- —
Market trends
- HPI YoY
- ▼ -28.08%
- Current HPI
- 303.4589
- Rent YoY
- —
- Metro
- Greeneville, TN
- State GDP YoY
- ▲ 2.78%
- F500 in state
- 22
Industry mix (Fortune 500 HQ in TN)
| Industry | F500 HQs | Revenue |
|---|---|---|
| Healthcare | 3 | $91B |
|
||
| Retail | 3 | $72B |
|
||
| Transportation / Logistics | 1 | $88B |
|
||
| Paper / Packaging | 1 | $19B |
|
||
| Insurance | 1 | $13B |
|
||
| Energy | 1 | $12B |
|
||
Price history
1 event — show timeline
- 2026-05-11 Listed $115,000 TVRMLS
Property tax history
+3.6%/yrLatest (2025): $379 · +0.0% YoY. Source: county tax records.
Cash-flow waterfall
monthlySold comps — $/sqft
last 12 mo · ≤1 miLoading sold comps…