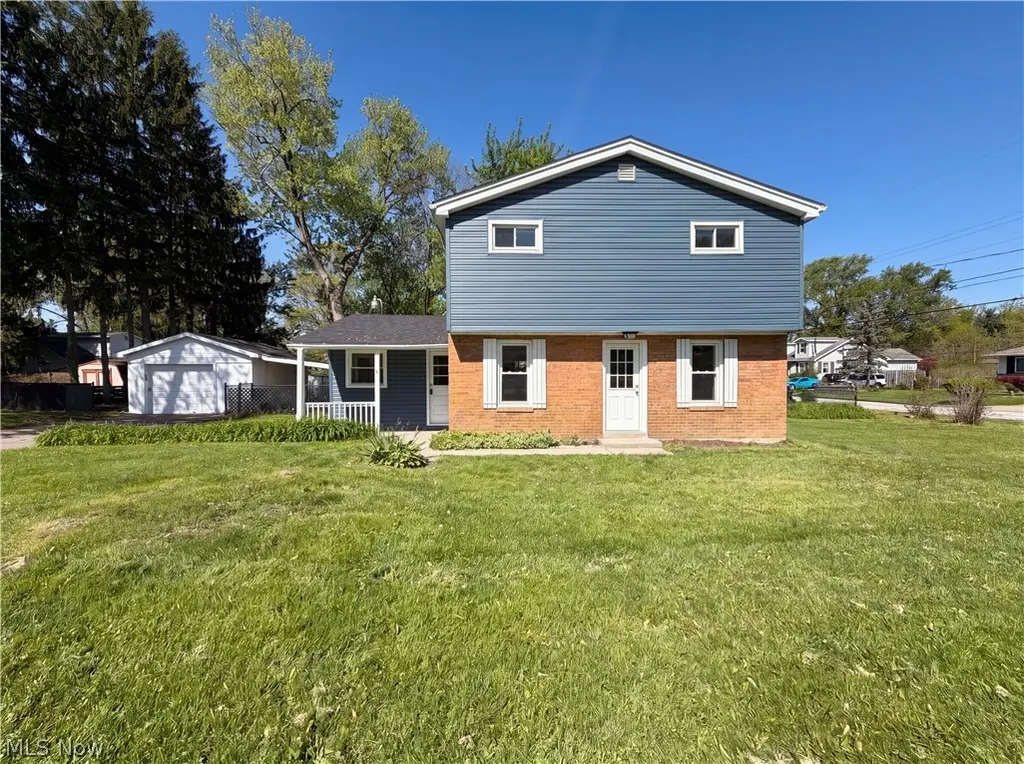
10338 Electric Blvd · Northfield, OH
Flood risk 1/10 · Minimal
- FEMA flood zone
- X (unshaded)
- Chance of flooding over 30 yrs
- 0.0%
- Est. flood insurance / yr
- $507 – $1,088
Fire risk 1/10 · Minimal
- Est. fire insurance / yr
- $713 – $1,323
Heat risk 2/10 · Minimal
- Hot days now (above 96°F)
- 7 days/yr
- Hot days in 30 yrs
- 17 days/yr
Wind risk 1/10 · Minimal
- Chance of severe wind over 30 yrs
- —
Air-quality risk 2/10 · Minimal
- Unhealthy air days now
- 1 days/yr
- Unhealthy air days in 30 yrs
- 3 days/yr
Risk factors via First Street. Map © Google.
Why this score? — see what drove the A- grade
The composite is a weighted blend of 9 inputs, each scored 0–100. Each bar is that input's sub-score; the figure is the points it added to the 100-point composite (weight × sub-score).
- Cash flow +30.0/30.0
- ARV discount +15.0/15.0
- 1% rule +10.0/10.0
- DSCR +10.0/10.0
- Schools +6.6/10.0
- Livability +4.0/5.0
- Rent growth +2.5/5.0
- Condition / age +2.5/5.0
- Appreciation +0.0/10.0
$195,000
🖨 Deal sheet 📄 Offer letter ✓ Due diligence
Listing remarks
Welcome to 10338 Electric Blvd, a residence that has been recently refreshed throughout with a fresh interior paint application and new flooring. The kitchen features an accent backsplash and contains stainless steel appliances, providing a modern and functional area. An accessible patio extends from the home, creating an outdoor space for various uses. This property presents a perfect blend of style and practicality for daily living. . Included 100-Day Home Warranty with buyer activation
Key facts
- Accessible patio
- New flooring
- Fresh interior paint
Tags
Property features AI
Exterior
- Parking: Detached garage (1 car)
- Utilities: Public water; Public sewer
- Home design: 2-story property; Above-grade finished area reported as 1,467 (owner reported)
- Construction: Brick and vinyl siding exterior; Asphalt roof; Slab foundation; Built year per public records
- Exterior features: Corner lot
Interior
- Bathrooms: 1 full bathroom; 1 half bathroom; 1 main-level bathroom
- Heating & cooling: Central air conditioning; Forced-air heating
- Interior features: Updated/remodeled condition; 7 total rooms
- Laundry & utility: In-unit laundry
Neighborhood map
What this means for you Summary
Snapshot
- This is a 3-bed/1.5-bath single-family listed at $195k.
Deal economics
- At list price, monthly cash flow is $999 ($12k/yr) — positive.
- The deal already cash-flows at list — no discount required.
- Meets the 1% rule at list price ($3k rent vs $195k).
- Cap rate 12.4% vs local median 5.2% in Northfield — top-decile yield for the area; either an underpriced asset or a hidden risk that comps aren't pricing in. Stress-test before assuming the spread holds.
Location & tenants
- Location reads 79/100 on livability (#143 in OH, #2,208 nationally) — a middle-class / working-renter tenant base. Strengths: schools A+, crime A+, cost of living A+; Watch: amenities F, commute F.
- Nordonia Hills City (suburban): math 72% / reading 79% proficiency, ranked #71 of 656 in OH (top 11%) — strong family-tenant draw, lease renewals of 3-5y typical; only 17% free/reduced lunch — higher-income household profile.
- Market conditions: 69 active listings in the ZIP; 2 comparable units currently listed for rent nearby; solid renter incomes; 1,114 units permitted in Summit County in 2024 (397 in 5+ unit buildings).
- This rent runs 41% of the median local income ($89k/yr) — at the standard rent-burdened threshold; future hikes will face affordability resistance.
Forward outlook
- Local home prices are declining (-3.0%/yr); year-one equity from $1k of loan paydown is wiped out by about $6k of value loss. Plan a longer hold.
- Summit County population projected to shrink 6% by 2050 — rents likely to lag national; underwrite the cash flow, not the appreciation.
- At projected returns (-3.0% appreciation + 3.0% rent growth), your $55k cash investment doubles in ~6 years — after that, you're playing with house money.
Negotiation context
- Only 4 days on market — expect competitive offers; lowballing is unlikely to land.
- 12 sale attempts since 7y ago with the ask held roughly flat each time — persistent listings suggest the price (not the market) is what's stuck; bring a comps-based counter.
Risks & watch-outs
- Watch-outs: built in 1959 — expect roof / HVAC / electrical / plumbing capex.
Questions for the listing agent
- Built in 1959 — when were the roof, HVAC, electrical panel, plumbing, and water heater last replaced?
- Is there a deadline driving the sale (1031 exchange, divorce, estate, relocation)? That informs how much negotiation room exists.
- Schools are A-rated — typically a magnet for longer-tenancy family renters. What's the average tenant stay here, and is there a school-zone premium baked into asking?
- What's the average days-on-market for RENTAL listings here right now (not sales)? A rising rental-DOM trend means longer vacancies and softer asking-rent achievability than the comps imply.
- What's the recent tenant-quality profile in this submarket — average credit score on applications, eviction rate, late-payment / NSF rate, and stable-employment percentage? A property-management company in the area should have these aggregated.
- How much new for-sale + rental construction is in the pipeline within 1–3 miles? Heavy new supply typically softens prices + rents 12–24 months out; constrained supply supports both.
Investment metrics
- 1% rule
- 1.56% ✓
- Cap rate
- 12.44%
- Cash-on-cash
- 21.95%
- DSCR
- 1.98
- GRM
- 5.3
CMA / ARV
- ARV (median comp)
- $242,458
- List price
- $195,000
- Delta
- -19.57%
- Verdict
- UNDERPRICED
- Comps
- 20 within 1.0 mi
Show comp detail 12 sales within ~0.75 mi
| Address | Dist | Beds/Ba | Sqft | Sold | Price | $/sf | Match |
|---|---|---|---|---|---|---|---|
| 10338 Electric Blvd | 0.00mi | 3/1.5 | 1,467 (0%) | 1mo | $206,500 | $141 | 100 |
| 256 Monroe Dr | 0.38mi | 3/1.5 | 1,393 (-5%) | 3mo | $188,500 | $135 | 71 |
| 93 Fell Ave | 0.34mi | 3/2.0 | 1,352 (-8%) | 0mo | $280,000 | $207 | 69 |
| 9207 N Plaza Dr | 0.47mi | 3/1.0 | 1,440 (-2%) | 7mo | $228,000 | $158 | 67 |
| 120 Fell Ave | 0.30mi | 4/2.0 (+1) | 1,400 (-5%) | 10mo | $250,000 | $179 | 63 |
| 264 Kennedy Blvd | 0.45mi | 3/1.5 | 1,560 (+6%) | 14mo | $265,000 | $170 | 57 |
| 66 Vincent Ave | 0.64mi | 3/2.0 | 1,361 (-7%) | 1mo | $307,000 | $226 | 55 |
| 233 May Ave | 0.28mi | 3/2.0 | 1,248 (-15%) | 10mo | $285,000 | $228 | 51 |
| 9097 Milford Dr | 0.57mi | 4/2.0 (+1) | 1,544 (+5%) | 8mo | $250,000 | $162 | 51 |
| 380 Dartmouth Trl | 0.59mi | 2/2.5 (-1) | 1,544 (+5%) | 6mo | $317,500 | $206 | 49 |
| 415 Woodside Dr | 0.63mi | 2/2.0 (-1) | 1,570 (+7%) | 10mo | $320,000 | $204 | 43 |
| 394 Houghton Rd #16 | 0.67mi | 2/2.5 (-1) | 1,535 (+5%) | 14mo | $271,000 | $177 | 40 |
Match score weights: distance 35% · size 25% · config 20% · recency 20%. Top-matched comps best support the ARV.
Projected returns pro-forma
-3.0% appreciation · 3.0% rent growth · sell at horizon
- IRR
- 14.7%
- Equity multiple
- 1.59×
- Total profit
- $32,085
- Equity at exit
- $29,075
- IRR
- 23.4%
- Equity multiple
- 3.02×
- Total profit
- $110,168
- Equity at exit
- $16,860
Cash invested: $54,600 (down + closing). Projections, not guarantees.
Landlord ↔ Tenant lean methodology
- Overall (STATE)
- 73 Landlord-Friendly
- State Ohio
- 73 Landlord-Friendly · R+6
- County
- — inherits STATE
- City
- — inherits STATE
ZIP-level market 44067
- Active inventory
- 69
- Price-to-rent
- 5.3×
Monthly cashflow live
- Estimated rent
- $3,044 medium interval (Pro) →
- Mortgage (P&I)
- −$1,023
- Tax from tax record
- −$303 /mo · $3,631/yr
- Insurance
- −$81
- HOA
- −$0
- Vacancy / Maint / Mgmt
- −$639
- Net cashflow
- $999
Break-even live
UW: 25.0% down · 7.5% · 30yr · 1.5% tax · 5.0% vac · 8.0% maint · 8.0% mgmt
Financing live
Cash to close
- Down payment
- $48,750
- Closing costs
- $5,850
- Reserves months
- —
- Total cash needed
- —
Loan-product check · same deal, 3 products live
Conventional
25% down · 7.5% · 30yr
- Down + closing
- —
- Monthly P&I
- —
- Monthly cashflow
- —
- DSCR
- —
- Eligible?
- —
Personal DTI + credit; lowest rate.
DSCR
20% down · 8.5% · 30yr
- Down + closing
- —
- Monthly P&I
- —
- Monthly cashflow
- —
- DSCR
- —
- Eligible?
- —
No personal income docs; deal must DSCR.
Hard money
10% down · 12.0% · 12mo
- Down + closing
- —
- Monthly P&I
- —
- Monthly cashflow
- —
- DSCR
- —
- Eligible?
- —
Short-term bridge; refi at stabilization.
Rent comps 2 comps
| Address | Beds | Baths | Sqft | Rent | $/sqft | DOM | Units | Dist |
|---|---|---|---|---|---|---|---|---|
| 201 Eaton Ridge Dr Northfield, OH | 1.0–2.0 | 1.0–2.0 | 956 | $1,679 | $1.76 | 1d | 6 | 0.19mi |
| 185 Heights Ave Unit 1496098P Northfield, OH | 4.0 | 2.0 | 1603 | $6,547 | $4.08 | 1d | 1 | 0.67mi |
Listing history 39 events
-
2026-05-08status Pending 493-char remark
-
2026-05-04$195,000 Active 493-char remark
-
2026-04-16soldstatus $195,000
-
2025-07-16historical
-
2025-07-13status Active
-
2025-07-03status Pending
-
2025-06-30$200,000 Active
-
2024-11-04$225,000 Active
-
2021-08-25soldstatus $160,000 Closed
-
2021-06-05status Pending
-
2021-05-19historical Contingent
-
2021-05-14status Active
-
2021-03-27status Active
-
2021-02-26status Pending
-
2021-02-12historical Contingent
-
2021-02-01price $150,000
-
2021-01-07price $157,500
-
2020-12-11$165,000 Active
-
2020-12-05historical $165,000
-
2020-03-31soldstatus $51,000 Closed
-
2020-03-24status Pending
-
2020-03-13price $54,900
-
2020-02-06price $59,900
-
2020-01-29status Active
-
2020-01-28status Pending
-
2019-12-19price $64,900
-
2019-11-18status Active
-
2019-11-18price $69,900
-
2019-11-13status Pending
-
2019-11-13status Active
-
2019-10-22status Pending
-
2019-09-24price $74,900
-
2019-09-20status Active
-
2019-09-04status Pending
-
2019-08-12price $78,000
-
2019-07-09price $82,500
-
2019-06-10price $89,900
-
2019-05-10$94,900 Active
-
2019-02-21soldstatus $72,000
ⓘ Source: listings_history table (triggers on properties + properties_extension) + one-shot
backfill from property_details.listing_events for pre-trigger history.
Tax reassessment forecast OH · Partial reset (capped growth)
- Current annual tax
- $3,631 · $303/mo
- Projected year-2 tax
- $3,631 · $303/mo
- Expected delta
- $0/yr ($0/mo · 0.0%)
ⓘ Screening estimate from a state-policy table — verify with the county assessor before closing.
Climate risk First Street
- Flood 1/10 Low FEMA zone X (unshaded) · 0% chance over 30 yrs
- Wildfire 1/10 Low
- Heat 2/10 Low 7 d/yr ≥96°F today · 17 d/yr by 30 yrs out
- Wind 1/10 Low
- Air quality 2/10 Low 1 unhealthy d/yr today · 3 by 30 yrs out
Nearby sold comps map
Loading sold comps map…
Walkable amenities ~0.75 mi
Loading nearby amenities…
Taxation est. · year 1
- Rental income
- $36,532
- − Mortgage interest
- −$10,923
- − Property taxes
- −$3,631
- − Insurance
- −$975
- − Repairs & maintenance
- −$2,923
- − Management
- −$2,923
- − Depreciation
- −$5,673
- Taxable income
- $9,485
- Est. tax owed @ 24.0%
- −$2,276
- After-tax cash flow
- $9,707/yr
For passive investors: Depreciation is non-cash, so a rental often shows a tax loss while cash-flowing — sheltering income. Rental losses are passive: they offset passive income freely, and up to $25,000/yr can offset ordinary (W-2) income if you actively participate and your MAGI is under $100k (phasing out to $0 by $150k); unused losses carry forward. On sale, claimed depreciation is recaptured at up to 25%, and gains may owe capital-gains tax (a 1031 exchange can defer both). Figures are a year-1 estimate at your 24.0% rate — not tax advice; consult a CPA.
Schools (NCES district)
- District
- Nordonia Hills City
- NCES district ID
- 3905004
- Math proficiency
- 72% ▼ -9.00%
- Reading proficiency
- 79% ▼ -3.00%
- Median HH income
- $74,658
- Composite
- 66.26/100
- National rank
- #428
- State rank
- #71 of 656 in OH
Livability — Northfield
- Score
- 79/100
- State rank
- #143
- US rank
- #2208
Category grades
Schools grade is shown separately in the Schools card above.
Census & demographics
- Census place
- Northfield, OH
- County
- Summit · 539,389 people
- Metro
- Akron, OH
- Population (ZIP)
- 19,917
- Household income
- $89,082
- Rent vs Own
- Severe rent burden
- 13.4
Population outlook (Summit County) Hauer SSP2
- Today (2025)
- 546,583 people
- By 2030
- 544,028 · -0.5%
- By 2040
- 531,363 · -2.8%
- By 2050
- 514,923 · -5.8%
- By 2075
- 481,765 · -11.9%
- By 2100
- 432,265 · -20.9%
Race, ethnicity, and origin ACS 2023
- Neighborhood character
- Predominantly White (85%)
- Race & ethnicity
- White 85% Black 6% Two or more races 4% Asian 3% Hispanic / Latino 2%
- Common ancestry
- Romanian 14% Slovak 3% Lithuanian 1%
- Foreign-born
- 6% · Canada, China
- Languages at home
- 94% English-only · Other Indo-European 2% Chinese 1% Spanish 1%
Political lean MEDSL · Summit
- 2024 margin
- Lean D (+7.0) · D 53.0% · R 46.0%
- 2008→2024 swing
- -9.6pp toward R · 2008: 16.6pp · 2024: 7.0pp
- All cycles
- 2024: D+7.0 2020: D+9.6 2016: D+8.2 2012: D+14.8 2008: D+16.6
Not yet ingested
- Civics
- —
Market trends
- HPI YoY
- ▼ -112.75%
- Current HPI
- 198.7729
- Rent YoY
- —
- Metro
- —
- State GDP YoY
- ▲ 1.98%
- F500 in state
- 48
Industry mix (Fortune 500 HQ in OH)
| Industry | F500 HQs | Revenue |
|---|---|---|
| Insurance | 3 | $145B |
|
||
| Industrial Machinery | 3 | $49B |
|
||
| Financial Services | 3 | $24B |
|
||
| Consumer Goods | 2 | $93B |
|
||
| Aerospace / Defense | 2 | $47B |
|
||
| Utilities | 2 | $33B |
|
||
Price history
+186.8% since first listed40 events — show timeline
- 2026-06-02 Sold (MLS) $206,500 MLSNOW
- 2026-05-08 Pending — MLSNOW
- 2026-05-04 Listed $195,000 MLSNOW
- 2026-04-16 Sold (Public Records) $195,000 Public Records
- 2025-07-16 Listing Removed — MLSNOW
- 2025-07-13 Relisted — MLSNOW
- 2025-07-03 Pending — MLSNOW
- 2025-06-30 Listed $200,000 MLSNOW
- 2024-11-04 Listed $225,000 MLSNOW
- 2021-08-25 Sold (MLS) $160,000 MLSNOW
- 2021-06-05 Pending — MLSNOW
- 2021-05-19 Contingent — MLSNOW
- 2021-05-14 Relisted — MLSNOW
- 2021-03-27 Relisted — MLSNOW
- 2021-02-26 Pending — MLSNOW
- 2021-02-12 Contingent — MLSNOW
- 2021-02-01 Price Changed $150,000 MLSNOW
- 2021-01-07 Price Changed $157,500 MLSNOW
- 2020-12-11 Listed $165,000 MLSNOW
- 2020-12-05 Coming Soon $165,000 MLSNOW
- 2020-03-31 Sold (MLS) $51,000 MLSNOW
- 2020-03-24 Pending — MLSNOW
- 2020-03-13 Price Changed $54,900 MLSNOW
- 2020-02-06 Price Changed $59,900 MLSNOW
- 2020-01-29 Relisted — MLSNOW
- 2020-01-28 Pending — MLSNOW
- 2019-12-19 Price Changed $64,900 MLSNOW
- 2019-11-18 Relisted — MLSNOW
- 2019-11-18 Price Changed $69,900 MLSNOW
- 2019-11-13 Pending — MLSNOW
- 2019-11-13 Relisted — MLSNOW
- 2019-10-22 Pending — MLSNOW
- 2019-09-24 Price Changed $74,900 MLSNOW
- 2019-09-20 Relisted — MLSNOW
- 2019-09-04 Pending — MLSNOW
- 2019-08-12 Price Changed $78,000 MLSNOW
- 2019-07-09 Price Changed $82,500 MLSNOW
- 2019-06-10 Price Changed $89,900 MLSNOW
- 2019-05-10 Listed $94,900 MLSNOW
- 2019-02-21 Sold (Public Records) $72,000 Public Records
Property tax history
+6.8%/yrLatest (2025): $3,631 · +4.5% YoY. Source: county tax records.
Cash-flow waterfall
monthlySold comps — $/sqft
last 12 mo · ≤1 miLoading sold comps…