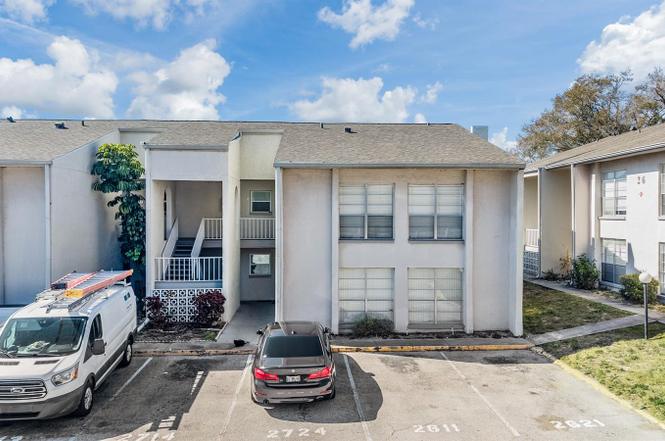
2625 State Road 590 #2714 · Clearwater, FL
Flood risk 1/10 · Minimal
- FEMA flood zone
- X (unshaded)
- Chance of flooding over 30 yrs
- 0.0%
- Est. flood insurance / yr
- $507 – $1,088
Fire risk 1/10 · Minimal
- Est. fire insurance / yr
- $947 – $1,759
Heat risk 10/10 · Severe
- Hot days now (above 107°F)
- 7 days/yr
- Hot days in 30 yrs
- 28 days/yr
Wind risk 10/10 · Severe
- Chance of severe wind over 30 yrs
- 99.0%
Air-quality risk 3/10 · Minor
- Unhealthy air days now
- 3 days/yr
- Unhealthy air days in 30 yrs
- 3 days/yr
Risk factors via First Street. Map © Google.
Why this score? — see what drove the D grade
The composite is a weighted blend of 9 inputs, each scored 0–100. Each bar is that input's sub-score; the figure is the points it added to the 100-point composite (weight × sub-score).
- 1% rule +10.0/10.0
- Cash flow +9.1/30.0
- ARV discount +7.5/15.0
- Schools +4.3/10.0
- Livability +4.1/5.0
- DSCR +2.5/10.0
- Condition / age +2.5/5.0
- Rent growth +1.1/5.0
- Appreciation +0.0/10.0
$124,900
🖨 Deal sheet (PDF) 📄 Offer letter ✓ Due diligence
Listing remarks
Welcome to this spacious 3-bedroom, 2-bath condo located in the heart of Clearwater. Situated on the first floor of a two-story building, this 1,274 sq. ft unit offers a functional and comfortable layout with ceramic tile flooring throughout—no carpet. With a little love and personal touches, this condo could be transformed into a perfect winter getaway, full-time residence, or investment opportunity. The home features generously sized bedrooms and a large kitchen that flows seamlessly into the dining area, ideal for everyday living and entertaining. A formal living room provides ample space to relax and unwind. The primary suite offers an en suite bathroom with a tub/shower combinati
Key facts
- En suite bathroom
- Walk-in closet
- Swimming pool
Tags
Property features AI
Finance
- Other: Association name: Ameri Tech / Robert Kelly
- Financial info: Total annual association fees $11,244; Lease restrictions apply
- HOA & community: Monthly condo fee of $937; Association required with buyer approval; Association covers pool, clubhouse, tennis courts, maintenance (structure & grounds), management, sewer, trash, water, and escrow reserves; Community amenities include pool, clubhouse, tennis courts and street lights; Pets allowed (maximum ~15 lbs)
Exterior
- Utilities: Public water; Public sewer; Electricity available and connected; Cable available and connected; Water connected
- Home design: Residential condominium; One-level entry (unit on first floor); Faces northwest; 2 total stories in building
- Construction: Concrete and frame construction; Shingle roof; Slab foundation; Building number 27
- Exterior features: Rear screened porch; Rain gutters; Sliding doors; Located in city limits; Near public transit; Asphalt road
Interior
- Kitchen: Dishwasher; Disposal; Microwave; Range; Refrigerator; Electric water heater
- Bedrooms: 3 bedrooms
- Flooring: Ceramic tile
- Bathrooms: 2 full bathrooms
- Heating & cooling: Central heating (electric); Central air conditioning
- Interior features: Ceiling fans; Blinds; Smoke detectors
- Laundry & utility: Indoor laundry room; Inside utility
Neighborhood map
What this means for you Summary
Snapshot
- This is a 3-bed/2.0-bath condo listed at $125k.
Deal economics
- At list price, monthly cash flow is $-97 ($-1k/yr) — negative.
- To cash-flow at today's rent, offer at most $108k (13.7% below list).
- Meets the 1% rule at list price ($2k rent vs $125k).
- Recommended offer: $108k (13.7% below list) — sets the bar for cash-flow.
- Cap rate 5.4% vs local median 2.9% in Clearwater — top-decile yield for the area; either an underpriced asset or a hidden risk that comps aren't pricing in. Stress-test before assuming the spread holds.
Location & tenants
- Location reads 82/100 on livability (#60 in FL, #988 nationally) — a professional / high-income tenant draw. Strengths: commute A+, housing A+, health & safety A+; Watch: employment C-.
- Pinellas (suburban): math 51% / reading 51% proficiency, ranked #31 of 73 in FL (top 42%) — acceptable for families but not a draw, mixed tenant base, ~2y average lease.
- Zoned schools: Mcmullen-Booth Elementary School (math 44% / reading 46%, grade D-, #1,271 of 2,144 statewide, top 60%, 458 students, 63% FRL); Safety Harbor Middle School (math 45% / reading 43%, grade D, #327 of 571 statewide, top 57%, 974 students, 50% FRL); Clearwater High School (math 30% / reading 36%, grade F, #406 of 667 statewide, top 61%, 1,664 students, 59% FRL).
- Market conditions: Rents falling (-5.6%/yr); 116 active listings in the ZIP; 40 comparable units currently listed for rent nearby; rentals leasing fast (median 6d on market — plan ~1-2 weeks tenant-placement turnaround); 2,676 units permitted in Pinellas County in 2024 (1,422 in 5+ unit buildings).
- This rent runs 38% of the median local income ($67k/yr) — at the standard rent-burdened threshold; future hikes will face affordability resistance.
Forward outlook
- Local home prices are declining (-3.0%/yr); year-one equity from $864 of loan paydown is wiped out by about $4k of value loss. Plan a longer hold.
- Pinellas County population projected at +14% by 2050 — modest demand growth; plan on rents tracking national, not racing it.
Negotiation context
- It's been on market 135 days — a 12% lower offer ($110k) is reasonable based on typical stale-listing flexibility.
- Current owner paid $64k; list at $125k implies a 97% gain — meaningful room to come down on a strong offer.
Risks & watch-outs
- Watch-outs: HOA is 44% of rent.
- Climate carrying-cost: severe wind risk, 99% chance of damaging wind over 30y; extreme-heat days projected 7→28/yr by 2055 (HVAC capex compounding) — expect insurance premiums to compound above CPI over the hold.
Questions for the listing agent
- What do current leases actually rent for vs. the listed asking? Can we see a recent rent roll and the last 12 months of T-12 income?
- It's been on market 135 days. Have you received any prior offers? Is the seller open to a 14% concession, seller financing, or rate buy-down credit?
- Built in 1976 — when were the roof, HVAC, electrical panel, plumbing, and water heater last replaced?
- What does the HOA fee cover, when was the last increase, and are there any pending special assessments or reserve-fund shortfalls?
- Any open or pending special assessments — roof, HVAC, plumbing, elevator, façade? What's the per-unit balance and payoff schedule, and is the seller paying it off at close or rolling it to the buyer?
- Why hasn't it sold? Are there any deal-killer items the seller is aware of (foundation, flood, title, zoning, code violations)?
- Is there a deadline driving the sale (1031 exchange, divorce, estate, relocation)? That informs how much negotiation room exists.
- The area grade is low — what's the realistic commute time and amenity access for the typical tenant pool here? Any planned neighborhood developments (good or bad) we should know about?
- What's the average days-on-market for RENTAL listings here right now (not sales)? A rising rental-DOM trend means longer vacancies and softer asking-rent achievability than the comps imply.
- What's the recent tenant-quality profile in this submarket — average credit score on applications, eviction rate, late-payment / NSF rate, and stable-employment percentage? A property-management company in the area should have these aggregated.
- How much new apartment / multifamily construction is in the pipeline within 1–3 miles? Heavy new supply (>2% of stock underway) typically softens rents 12–24 months out; light construction supports rent growth.
Investment metrics
- 1% rule
- 1.71% ✓
- Cap rate
- 5.36%
- Cash-on-cash
- -3.32%
- DSCR
- 0.85
- GRM
- 4.9
CMA / ARV
No comps found within radius.
Projected returns pro-forma
-3.0% appreciation · 0.0% rent growth · sell at horizon
- IRR
- -29.0%
- Equity multiple
- 0.08×
- Total profit
- $-32,073
- Equity at exit
- $18,623
- IRR
- -84.7%
- Equity multiple
- -0.65×
- Total profit
- $-57,654
- Equity at exit
- $10,799
Cash invested: $34,972 (down + closing). Projections, not guarantees.
Landlord ↔ Tenant lean methodology
- Overall (STATE)
- 87 Strongly Landlord-Friendly
- State Florida
- 87 Strongly Landlord-Friendly · R+3
- County
- — inherits STATE
- City
- — inherits STATE
ZIP-level market 33759
- Rents YoY
- -5.6%
- Active inventory
- 116
- Price-to-rent
- 4.9×
Monthly cashflow live
- Estimated rent
- $2,139 high interval (Pro) →
- Mortgage (P&I)
- −$655
- Tax from tax record
- −$142 /mo · $1,707/yr
- Insurance
- −$52
- HOA
- −$937
- Vacancy / Maint / Mgmt
- −$449
- Net cashflow
- $-97
Break-even live
Sensitivity live
| Price | -10% $-26 | -5% $-61 | +0% $-97 | +5% $-132 | +10% $-168 |
|---|---|---|---|---|---|
| Rent | -10% $-266 | -5% $-181 | +0% $-97 | +5% $-12 | +10% $72 |
| Rate | -1.0pp $-34 | -0.5pp $-65 | base $-97 | +0.5pp $-129 | +1.0pp $-162 |
UW: 25.0% down · 7.5% · 30yr · 1.5% tax · 5.0% vac · 8.0% maint · 8.0% mgmt
Financing live
Cash to close
- Down payment
- $31,225
- Closing costs
- $3,747
- Reserves months
- —
- Total cash needed
- —
Loan-product check · same deal, 3 products live
Conventional
25% down · 7.5% · 30yr
- Down + closing
- —
- Monthly P&I
- —
- Monthly cashflow
- —
- DSCR
- —
- Eligible?
- —
Personal DTI + credit; lowest rate.
DSCR
20% down · 8.5% · 30yr
- Down + closing
- —
- Monthly P&I
- —
- Monthly cashflow
- —
- DSCR
- —
- Eligible?
- —
No personal income docs; deal must DSCR.
Hard money
10% down · 12.0% · 12mo
- Down + closing
- —
- Monthly P&I
- —
- Monthly cashflow
- —
- DSCR
- —
- Eligible?
- —
Short-term bridge; refi at stabilization.
Rent comps 40 comps
| Address | Beds | Baths | Sqft | Rent | $/sqft | DOM | Units | Dist |
|---|---|---|---|---|---|---|---|---|
| 2625 Florida 590 Unit 2514 Clearwater, FL | 3.0 | 2.0 | 1274 | $2,200 | $1.73 | 12d | 1 | 0.04mi |
| 2550 Stag Run Blvd Clearwater, FL | 1.0–3.0 | 1.0–2.0 | 1189 | $2,284 | $1.92 | 3d | 19 | 0.36mi |
| 1301 Fairwood Ave Clearwater, FL | 3.0 | 2.0 | 1104 | $2,355 | $2.13 | 6d | 1 | 0.58mi |
| 776 Fairwood Ln Clearwater, FL | 2.0 | 1.5 | 1305 | $1,949 | $1.49 | 12d | 1 | 0.62mi |
| 730 N Old Coachman Rd Clearwater, FL | 2.0 | 2.0 | 950 | $1,705 | $1.79 | 4d | 3 | 0.66mi |
| 625 Fairwood Forest Dr Clearwater, FL | 3.0 | 2.5 | 1528 | $2,200 | $1.44 | 26d | 1 | 0.70mi |
| 1403 Arrowhead Cir W Unit 13E Clearwater, FL | 2.0 | 2.0 | 886 | $1,750 | $1.98 | 26d | 1 | 0.76mi |
| 530 Fairwood Ave Clearwater, FL | 2.0–3.0 | 1.0–2.0 | 1042 | $1,761 | $1.69 | 0d | 23 | 0.77mi |
| 2690 Drew St Clearwater, FL | 1.0–3.0 | 1.0–2.0 | 974 | $1,775 | $1.82 | 3d | 12 | 0.80mi |
| 2403 Brigadoon Dr Clearwater, FL | 2.0 | 2.5 | 1088 | $3,100 | $2.85 | 6d | 1 | 0.82mi |
| 1884 Yale Dr Clearwater, FL | 3.0 | 2.0 | 1503 | $3,200 | $2.13 | 6d | 1 | 0.84mi |
| 2578 Sea Wind Way Clearwater, FL | 2.0 | 2.5 | 1252 | $2,100 | $1.68 | 26d | 1 | 0.93mi |
| 1602 Brigadoon Dr Clearwater, FL | 2.0 | 1.5 | 896 | $1,750 | $1.95 | 0d | 1 | 0.93mi |
| 2031 Searay Shore Dr Clearwater, FL | 3.0 | 2.5 | 1544 | $2,350 | $1.52 | 26d | 1 | 0.94mi |
| 2031 Glass Loop Clearwater, FL | 1.0–3.0 | 1.0–2.0 | 1058 | $2,955 | $2.79 | 0d | 37 | 0.97mi |
| 2464 Australia Way E #24 Clearwater, FL | 2.0 | 2.0 | 1100 | $1,600 | $1.45 | 26d | 1 | 0.98mi |
| 1733 Ragland Ave Clearwater, FL | 3.0 | 2.0 | 1092 | $2,431 | $2.23 | 6d | 1 | 0.98mi |
| 2463 Brazilia Dr #61 Clearwater, FL | 2.0 | 1.0 | 1100 | $1,450 | $1.32 | 26d | 1 | 0.98mi |
| 3021 State Road 590 Clearwater, FL | 1.0–3.0 | 1.0–2.0 | 977 | $2,107 | $2.16 | 0d | 24 | 1.03mi |
| 2434 Australia Way E #50 Clearwater, FL | 2.0 | 2.0 | 1400 | $1,700 | $1.21 | 3d | 1 | 1.04mi |
| 2433 Brazilia Dr #49 Clearwater, FL | 2.0 | 2.0 | 1100 | $1,750 | $1.59 | 26d | 1 | 1.05mi |
| 2600 W Grand Reserve Cir Clearwater, FL | 1.0–3.0 | 1.0–2.0 | 1097 | $2,570 | $2.34 | 0d | 34 | 1.07mi |
| 2451 Canadian Way Clearwater, FL | 2.0 | 1.0–2.0 | 1250 | $1,598 | $1.28 | 9d | 2 | 1.09mi |
| 2020 World Parkway Blvd #54 Clearwater, FL | 2.0 | 2.0 | 1400 | $1,795 | $1.28 | 12d | 1 | 1.09mi |
| 2450 Canadian Way #26 Clearwater, FL | 2.0 | 2.0 | 1400 | $1,700 | $1.21 | 26d | 1 | 1.15mi |
| 101 S Old Coachman Rd Clearwater, FL | 3.0 | 1.0–2.0 | 983 | $2,665 | $2.71 | 0d | 15 | 1.15mi |
| 2040 World Parkway Blvd #34 Clearwater, FL | 2.0 | 2.0 | 1400 | $1,650 | $1.18 | 26d | 1 | 1.18mi |
| 2448 Columbia Dr #72 Clearwater, FL | 2.0 | 2.0 | 1100 | $1,600 | $1.45 | 25d | 1 | 1.23mi |
| 2071 Australia Way W #29 Clearwater, FL | 2.0 | 2.0 | 1100 | $1,525 | $1.39 | 26d | 1 | 1.23mi |
| 2428 Columbia Dr #68 Clearwater, FL | 2.0 | 2.0 | 1100 | $1,750 | $1.59 | 6d | 1 | 1.24mi |
| 2429 Ecuadorian Way #65 Clearwater, FL | 2.0 | 2.0 | 1100 | $1,600 | $1.45 | 6d | 1 | 1.26mi |
| 2466 Ecuadorian Way #32 Clearwater, FL | 2.0 | 2.0 | 1100 | $1,600 | $1.45 | 26d | 1 | 1.28mi |
| 2310 Denmark St Clearwater, FL | 2.0 | 2.0 | 1100 | $1,550 | $1.41 | 0d | 1 | 1.30mi |
| 2456 Ecuadorian Way #42 Clearwater, FL | 2.0 | 2.0 | 1100 | $1,700 | $1.55 | 6d | 1 | 1.30mi |
| 2311 Brisbane St #65 Clearwater, FL | 2.0 | 2.0 | 1100 | $1,700 | $1.55 | 14d | 1 | 1.30mi |
| 2455 Finlandia Ln #67 Clearwater, FL | 2.0 | 2.0 | 1100 | $1,495 | $1.36 | 13d | 1 | 1.31mi |
| 2361 Ecuadorian Way #45 Clearwater, FL | 2.0 | 2.0 | 1400 | $1,700 | $1.21 | 6d | 1 | 1.33mi |
| 2402 Ecuadorian Way Clearwater, FL | 2.0 | 2.0 | 1400 | $1,800 | $1.29 | 26d | 2 | 1.34mi |
| 2402 Ecuadorian Way #28 Clearwater, FL | 2.0 | 2.0 | 1400 | $1,900 | $1.36 | 6d | 1 | 1.35mi |
| 2378 Ecuadorian Way #38 Clearwater, FL | 2.0 | 2.0 | 1400 | $1,800 | $1.29 | 3d | 1 | 1.36mi |
HOA detail condo
- Monthly dues
- $937 · $11,244/yr
- Likely covers
- water
- Assessments
- None detected in remarks — confirm with the listing agent.
Listing history 17 events
-
2026-06-22days on market $124,900 Active 135 DOM
-
2026-06-18days on market $124,900 Active 132 DOM
-
2026-06-17days on market $124,900 Active 131 DOM
-
2026-06-16days on market $124,900 Active 130 DOM
-
2026-06-15days on market $124,900 Active 129 DOM
-
2026-06-13days on market $124,900 Active 127 DOM
-
2026-06-09days on market $124,900 Active 123 DOM
-
2026-06-08days on market $124,900 Active 122 DOM
-
2026-06-07days on market $124,900 Active 121 DOM
-
2026-06-04days on market $124,900 Active 118 DOM
-
2026-06-03days on market $124,900 Active 117 DOM
-
2026-06-01days on market $124,900 Active 115 DOM
-
2026-05-31days on market $124,900 Active 114 DOM
-
2026-04-14price $124,900
-
2026-02-06$139,900 Active
-
2001-07-13soldstatus $63,500
-
1999-11-17soldstatus $52,500
ⓘ Source: listings_history table (triggers on properties + properties_extension) + one-shot
backfill from property_details.listing_events for pre-trigger history.
Tax reassessment forecast FL · Resets to sale price
- Current annual tax
- $1,707 · $142/mo
- Projected year-2 tax
- $1,707 · $142/mo
- Expected delta
- $0/yr ($0/mo · 0.0%)
ⓘ Screening estimate from a state-policy table — verify with the county assessor before closing.
Climate risk First Street
- Flood 1/10 Low FEMA zone X (unshaded) · 0% chance over 30 yrs
- Wildfire 1/10 Low
- Heat 10/10 Extreme 7 d/yr ≥107°F today · 28 d/yr by 30 yrs out
- Wind 10/10 Extreme 99% chance of damaging wind over 30 yrs
- Air quality 3/10 Moderate 3 unhealthy d/yr today · 3 by 30 yrs out
Nearby sold comps map
Loading sold comps map…
Walkable amenities ~0.75 mi
Loading nearby amenities…
Taxation est. · year 1
- Rental income
- $25,663
- − Mortgage interest
- −$6,996
- − Property taxes
- −$1,707
- − Insurance
- −$624
- − Repairs & maintenance
- −$2,053
- − Management
- −$2,053
- − HOA
- −$11,244
- − Depreciation
- −$3,633
- Taxable loss
- −$2,649
- Est. tax savings @ 24.0%
- +$636
- After-tax cash flow
- $-526/yr
For passive investors: Depreciation is non-cash, so a rental often shows a tax loss while cash-flowing — sheltering income. Rental losses are passive: they offset passive income freely, and up to $25,000/yr can offset ordinary (W-2) income if you actively participate and your MAGI is under $100k (phasing out to $0 by $150k); unused losses carry forward. On sale, claimed depreciation is recaptured at up to 25%, and gains may owe capital-gains tax (a 1031 exchange can defer both). Figures are a year-1 estimate at your 24.0% rate — not tax advice; consult a CPA.
Schools (NCES district)
- District
- Pinellas
- NCES district ID
- 1201560
- Math proficiency
- 51% ▼ -5.00%
- Reading proficiency
- 51% ▼ -3.00%
- Median HH income
- $46,270
- Composite
- 43.27/100
- National rank
- #3046
- State rank
- #31 of 73 in FL
Livability — Clearwater
- Score
- 82/100
- State rank
- #60
- US rank
- #988
Category grades
Schools grade is shown separately in the Schools card above.
Census & demographics
- Census place
- Clearwater, FL
- County
- Pinellas County · 939,478 people
- City population
- 170,933
- Metro
- Tampa-St. Petersburg-Clearwater, FL
- Population (ZIP)
- 17,557
- Household income
- $67,492
- Rent vs Own
- Severe rent burden
- 1209.0
Population outlook (Pinellas County) Hauer SSP2
- Today (2025)
- 1,027,532 people
- By 2030
- 1,063,586 · +3.5%
- By 2040
- 1,125,020 · +9.5%
- By 2050
- 1,168,637 · +13.7%
- By 2075
- 1,265,188 · +23.1%
- By 2100
- 1,260,357 · +22.7%
Race, ethnicity, and origin ACS 2023
- Neighborhood character
- Majority White (65%)
- Race & ethnicity
- White 65% Hispanic / Latino 19% Two or more races 14% Black 7% Asian 3%
- Hispanic origin (detail)
- Mexican 7% Puerto Rican 3% Cuban 3%
- Common ancestry
- Romanian 4% Slovak 3% Italian 2%
- Foreign-born
- 16% · Canada, Jamaica, Vietnam
- Languages at home
- 79% English-only · Spanish 12% Other Indo-European 4% Russian/Polish/Slavic 1%
Political lean MEDSL · Pinellas
- 2024 margin
- Lean R (+5.2) · D 46.9% · R 52.1%
- 2008→2024 swing
- -13.5pp toward R · 2008: 8.3pp · 2024: -5.2pp
- All cycles
- 2024: R+5.2 2020: D+0.2 2016: R+1.1 2012: D+5.6 2008: D+8.3
Not yet ingested
- Civics
- —
Market trends
- HPI YoY
- ▼ -249.16%
- Current HPI
- 343.0721
- Rent YoY
- ▼ -5.57%
- Metro
- Tampa-St. Petersburg-Clearwater, FL
- State GDP YoY
- ▲ 3.28%
- F500 in state
- 36
Industry mix (Fortune 500 HQ in FL)
| Industry | F500 HQs | Revenue |
|---|---|---|
| Industrial Technology | 2 | $29B |
|
||
| Insurance | 2 | $17B |
|
||
| Retail | 1 | $60B |
|
||
| Technology Distribution | 1 | $58B |
|
||
| Homebuilding | 1 | $35B |
|
||
| Technology Manufacturing | 1 | $35B |
|
||
Price history
+137.9% since first listed4 events — show timeline
- 2026-04-14 Price Changed $124,900 Stellar MLS as Distributed by MLS Grid
- 2026-02-06 Listed $139,900 Stellar MLS as Distributed by MLS Grid
- 2001-07-13 Sold (Public Records) $63,500 Public Records
- 1999-11-17 Sold (Public Records) $52,500 Public Records
Property tax history
+4.5%/yrLatest (2025): $1,707 · -17.8% YoY. Source: county tax records.
Cash-flow waterfall
monthlySold comps — $/sqft
last 12 mo · ≤1 miLoading sold comps…