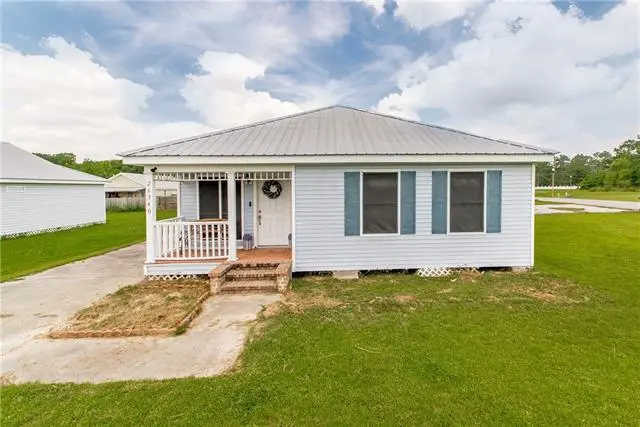
26340 Indian Run Rd · Killian, LA
Flood risk 6/10 · Moderate
- FEMA flood zone
- X (unshaded)
- Chance of flooding over 30 yrs
- 0.75%
- Est. flood insurance / yr
- $507 – $1,088
Fire risk 2/10 · Minimal
- Est. fire insurance / yr
- $1,269 – $2,357
Heat risk 8/10 · Major
- Hot days now (above 108°F)
- 7 days/yr
- Hot days in 30 yrs
- 21 days/yr
Wind risk 9/10 · Severe
- Chance of severe wind over 30 yrs
- 99.0%
Air-quality risk 2/10 · Minimal
- Unhealthy air days now
- 1 days/yr
- Unhealthy air days in 30 yrs
- 1 days/yr
Risk factors via First Street. Map © Google.
Why this score? — see what drove the C grade
The composite is a weighted blend of 9 inputs, each scored 0–100. Each bar is that input's sub-score; the figure is the points it added to the 100-point composite (weight × sub-score).
- ARV discount +15.0/15.0
- Cash flow +14.1/30.0
- Appreciation +10.0/10.0
- DSCR +4.3/10.0
- Schools +4.0/10.0
- 1% rule +3.4/10.0
- Livability +2.9/5.0
- Rent growth +2.5/5.0
- Condition / age +2.5/5.0
$185,000
🖨 Deal sheet 📄 Offer letter ✓ Due diligence
Listing remarks MLS
If you are looking for your own water access to Blind River or the Lake, this is it! This 3 bed 2 bath cottage/camp style home is for you. Not to mention having a community pool for long summer days, you have your own community dock to slip right in for fishing or fun. Sitting on an oversized lot, this property is awaiting its next set of owners. That is not all, FLOOD ZONE X. Priced to sell and going on the market just in time for summer.
Key facts
- Community pool
- Community dock
- Oversized lot
Tags
Property features AI
Finance
- HOA & community: Homeowners association with an annual fee of $395; Community features include a pool and water access
Exterior
- Parking: Carport with two parking spaces
- Security: Smoke detector(s)
- Utilities: Public water; Treatment plant sewer
- Home design: Single-story; Resale; Raised foundation; Vinyl siding; Metal roof; Located outside city limits; Irregular lot (63x132x105x125)
- Construction: Vinyl siding construction; Metal roof; Raised foundation; Built previously (resale)
- Exterior features: Covered porch; Dock; Shed(s); Community pool; Water access including canal and river
Interior
- Kitchen: Dishwasher; Oven; Range; Refrigerator
- Bathrooms: 2 full bathrooms
- Heating & cooling: Central heating; Central air conditioning; Has heating and cooling
- Interior features: Attic; Ceiling fan(s); Pull-down attic stairs; Very good condition
- Laundry & utility: Washer hookup; Dryer hookup
Neighborhood map
What this means for you Summary
Snapshot
- This is a 3-bed/2.0-bath single-family listed at $185k.
Deal economics
- At list price, monthly cash flow is $26 ($306/yr) — positive.
- The deal already cash-flows at list — no discount required.
- To meet the 1% rule (rent ≥ 1% of price), the offer needs to be $156k (15.9% below list).
- Recommended offer: $156k (15.9% below list) — sets the bar for 1% rule.
- Cap rate 6.5% vs local median 2.2% in Killian — top-decile yield for the area; either an underpriced asset or a hidden risk that comps aren't pricing in. Stress-test before assuming the spread holds.
Location & tenants
- Location reads 57/100 on livability (#333 in LA) — a working-class tenant base; expect higher turnover. Strengths: crime A+, cost of living A+; Watch: health & safety C-, schools F, amenities F.
- Livingston Parish (suburban): math 40% / reading 52% proficiency, ranked #13 of 98 in LA (top 13%) — families likely to look elsewhere, expect single-tenant / working-renter base with shorter leases.
- Market conditions: 214 active listings in the ZIP; 794 units permitted in Livingston Parish in 2024 (99 in 5+ unit buildings).
Forward outlook
- In year one you build about $20k of equity ($1k loan paydown + $18k appreciation (10.0% local appreciation)).
- Livingston County population projected at +27% by 2050 — long-run rental-demand tailwind backs the buy-and-hold thesis.
- At projected returns (10.0% appreciation + 3.0% rent growth), your $52k cash investment doubles in ~3 years — after that, you're playing with house money.
- By year 2, paydown + projected appreciation supports a ~$32k cash-out refi (75% LTV) — recoverable capital for the next deal without selling this one.
Negotiation context
- It's been on market 31 days — a 3% lower offer ($179k) is reasonable based on typical stale-listing flexibility.
- 8 sale attempts since 19y ago with the ask held roughly flat each time — persistent listings suggest the price (not the market) is what's stuck; bring a comps-based counter.
- Current owner paid $155k; 19% above their basis — modest negotiation headroom, anchor on the comps not their cost.
Risks & watch-outs
- Climate carrying-cost: major flood risk; severe wind risk, 99% chance of damaging wind over 30y; extreme-heat days projected 7→21/yr by 2055 (HVAC capex compounding) — expect insurance premiums to compound above CPI over the hold.
Questions for the listing agent
- It's been on market 31 days. Have you received any prior offers? Is the seller open to a 16% concession, seller financing, or rate buy-down credit?
- What does the HOA fee cover, when was the last increase, and are there any pending special assessments or reserve-fund shortfalls?
- Is there a deadline driving the sale (1031 exchange, divorce, estate, relocation)? That informs how much negotiation room exists.
- Schools are F-rated, which usually means shorter tenancies and higher turnover. Who's the typical renter profile here, and what's been the actual vacancy rate?
- What's the average days-on-market for RENTAL listings here right now (not sales)? A rising rental-DOM trend means longer vacancies and softer asking-rent achievability than the comps imply.
- What's the recent tenant-quality profile in this submarket — average credit score on applications, eviction rate, late-payment / NSF rate, and stable-employment percentage? A property-management company in the area should have these aggregated.
- How much new for-sale + rental construction is in the pipeline within 1–3 miles? Heavy new supply typically softens prices + rents 12–24 months out; constrained supply supports both.
Investment metrics
- 1% rule
- 0.84% ✗
- Cap rate
- 6.46%
- Cash-on-cash
- 0.59%
- DSCR
- 1.03
- GRM
- 9.9
CMA / ARV
- ARV (on-the-fly)
- $227,010
- Comps found
- 6
Show comp detail 6 sales within ~0.75 mi
| Address | Dist | Beds/Ba | Sqft | Sold | Price | $/sf | Match |
|---|---|---|---|---|---|---|---|
| 26313 Indian Run | 0.06mi | 3/2.0 | 1,492 (+6%) | 5mo | $215,000 | $144 | 84 |
| TBD Riverscape Dr | 0.05mi | 3/2.0 | 1,302 (-8%) | 10mo | $219,000 | $168 | 77 |
| TBD Riverscape Dr | 0.05mi | 3/2.0 | 1,302 (-8%) | 10mo | $219,000 | $168 | 77 |
| 26205 Riverscape Dr | 0.28mi | 3/2.0 | 1,302 (-8%) | 10mo | $210,000 | $161 | 66 |
| 16698 Meisner Rd | 0.74mi | 3/2.0 | 1,350 (-4%) | 15mo | $208,000 | $154 | 46 |
| 16685 Meissner Rd | 0.75mi | 2/2.0 (-1) | 1,500 (+6%) | 10mo | $230,000 | $153 | 41 |
Match score weights: distance 35% · size 25% · config 20% · recency 20%. Top-matched comps best support the ARV.
Projected returns pro-forma
10.0% appreciation · 3.0% rent growth · sell at horizon
- IRR
- 24.7%
- Equity multiple
- 2.98×
- Total profit
- $102,359
- Equity at exit
- $166,663
- IRR
- 21.8%
- Equity multiple
- 6.79×
- Total profit
- $300,108
- Equity at exit
- $359,414
Cash invested: $51,800 (down + closing). Projections, not guarantees.
Landlord ↔ Tenant lean methodology
- Overall (STATE)
- 90 Strongly Landlord-Friendly
- State Louisiana
- 90 Strongly Landlord-Friendly · R+12
- County
- — inherits STATE
- City
- — inherits STATE
ZIP-level market 70462
- Active inventory
- 214
- Price-to-rent
- 9.9×
Monthly cashflow live
- Estimated rent
- $1,557 medium interval (Pro) →
- Mortgage (P&I)
- −$970
- Tax from tax record
- −$124 /mo · $1,488/yr
- Insurance
- −$77
- HOA
- −$33
- Vacancy / Maint / Mgmt
- −$327
- Net cashflow
- $26
Break-even live
UW: 25.0% down · 7.5% · 30yr · 1.5% tax · 5.0% vac · 8.0% maint · 8.0% mgmt
Financing live
Cash to close
- Down payment
- $46,250
- Closing costs
- $5,550
- Reserves months
- —
- Total cash needed
- —
Loan-product check · same deal, 3 products live
Conventional
25% down · 7.5% · 30yr
- Down + closing
- —
- Monthly P&I
- —
- Monthly cashflow
- —
- DSCR
- —
- Eligible?
- —
Personal DTI + credit; lowest rate.
DSCR
20% down · 8.5% · 30yr
- Down + closing
- —
- Monthly P&I
- —
- Monthly cashflow
- —
- DSCR
- —
- Eligible?
- —
No personal income docs; deal must DSCR.
Hard money
10% down · 12.0% · 12mo
- Down + closing
- —
- Monthly P&I
- —
- Monthly cashflow
- —
- DSCR
- —
- Eligible?
- —
Short-term bridge; refi at stabilization.
HOA detail
- Monthly dues
- $33 · $396/yr
- Likely covers
- waterpool
Listing history 28 events
-
2026-06-18days on market $185,000 Active 31 DOM
-
2026-06-17days on market $185,000 Active 30 DOM
-
2026-06-16days on market $185,000 Active 29 DOM
-
2026-06-15days on market $185,000 Active 28 DOM
-
2026-06-14days on market $185,000 Active 26 DOM
-
2026-06-13days on market $185,000 Active 25 DOM
-
2026-06-10days on market $185,000 Active 23 DOM
-
2026-06-09days on market $185,000 Active 22 DOM
-
2026-06-08days on market $185,000 Active 21 DOM
-
2026-06-07days on market $185,000 Active 20 DOM
-
2026-06-03days on market $185,000 Active 16 DOM
-
2026-06-02days on market $185,000 Active 15 DOM
-
2026-06-01days on market $185,000 Active 14 DOM
-
2026-05-31days on market $185,000 Active 13 DOM
-
2026-05-31days on market $185,000 Active 12 DOM
-
2026-05-18$185,000 Active 443-char remark
Show marketing remark (443 chars)
If you are looking for your own water access to Blind River or the Lake, this is it! This 3 bed 2 bath cottage/camp style home is for you. Not to mention having a community pool for long summer days, you have your own community dock to slip right in for fishing or fun. Sitting on an oversized lot, this property is awaiting its next set of owners. That is not all, FLOOD ZONE X. Priced to sell and going on the market just in time for summer.
-
2026-05-18$185,000 Active
Show marketing remark (443 chars)
If you are looking for your own water access to Blind River or the Lake, this is it! This 3 bed 2 bath cottage/camp style home is for you. Not to mention having a community pool for long summer days, you have your own community dock to slip right in for fishing or fun. Sitting on an oversized lot, this property is awaiting its next set of owners. That is not all, FLOOD ZONE X. Priced to sell and going on the market just in time for summer.
-
2018-09-04soldstatus $155,000
-
2018-08-31soldstatus $155,000 Sold
-
2018-07-26historical Pending Continue to Show
-
2018-06-27$155,000 Active
-
2018-06-27$155,000
-
2009-12-21soldstatus
-
2009-12-18soldstatus
-
2009-05-29$99,900
-
2009-05-29$99,900
-
2007-07-02$115,900
-
2007-07-02$115,900
ⓘ Source: listings_history table (triggers on properties + properties_extension) + one-shot
backfill from property_details.listing_events for pre-trigger history.
Tax reassessment forecast LA · Resets to sale price
- Current annual tax
- $1,488 · $124/mo
- Projected year-2 tax
- $1,488 · $124/mo
- Expected delta
- $0/yr ($0/mo · 0.0%)
ⓘ Screening estimate from a state-policy table — verify with the county assessor before closing.
Climate risk First Street
- Flood 6/10 Major FEMA zone X (unshaded) · 75% chance over 30 yrs
- Wildfire 2/10 Low
- Heat 8/10 Severe 7 d/yr ≥108°F today · 21 d/yr by 30 yrs out
- Wind 9/10 Extreme 99% chance of damaging wind over 30 yrs
- Air quality 2/10 Low 1 unhealthy d/yr today · 1 by 30 yrs out
Nearby sold comps map
Loading sold comps map…
Walkable amenities ~0.75 mi
Loading nearby amenities…
Taxation est. · year 1
- Rental income
- $18,680
- − Mortgage interest
- −$10,363
- − Property taxes
- −$1,488
- − Insurance
- −$925
- − Repairs & maintenance
- −$1,494
- − Management
- −$1,494
- − HOA
- −$396
- − Depreciation
- −$5,382
- Taxable loss
- −$2,863
- Est. tax savings @ 24.0%
- +$687
- After-tax cash flow
- $993/yr
For passive investors: Depreciation is non-cash, so a rental often shows a tax loss while cash-flowing — sheltering income. Rental losses are passive: they offset passive income freely, and up to $25,000/yr can offset ordinary (W-2) income if you actively participate and your MAGI is under $100k (phasing out to $0 by $150k); unused losses carry forward. On sale, claimed depreciation is recaptured at up to 25%, and gains may owe capital-gains tax (a 1031 exchange can defer both). Figures are a year-1 estimate at your 24.0% rate — not tax advice; consult a CPA.
Schools (NCES district)
- District
- Livingston Parish
- NCES district ID
- 2201020
- Math proficiency
- 40% ▼ -38.00%
- Reading proficiency
- 52% ▼ -32.00%
- Median HH income
- $56,755
- Composite
- 40.07/100
- National rank
- #3811
- State rank
- #13 of 98 in LA
Livability — Killian
- Score
- 57/100
- State rank
- #333
- US rank
- #22333
Category grades
Schools grade is shown separately in the Schools card above.
Census & demographics
- Population (ZIP)
- 5,428
Population outlook (Livingston County) Hauer SSP2
- Today (2025)
- 158,511 people
- By 2030
- 168,241 · +6.1%
- By 2040
- 186,252 · +17.5%
- By 2050
- 201,516 · +27.1%
- By 2075
- 231,217 · +45.9%
- By 2100
- 241,697 · +52.5%
Race, ethnicity, and origin ACS 2023
- Neighborhood character
- Predominantly White (83%)
- Race & ethnicity
- White 83% Black 9% Two or more races 4% Hispanic / Latino 3% Asian 2%
- Common ancestry
- Lithuanian 15% Slovak 2%
- Foreign-born
- 1% · Canada
- Languages at home
- 98% English-only · Spanish 2%
Political lean MEDSL · Livingston
- 2024 margin
- Solid R (+68.5) · D 15.1% · R 83.6% · Other 1.3%
- 2008→2024 swing
- +3.4pp toward D · 2008: -71.9pp · 2024: -68.5pp
- All cycles
- 2024: R+68.5 2020: R+70.0 2016: R+72.5 2012: R+70.4 2008: R+71.9
Not yet ingested
- Civics
- —
Market trends
- HPI YoY
- ▲ 115.93%
- Current HPI
- 389.85
- Rent YoY
- —
- Metro
- —
- State GDP YoY
- ▲ 3.29%
- F500 in state
- 10
Industry mix (Fortune 500 HQ in LA)
| Industry | F500 HQs | Revenue |
|---|---|---|
| Telecommunications | 2 | $23B |
|
||
| Utilities | 1 | $12B |
|
||
| Wholesale / Distribution | 1 | $5B |
|
||
| Advertising | 1 | $2B |
|
||
Price history
+59.6% since first listed13 events — show timeline
- 2026-05-18 Listed $185,000 GSREIN
- 2026-05-18 Listed $185,000 AcadianaMLS
- 2018-09-04 Sold (Public Records) $155,000 Public Records
- 2018-08-31 Sold (MLS) $155,000 GSREIN
- 2018-07-26 Contingent — GSREIN
- 2018-06-27 Listed $155,000 AcadianaMLS
- 2018-06-27 Listed $155,000 GSREIN
- 2009-12-21 Sold (Public Records) — Public Records
- 2009-12-18 Sold (MLS) — GBRMLS
- 2009-05-29 Listed $99,900 AcadianaMLS
- 2009-05-29 Listed $99,900 GBRMLS
- 2007-07-02 Listed $115,900 AcadianaMLS
- 2007-07-02 Listed $115,900 GBRMLS
Property tax history
+3.3%/yrLatest (2024): $1,488 · +28.8% YoY. Source: county tax records.
Cash-flow waterfall
monthlySold comps — $/sqft
last 12 mo · ≤1 miLoading sold comps…