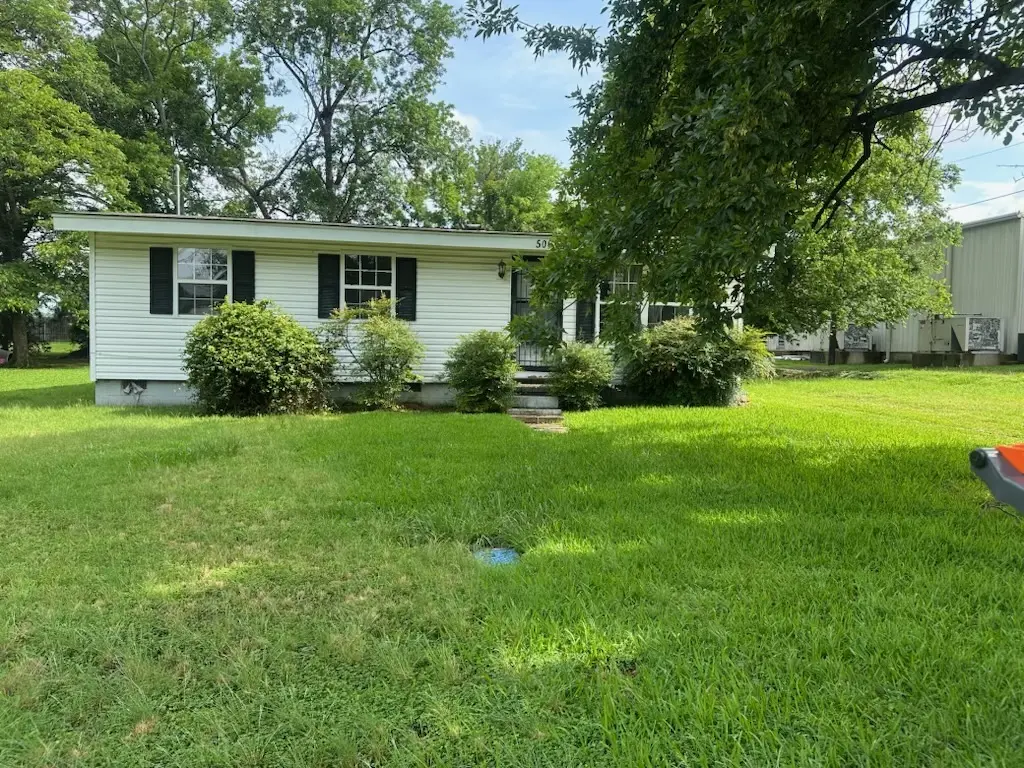
506 W K St · Russellville, AR
Flood risk 3/10 · Minor
- FEMA flood zone
- X
- Chance of flooding over 30 yrs
- 0.2%
- Est. flood insurance / yr
- $507 – $1,088
Fire risk 4/10 · Minor
- Est. fire insurance / yr
- $1,499 – $2,785
Heat risk 7/10 · Major
- Hot days now (above 112°F)
- 7 days/yr
- Hot days in 30 yrs
- 19 days/yr
Wind risk 2/10 · Minimal
- Chance of severe wind over 30 yrs
- 2.0%
Air-quality risk 1/10 · Minimal
- Unhealthy air days now
- 0 days/yr
- Unhealthy air days in 30 yrs
- 0 days/yr
Risk factors via First Street. Map © Google.
Why this score? — see what drove the C+ grade
The composite is a weighted blend of 9 inputs, each scored 0–100. Each bar is that input's sub-score; the figure is the points it added to the 100-point composite (weight × sub-score).
- Cash flow +21.7/30.0
- ARV discount +15.0/15.0
- DSCR +6.9/10.0
- 1% rule +4.3/10.0
- Rent growth +4.0/5.0
- Livability +3.9/5.0
- Schools +3.8/10.0
- Condition / age +2.5/5.0
- Appreciation +0.0/10.0
$115,000
🖨 Deal sheet 📄 Offer letter ✓ Due diligence
Listing remarks
Calling all investors! This 1,224 square foot home offers 3 bedrooms, 1.5 bathrooms, and sits on a spacious double lot in a prime location near Arkansas Tech University. Whether you're looking for your next rental property, fix-and-flip project, or addition to your investment portfolio, this property presents a great opportunity with plenty of potential. Conveniently located close to shopping, dining, and campus amenities, the possibilities are endless. Property is being sold AS-IS, WHERE-IS with no repairs to be made by the seller. Don't miss your chance to turn this investment opportunity into your next success story. Schedule your showing today!
Key facts
- Double lot
- Close to dining
- Prime location
Tags
Property features AI
Finance
- HOA & community: Monthly association fee; Located near schools
Exterior
- Parking: Shared road frontage (access)
- Utilities: Electricity available; Natural gas available; Public water; Public sewer
- Home design: Single-story; Crawlspace foundation
- Construction: Vinyl siding; Asphalt shingle roof; Crawl space foundation; Built with vinyl siding
- Exterior features: Cleared lot; Unpaved driveway; Porch
Interior
- Kitchen: Dishwasher; Electric range
- Flooring: Carpet; Vinyl
- Bathrooms: 1 full bathroom; 1 half bathroom
- Heating & cooling: Central heating (gas); Central electric cooling
- Interior features: Carpet and vinyl flooring; No additional interior features listed
- Laundry & utility: Electric water heater
Neighborhood map
What this means for you Summary
Snapshot
- This is a 3-bed/1.0-bath single-family listed at $115k.
Deal economics
- At list price, monthly cash flow is $177 ($2k/yr) — positive.
- The deal already cash-flows at list — no discount required.
- To meet the 1% rule (rent ≥ 1% of price), the offer needs to be $107k (6.7% below list).
- Recommended offer: $107k (6.7% below list) — sets the bar for 1% rule.
- Cap rate 8.1% vs local median 3.5% in Russellville — top-decile yield for the area; either an underpriced asset or a hidden risk that comps aren't pricing in. Stress-test before assuming the spread holds.
Location & tenants
- Location reads 77/100 on livability (#10 in AR, #3,049 nationally) — a middle-class / working-renter tenant base. Strengths: amenities A+, cost of living A+, health & safety A+; Watch: commute F, employment F.
- Russellville School District (town): math 46% / reading 45% proficiency, ranked #38 of 238 in AR (top 16%) — families likely to look elsewhere, expect single-tenant / working-renter base with shorter leases.
- Market conditions: Rents rising fast (+6.1%/yr); 93 active listings in the ZIP; 1 comparable units currently listed for rent nearby; 55 units permitted in Pope County in 2024 (0 in 5+ unit buildings).
Forward outlook
- Local home prices are declining (-3.0%/yr); year-one equity from $795 of loan paydown is wiped out by about $3k of value loss. Plan a longer hold.
- Pope County population projected at +9% by 2050 — modest demand growth; plan on rents tracking national, not racing it.
- At projected returns (-3.0% appreciation + 6.1% rent growth), your $32k cash investment doubles in ~10 years — after that, you're playing with house money.
Negotiation context
- Only 4 days on market — expect competitive offers; lowballing is unlikely to land.
Risks & watch-outs
- Climate carrying-cost: extreme-heat days projected 7→19/yr by 2055 (HVAC capex compounding) — expect insurance premiums to compound above CPI over the hold.
Questions for the listing agent
- Built in 1963 — when were the roof, HVAC, electrical panel, plumbing, and water heater last replaced?
- Is there a deadline driving the sale (1031 exchange, divorce, estate, relocation)? That informs how much negotiation room exists.
- Schools are B-rated — typically a magnet for longer-tenancy family renters. What's the average tenant stay here, and is there a school-zone premium baked into asking?
- What's the average days-on-market for RENTAL listings here right now (not sales)? A rising rental-DOM trend means longer vacancies and softer asking-rent achievability than the comps imply.
- What's the recent tenant-quality profile in this submarket — average credit score on applications, eviction rate, late-payment / NSF rate, and stable-employment percentage? A property-management company in the area should have these aggregated.
- How much new for-sale + rental construction is in the pipeline within 1–3 miles? Heavy new supply typically softens prices + rents 12–24 months out; constrained supply supports both.
Investment metrics
- 1% rule
- 0.93% ✗
- Cap rate
- 8.14%
- Cash-on-cash
- 6.59%
- DSCR
- 1.29
- GRM
- 8.9
CMA / ARV
- ARV (on-the-fly)
- $143,208
- Comps found
- 12
Show comp detail 12 sales within ~0.75 mi
| Address | Dist | Beds/Ba | Sqft | Sold | Price | $/sf | Match |
|---|---|---|---|---|---|---|---|
| 1300 N Boston Ave | 0.32mi | 3/1.0 | 1,250 (+2%) | 0mo | $158,550 | $127 | 81 |
| 1126 N Detroit Ave | 0.46mi | 3/2.0 | 1,196 (-2%) | 1mo | $105,000 | $88 | 70 |
| 1219 N Boston Pl | 0.34mi | 3/2.0 | 1,168 (-5%) | 6mo | $173,040 | $148 | 68 |
| 418 E J St | 0.51mi | 3/2.5 | 1,192 (-3%) | 2mo | $140,000 | $117 | 64 |
| 211 E J St | 0.31mi | 3/2.0 | 1,308 (+7%) | 8mo | $140,000 | $107 | 63 |
| 201 E H St | 0.37mi | 2/2.0 (-1) | 1,162 (-5%) | 3mo | $130,000 | $112 | 63 |
| 1309 N Erie Ave | 0.53mi | 3/2.0 | 1,144 (-6%) | 3mo | $139,500 | $122 | 58 |
| 1115 N Hartford Ave | 0.71mi | 2/1.0 (-1) | 1,187 (-3%) | 4mo | $58,000 | $49 | 54 |
| 418 E L St | 0.51mi | 3/1.0 | 1,096 (-10%) | 7mo | $124,500 | $114 | 53 |
| 510 E O St | 0.57mi | 3/2.0 | 1,328 (+8%) | 4mo | $165,000 | $124 | 52 |
| 603 N Greenwich Ave | 0.72mi | 2/1.0 (-1) | 1,196 (-2%) | 8mo | $80,000 | $67 | 51 |
| 421 E F St | 0.61mi | 3/2.0 | 1,092 (-11%) | 7mo | $144,900 | $133 | 44 |
Match score weights: distance 35% · size 25% · config 20% · recency 20%. Top-matched comps best support the ARV.
Projected returns pro-forma
-3.0% appreciation · 6.13% rent growth · sell at horizon
- IRR
- -3.2%
- Equity multiple
- 0.88×
- Total profit
- $-3,952
- Equity at exit
- $17,147
- IRR
- 9.4%
- Equity multiple
- 1.81×
- Total profit
- $26,056
- Equity at exit
- $9,943
Cash invested: $32,200 (down + closing). Projections, not guarantees.
Landlord ↔ Tenant lean methodology
- Overall (STATE)
- 92 Strongly Landlord-Friendly
- State Arkansas
- 92 Strongly Landlord-Friendly · R+14
- County
- — inherits STATE
- City
- — inherits STATE
ZIP-level market 72801
- Home prices YoY
- -24.5%
- Rents YoY
- 6.1%
- Active inventory
- 93
- Price-to-rent
- 8.9×
Monthly cashflow live
- Estimated rent
- $1,072 medium interval (Pro) →
- Mortgage (P&I)
- −$603
- Tax from tax record
- −$19 /mo · $233/yr
- Insurance
- −$48
- HOA
- −$0
- Vacancy / Maint / Mgmt
- −$225
- Net cashflow
- $177
Break-even live
UW: 25.0% down · 7.5% · 30yr · 1.5% tax · 5.0% vac · 8.0% maint · 8.0% mgmt
Financing live
Cash to close
- Down payment
- $28,750
- Closing costs
- $3,450
- Reserves months
- —
- Total cash needed
- —
Loan-product check · same deal, 3 products live
Conventional
25% down · 7.5% · 30yr
- Down + closing
- —
- Monthly P&I
- —
- Monthly cashflow
- —
- DSCR
- —
- Eligible?
- —
Personal DTI + credit; lowest rate.
DSCR
20% down · 8.5% · 30yr
- Down + closing
- —
- Monthly P&I
- —
- Monthly cashflow
- —
- DSCR
- —
- Eligible?
- —
No personal income docs; deal must DSCR.
Hard money
10% down · 12.0% · 12mo
- Down + closing
- —
- Monthly P&I
- —
- Monthly cashflow
- —
- DSCR
- —
- Eligible?
- —
Short-term bridge; refi at stabilization.
Rent comps 1 comps
| Address | Beds | Baths | Sqft | Rent | $/sqft | DOM | Units | Dist |
|---|---|---|---|---|---|---|---|---|
| 922 N Sidney Ave Russellville, AR | 1.0–2.0 | 1.0–2.0 | 762 | $910 | $1.19 | 43d | 1 | 1.44mi |
Listing history 4 events
-
2026-06-12statusdays on market $115,000 Pending 4 DOM
-
2026-06-09days on market $115,000 Active 2 DOM
-
2026-06-08remarks 656-char remark
-
2026-06-08$115,000 Active 1 DOM
ⓘ Source: listings_history table (triggers on properties + properties_extension) + one-shot
backfill from property_details.listing_events for pre-trigger history.
Tax reassessment forecast AR · Resets to sale price
- Current annual tax
- $233 · $19/mo
- Projected year-2 tax
- $736 · $61/mo
- Expected delta
- +$503/yr (+$42/mo · 216.1%)
ⓘ Screening estimate from a state-policy table — verify with the county assessor before closing.
Climate risk First Street
- Flood 3/10 Moderate FEMA zone X · 20% chance over 30 yrs
- Wildfire 4/10 Moderate
- Heat 7/10 Severe 7 d/yr ≥112°F today · 19 d/yr by 30 yrs out
- Wind 2/10 Low 2% chance of damaging wind over 30 yrs
- Air quality 1/10 Low 0 unhealthy d/yr today · 0 by 30 yrs out
Nearby sold comps map
Loading sold comps map…
Walkable amenities ~0.75 mi
Loading nearby amenities…
Taxation est. · year 1
- Rental income
- $12,869
- − Mortgage interest
- −$6,442
- − Property taxes
- −$233
- − Insurance
- −$575
- − Repairs & maintenance
- −$1,029
- − Management
- −$1,029
- − Depreciation
- −$3,345
- Taxable income
- $215
- Est. tax owed @ 24.0%
- −$52
- After-tax cash flow
- $2,070/yr
For passive investors: Depreciation is non-cash, so a rental often shows a tax loss while cash-flowing — sheltering income. Rental losses are passive: they offset passive income freely, and up to $25,000/yr can offset ordinary (W-2) income if you actively participate and your MAGI is under $100k (phasing out to $0 by $150k); unused losses carry forward. On sale, claimed depreciation is recaptured at up to 25%, and gains may owe capital-gains tax (a 1031 exchange can defer both). Figures are a year-1 estimate at your 24.0% rate — not tax advice; consult a CPA.
Schools (NCES district)
- District
- Russellville School District
- NCES district ID
- 0512060
- Math proficiency
- 46% ▼ -10.00%
- Reading proficiency
- 45% ▼ -9.00%
- Median HH income
- $38,619
- Composite
- 37.98/100
- National rank
- #4293
- State rank
- #38 of 238 in AR
Livability — Russellville
- Score
- 77/100
- State rank
- #10
- US rank
- #3049
Category grades
Schools grade is shown separately in the Schools card above.
Census & demographics
- Census place
- Russellville, AR
- County
- Pope County · 42,302 people
- City population
- 42,302
- Metro
- Russellville, AR
- Population (ZIP)
- 19,019
- Household income
- $47,830
- Rent vs Own
- Severe rent burden
- 665.0
Population outlook (Pope County) Hauer SSP2
- Today (2025)
- 66,303 people
- By 2030
- 67,635 · +2.0%
- By 2040
- 70,046 · +5.6%
- By 2050
- 72,107 · +8.8%
- By 2075
- 78,042 · +17.7%
- By 2100
- 82,343 · +24.2%
Race, ethnicity, and origin ACS 2023
- Neighborhood character
- Predominantly White (68%)
- Race & ethnicity
- White 68% Hispanic / Latino 18% Two or more races 10% Black 4% Native American 3% Asian 3%
- Hispanic origin (detail)
- Mexican 11%
- Common ancestry
- Slovak 2% Lithuanian 1% Serbian 1%
- Foreign-born
- 10% · Canada, China, Vietnam
- Languages at home
- 84% English-only · Spanish 13% Chinese 1% Vietnamese 1%
Political lean MEDSL · Pope
- 2024 margin
- Solid R (+52.2) · D 22.7% · R 74.9% · Other 2.4%
- 2008→2024 swing
- -8.9pp toward R · 2008: -43.3pp · 2024: -52.2pp
- All cycles
- 2024: R+52.2 2020: R+50.4 2016: R+50.5 2012: R+47.2 2008: R+43.3
Not yet ingested
- Civics
- —
Market trends
- HPI YoY
- ▼ -72.65%
- Current HPI
- 223.7613
- Rent YoY
- ▲ 6.13%
- Metro
- Russellville, AR
- State GDP YoY
- ▲ 3.80%
- F500 in state
- 10
Industry mix (Fortune 500 HQ in AR)
| Industry | F500 HQs | Revenue |
|---|---|---|
| Retail | 1 | $681B |
|
||
| Food / Agriculture | 1 | $53B |
|
||
| Retail / Energy | 1 | $22B |
|
||
| Transportation / Logistics | 1 | $12B |
|
||
| Energy | 1 | $4B |
|
||
Price history
1 event — show timeline
- 2026-06-07 Listed $115,000 NWARMLS
Property tax history
+0.0%/yrLatest (2022): $233 · +0.0% YoY. Source: county tax records.
Cash-flow waterfall
monthlySold comps — $/sqft
last 12 mo · ≤1 miLoading sold comps…