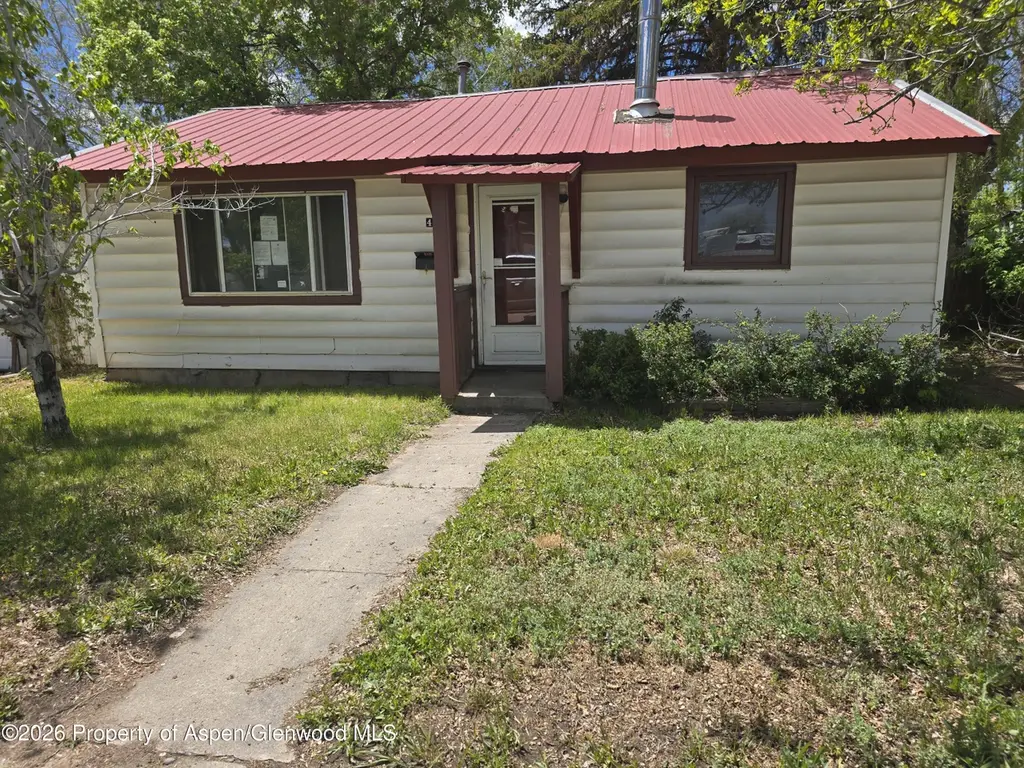
430 School St · Craig, CO
Flood risk 7/10 · Major
- FEMA flood zone
- X (shaded)
- Chance of flooding over 30 yrs
- 0.91%
- Est. flood insurance / yr
- $507 – $1,088
Fire risk 5/10 · Moderate
- Est. fire insurance / yr
- $939 – $1,743
Heat risk 3/10 · Minor
- Hot days now (above 88°F)
- 6 days/yr
- Hot days in 30 yrs
- 15 days/yr
Wind risk 1/10 · Minimal
- Chance of severe wind over 30 yrs
- —
Air-quality risk 1/10 · Minimal
- Unhealthy air days now
- 0 days/yr
- Unhealthy air days in 30 yrs
- 0 days/yr
Risk factors via First Street. Map © Google.
Why this score? — see what drove the B grade
The composite is a weighted blend of 9 inputs, each scored 0–100. Each bar is that input's sub-score; the figure is the points it added to the 100-point composite (weight × sub-score).
- Cash flow +29.9/30.0
- ARV discount +12.8/15.0
- DSCR +10.0/10.0
- 1% rule +7.6/10.0
- Livability +3.2/5.0
- Rent growth +2.5/5.0
- Schools +2.5/10.0
- Condition / age +2.5/5.0
- Appreciation +0.0/10.0
$92,000
🖨 Deal sheet (PDF) 📄 Offer letter ✓ Due diligence
Listing remarks MLS
Great 2 bed, 1 bath cottage with a huge fenced back yard right in the heart of downtown Craig. 2 block walk to main street! The covered back porch is wonderful in the summer, and there is so much you can do with all of the yard space. This is a wonderful place to start, or if you are looking to get into the rental market - this is it! Home might go FHA, so call and we can talk about it. Call your favorite Realtor today to take a look!
Key facts
- 6,250 sq ft lot
- Built 1945
- Listed 13 days
Property features AI
Finance
- Other: Located in the Craig subdivision; Directions: School Street
- Financial info: Tax year 2025 — annual tax amount approximately $666.12
Exterior
- Parking: No designated parking
- Home design: Single family residence
- Exterior features: Metal roof; Lot approximately 0.14 acres
Interior
- Kitchen: Refrigerator included
- Bathrooms: 1 full bathroom
- Heating & cooling: Wood stove; Forced air heating
- Interior features: Wood stove; Forced air heating; Wood-burning fireplace (1)
Neighborhood map
What this means for you Summary
Snapshot
- This is a 2-bed/1.0-bath single-family listed at $92k.
Deal economics
- At list price, monthly cash flow is $275 ($3k/yr) — positive.
- The deal already cash-flows at list — no discount required.
- Meets the 1% rule at list price ($1k rent vs $92k).
- Cap rate 10.7% vs local median 3.2% in Craig — top-decile yield for the area; either an underpriced asset or a hidden risk that comps aren't pricing in. Stress-test before assuming the spread holds.
Location & tenants
- Location reads 65/100 on livability (#160 in CO) — a middle-class / working-renter tenant base. Strengths: commute A+, housing A+, cost of living A; Watch: employment C-, schools D, crime D.
- Moffat County School District Re: No. 1 (town): math 22% / reading 35% proficiency, ranked #53 of 86 in CO (top 62%) — low school quality limits family demand, transient renter base, plan for 1-2y turnover.
- Market conditions: 188 active listings in the ZIP; 18 units permitted in Moffat County in 2024 (0 in 5+ unit buildings).
Forward outlook
- Local home prices are declining (-3.0%/yr); year-one equity from $636 of loan paydown is wiped out by about $3k of value loss. Plan a longer hold.
- Moffat County population projected at -41% by 2050 — secular population decline; favor cash flow + early exit over multi-decade hold.
- At projected returns (-3.0% appreciation + 3.0% rent growth), your $26k cash investment doubles in ~9 years — after that, you're playing with house money.
Negotiation context
- Only 14 days on market — expect competitive offers; lowballing is unlikely to land.
- 2 sale attempts since 3y ago with the ask held roughly flat each time — persistent listings suggest the price (not the market) is what's stuck; bring a comps-based counter.
Risks & watch-outs
- Watch-outs: flood insurance adds $66/mo; built in 1945 — expect roof / HVAC / electrical / plumbing capex.
- Climate carrying-cost: major flood risk; moderate wildfire risk — expect insurance premiums to compound above CPI over the hold.
Questions for the listing agent
- Built in 1945 — when were the roof, HVAC, electrical panel, plumbing, and water heater last replaced?
- What's the actual annual flood-insurance premium (NFIP or private), and is the property in a SFHA with mandatory coverage?
- Is there a deadline driving the sale (1031 exchange, divorce, estate, relocation)? That informs how much negotiation room exists.
- Schools are D-rated, which usually means shorter tenancies and higher turnover. Who's the typical renter profile here, and what's been the actual vacancy rate?
- Crime grade is D in this area — have there been break-ins, vandalism, or insurance claims at this property in the last 3 years? What carrier currently insures it and at what premium?
- What's the average days-on-market for RENTAL listings here right now (not sales)? A rising rental-DOM trend means longer vacancies and softer asking-rent achievability than the comps imply.
- What's the recent tenant-quality profile in this submarket — average credit score on applications, eviction rate, late-payment / NSF rate, and stable-employment percentage? A property-management company in the area should have these aggregated.
- How much new for-sale + rental construction is in the pipeline within 1–3 miles? Heavy new supply typically softens prices + rents 12–24 months out; constrained supply supports both.
Investment metrics
- 1% rule
- 1.26% ✓
- Cap rate
- 10.74%
- Cash-on-cash
- 15.89%
- DSCR
- 1.71
- GRM
- 6.6
CMA / ARV
- ARV (on-the-fly)
- $104,320
- Comps found
- 1
Show comp detail 1 sale within ~0.75 mi
| Address | Dist | Beds/Ba | Sqft | Sold | Price | $/sf | Match |
|---|---|---|---|---|---|---|---|
| 544 Legion St | 0.59mi | 2/1.0 | 700 (+9%) | 19mo | $113,900 | $163 | 41 |
Match score weights: distance 35% · size 25% · config 20% · recency 20%. Top-matched comps best support the ARV.
Projected returns pro-forma
-3.0% appreciation · 3.0% rent growth · sell at horizon
- IRR
- 2.6%
- Equity multiple
- 1.10×
- Total profit
- $2,610
- Equity at exit
- $13,717
- IRR
- 12.2%
- Equity multiple
- 1.97×
- Total profit
- $24,890
- Equity at exit
- $7,954
Cash invested: $25,760 (down + closing). Projections, not guarantees.
Landlord ↔ Tenant lean methodology
- Overall (STATE)
- 38 Tenant-Leaning
- State Colorado
- 38 Tenant-Leaning · D+4
- County
- — inherits STATE
- City
- — inherits STATE
ZIP-level market 81625
- Home prices YoY
- -25.2%
- Active inventory
- 188
- Price-to-rent
- 6.6×
Monthly cashflow live
- Estimated rent
- $1,161 medium interval (Pro) →
- Mortgage (P&I)
- −$482
- Tax from tax record
- −$56 /mo · $666/yr
- Insurance
- −$38
- Flood insurance flood zone
- −$66 /mo · $798/yr
- HOA
- −$0
- Vacancy / Maint / Mgmt
- −$244
- Net cashflow
- $275
Break-even live
Sensitivity live
| Price | -10% $327 | -5% $301 | +0% $275 | +5% $249 | +10% $223 |
|---|---|---|---|---|---|
| Rent | -10% $183 | -5% $229 | +0% $275 | +5% $321 | +10% $366 |
| Rate | -1.0pp $321 | -0.5pp $298 | base $275 | +0.5pp $251 | +1.0pp $227 |
UW: 25.0% down · 7.5% · 30yr · 1.5% tax · 5.0% vac · 8.0% maint · 8.0% mgmt
Financing live
Cash to close
- Down payment
- $23,000
- Closing costs
- $2,760
- Reserves months
- —
- Total cash needed
- —
Loan-product check · same deal, 3 products live
Conventional
25% down · 7.5% · 30yr
- Down + closing
- —
- Monthly P&I
- —
- Monthly cashflow
- —
- DSCR
- —
- Eligible?
- —
Personal DTI + credit; lowest rate.
DSCR
20% down · 8.5% · 30yr
- Down + closing
- —
- Monthly P&I
- —
- Monthly cashflow
- —
- DSCR
- —
- Eligible?
- —
No personal income docs; deal must DSCR.
Hard money
10% down · 12.0% · 12mo
- Down + closing
- —
- Monthly P&I
- —
- Monthly cashflow
- —
- DSCR
- —
- Eligible?
- —
Short-term bridge; refi at stabilization.
Listing history 11 events
-
2026-06-19days on market $92,000 Active 14 DOM
-
2026-06-18days on market $92,000 Active 13 DOM
-
2026-06-17days on market $92,000 Active 12 DOM
-
2026-06-16days on market $92,000 Active 11 DOM
-
2026-06-15days on market $92,000 Active 10 DOM
-
2026-06-14days on market $92,000 Active 8 DOM
-
2026-06-12days on market $92,000 Active 7 DOM
-
2026-06-09days on market $92,000 Active 4 DOM
-
2026-06-08days on market $92,000 Active 3 DOM
-
2026-06-07remarks 396-char remark
-
2026-06-07$92,000 Active 2 DOM
ⓘ Source: listings_history table (triggers on properties + properties_extension) + one-shot
backfill from property_details.listing_events for pre-trigger history.
Tax reassessment forecast CO · Resets to sale price
- Current annual tax
- $666 · $56/mo
- Projected year-2 tax
- $666 · $56/mo
- Expected delta
- $0/yr ($0/mo · 0.0%)
ⓘ Screening estimate from a state-policy table — verify with the county assessor before closing.
Climate risk First Street
- Flood 7/10 Severe FEMA zone X (shaded) · 91% chance over 30 yrs
- Wildfire 5/10 Major
- Heat 3/10 Moderate 6 d/yr ≥88°F today · 15 d/yr by 30 yrs out
- Wind 1/10 Low
- Air quality 1/10 Low 0 unhealthy d/yr today · 0 by 30 yrs out
Nearby sold comps map
Loading sold comps map…
Walkable amenities ~0.75 mi
Loading nearby amenities…
Taxation est. · year 1
- Rental income
- $13,936
- − Mortgage interest
- −$5,153
- − Property taxes
- −$666
- − Insurance
- −$1,258
- − Repairs & maintenance
- −$1,115
- − Management
- −$1,115
- − Depreciation
- −$2,676
- Taxable income
- $1,953
- Est. tax owed @ 24.0%
- −$469
- After-tax cash flow
- $2,828/yr
For passive investors: Depreciation is non-cash, so a rental often shows a tax loss while cash-flowing — sheltering income. Rental losses are passive: they offset passive income freely, and up to $25,000/yr can offset ordinary (W-2) income if you actively participate and your MAGI is under $100k (phasing out to $0 by $150k); unused losses carry forward. On sale, claimed depreciation is recaptured at up to 25%, and gains may owe capital-gains tax (a 1031 exchange can defer both). Figures are a year-1 estimate at your 24.0% rate — not tax advice; consult a CPA.
Schools (NCES district)
- District
- Moffat County School District Re: No. 1
- NCES district ID
- 0805730
- Math proficiency
- 22% ▲ 3.00%
- Reading proficiency
- 35% ▼ -3.00%
- Median HH income
- $51,633
- Composite
- 25.07/100
- National rank
- #7539
- State rank
- #53 of 86 in CO
Livability — Craig
- Score
- 65/100
- State rank
- #160
- US rank
- #12817
Category grades
Schools grade is shown separately in the Schools card above.
Census & demographics
- Census place
- Craig, CO
- Population (ZIP)
- 12,242
Population outlook (Moffat County) Hauer SSP2
- Today (2025)
- 10,901 people
- By 2030
- 9,922 · -9.0%
- By 2040
- 8,081 · -25.9%
- By 2050
- 6,460 · -40.7%
- By 2075
- 3,896 · -64.3%
- By 2100
- 2,620 · -76.0%
Race, ethnicity, and origin ACS 2023
- Neighborhood character
- Predominantly White (79%)
- Race & ethnicity
- White 79% Hispanic / Latino 14% Two or more races 10%
- Hispanic origin (detail)
- Mexican 11%
- Common ancestry
- Slovak 4% Italian 3% Portuguese 2%
- Foreign-born
- 5% · Canada
- Languages at home
- 89% English-only · Spanish 9%
Political lean MEDSL · Moffat
- 2024 margin
- Solid R (+62.8) · D 17.5% · R 80.3% · Other 2.2%
- 2008→2024 swing
- -19.4pp toward R · 2008: -43.5pp · 2024: -62.8pp
- All cycles
- 2024: R+62.8 2020: R+63.6 2016: R+67.9 2012: R+55.0 2008: R+43.5
Not yet ingested
- Civics
- —
Market trends
- HPI YoY
- ▼ -96.11%
- Current HPI
- 284.444
- Rent YoY
- —
- Metro
- —
- State GDP YoY
- ▲ 1.95%
- F500 in state
- 14
Industry mix (Fortune 500 HQ in CO)
| Industry | F500 HQs | Revenue |
|---|---|---|
| Technology Distribution | 1 | $31B |
|
||
| Food / Agriculture | 1 | $18B |
|
||
| Packaging | 1 | $14B |
|
||
| Healthcare | 1 | $13B |
|
||
| Energy | 1 | $10B |
|
||
| Technology | 1 | $4B |
|
||
Price history
+53.6% since first listed10 events — show timeline
- 2026-06-05 Listed $92,000 AGMLS
- 2023-07-19 Sold (Public Records) $150,000 Public Records
- 2023-07-19 Sold (MLS) $150,000 AGMLS
- 2023-05-11 Pending — AGMLS
- 2023-03-16 Price Changed $170,000 AGMLS
- 2023-02-27 Listed $185,000 AGMLS
- 2020-12-07 Sold (Public Records) $75,500 Public Records
- 2020-11-30 Sold (MLS) $75,500 AGMLS
- 2017-11-01 Sold (Public Records) $60,000 Public Records
- 2017-10-31 Sold (MLS) $59,900 AGMLS
Property tax history
+8.3%/yrLatest (2025): $666 · +226.8% YoY. Source: county tax records.
Cash-flow waterfall
monthlySold comps — $/sqft
last 12 mo · ≤1 miLoading sold comps…