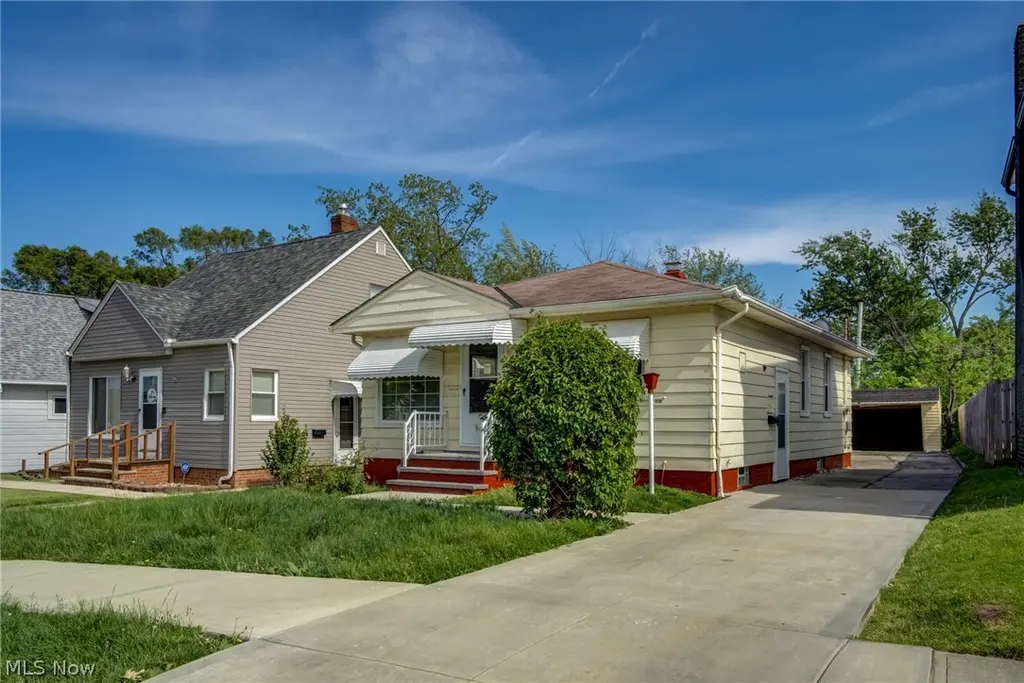
4407 Woodway Ave · Parma, OH
Flood risk 1/10 · Minimal
- FEMA flood zone
- X (unshaded)
- Chance of flooding over 30 yrs
- 0.0%
- Est. flood insurance / yr
- $473 – $860
Fire risk 1/10 · Minimal
- Est. fire insurance / yr
- $713 – $1,323
Heat risk 3/10 · Minor
- Hot days now (above 95°F)
- 7 days/yr
- Hot days in 30 yrs
- 17 days/yr
Wind risk 1/10 · Minimal
- Chance of severe wind over 30 yrs
- —
Air-quality risk 3/10 · Minor
- Unhealthy air days now
- 2 days/yr
- Unhealthy air days in 30 yrs
- 4 days/yr
Risk factors via First Street. Map © Google.
Why this score? — see what drove the C grade
The composite is a weighted blend of 9 inputs, each scored 0–100. Each bar is that input's sub-score; the figure is the points it added to the 100-point composite (weight × sub-score).
- Cash flow +24.0/30.0
- DSCR +7.7/10.0
- 1% rule +6.1/10.0
- Rent growth +5.0/5.0
- Schools +4.1/10.0
- Livability +4.1/5.0
- ARV discount +3.7/15.0
- Condition / age +2.5/5.0
- Appreciation +0.0/10.0
$195,000
🖨 Deal sheet (PDF) 📄 Offer letter ✓ Due diligence
Listing remarks MLS
For Information Purposes Only
Key facts
- 4,717 sq ft lot
- 2 garage spots
- Built 1955
Property features AI
Finance
- Financial info: Annual tax amount reported (2024)
Exterior
- Parking: Detached 2-car garage
- Security: Carbon monoxide detectors; Smoke detectors
- Utilities: Public water; Public sewer
- Home design: Single-story; Block construction; Asbestos shingle roof; Home warranty included
- Construction: Built (year source: Assessor); Block foundation
- Exterior features: Carbon monoxide detectors; Smoke detectors; Lot about 0.108 acres
Interior
- Kitchen: Disposal; Range; Refrigerator
- Bedrooms: 3 main-level bedrooms
- Bathrooms: 2 full bathrooms; 1 main-level bathroom
- Heating & cooling: Forced air heating; Central air conditioning
- Interior features: Has basement; Fixer condition; Total of 5 rooms
Neighborhood map
What this means for you Summary
Snapshot
- This is a 3-bed/1.0-bath single-family listed at $195k.
Deal economics
- At list price, monthly cash flow is $382 ($5k/yr) — positive.
- The deal already cash-flows at list — no discount required.
- Meets the 1% rule at list price ($2k rent vs $195k).
- Cap rate 8.6% vs local median 5.0% in Parma — top-decile yield for the area; either an underpriced asset or a hidden risk that comps aren't pricing in. Stress-test before assuming the spread holds.
Location & tenants
- Location reads 82/100 on livability (#84 in OH, #1,232 nationally) — a professional / high-income tenant draw. Strengths: crime A+, amenities A+, cost of living A+; Watch: employment C-, commute F.
- Parma City (suburban): math 43% / reading 52% proficiency, ranked #469 of 656 in OH (top 72%) — families likely to look elsewhere, expect single-tenant / working-renter base with shorter leases.
- Zoned schools: Thoreau Park Elementary School (math 37% / reading 42%, grade F, #1,055 of 1,584 statewide, top 68%, 409 students, 60% FRL); Shiloh Middle School (math 27% / reading 46%, grade F, #539 of 654 statewide, top 83%, 511 students, 65% FRL); Parma High School (math 32% / reading 47%, grade F, #528 of 781 statewide, top 71%, 1,233 students, 55% FRL) — zoned schools average 60% FRL vs 41% district-wide (19 pts higher); higher-poverty schools than district average — tighter screening recommended.
- Market conditions: Rents rising fast (+10.6%/yr); 120 active listings in the ZIP; 9 comparable units currently listed for rent nearby; rentals leasing fast (median 10d on market — plan ~1-2 weeks tenant-placement turnaround); 1,441 units permitted in Cuyahoga County in 2024 (700 in 5+ unit buildings).
- This rent runs 38% of the median local income ($69k/yr) — at the standard rent-burdened threshold; future hikes will face affordability resistance.
Forward outlook
- Local home prices are declining (-3.0%/yr); year-one equity from $1k of loan paydown is wiped out by about $6k of value loss. Plan a longer hold.
- Cuyahoga County population projected to shrink 8% by 2050 — rents likely to lag national; underwrite the cash flow, not the appreciation.
- At projected returns (-3.0% appreciation + 8.0% rent growth), your $55k cash investment doubles in ~8 years — after that, you're playing with house money.
Negotiation context
- Only 1 days on market — expect competitive offers; lowballing is unlikely to land.
- 7 sale attempts since 27y ago with the ask held roughly flat each time — persistent listings suggest the price (not the market) is what's stuck; bring a comps-based counter.
- Current owner paid $125k; list at $195k implies a 56% gain — meaningful room to come down on a strong offer.
Risks & watch-outs
- Watch-outs: built in 1955 — expect roof / HVAC / electrical / plumbing capex.
Questions for the listing agent
- Built in 1955 — when were the roof, HVAC, electrical panel, plumbing, and water heater last replaced?
- Is there a deadline driving the sale (1031 exchange, divorce, estate, relocation)? That informs how much negotiation room exists.
- Schools are B-rated — typically a magnet for longer-tenancy family renters. What's the average tenant stay here, and is there a school-zone premium baked into asking?
- What's the average days-on-market for RENTAL listings here right now (not sales)? A rising rental-DOM trend means longer vacancies and softer asking-rent achievability than the comps imply.
- What's the recent tenant-quality profile in this submarket — average credit score on applications, eviction rate, late-payment / NSF rate, and stable-employment percentage? A property-management company in the area should have these aggregated.
- How much new for-sale + rental construction is in the pipeline within 1–3 miles? Heavy new supply typically softens prices + rents 12–24 months out; constrained supply supports both.
Investment metrics
- 1% rule
- 1.11% ✓
- Cap rate
- 8.64%
- Cash-on-cash
- 8.39%
- DSCR
- 1.37
- GRM
- 7.5
CMA / ARV
- ARV (on-the-fly)
- $179,712
- Comps found
- 12
Show comp detail 12 sales within ~0.75 mi
| Address | Dist | Beds/Ba | Sqft | Sold | Price | $/sf | Match |
|---|---|---|---|---|---|---|---|
| 4407 Woodway Ave | 0.00mi | 3/1.0 | 864 (0%) | 3mo | $125,000 | $145 | 97 |
| 4407 Woodway Ave | 0.00mi | 3/2.0 | 864 (0%) | 1mo | $195,000 | $226 | 96 |
| 4007 Tuxedo Ave | 0.14mi | 4/2.0 (+1) | 852 (-1%) | 3mo | $219,000 | $257 | 79 |
| 4319 Russell Ave | 0.15mi | 3/1.0 | 936 (+8%) | 18mo | $182,000 | $194 | 64 |
| 5615 Luelda Ave | 0.49mi | 2/1.0 (-1) | 829 (-4%) | 3mo | $165,000 | $199 | 63 |
| 3811 Theota Ave | 0.29mi | 3/1.0 | 978 (+13%) | 4mo | $152,000 | $155 | 61 |
| 3714 Russell Ave | 0.23mi | 3/1.5 | 988 (+14%) | 7mo | $184,000 | $186 | 57 |
| 5409 Theota Ave | 0.48mi | 3/1.0 | 840 (-3%) | 19mo | $139,900 | $167 | 57 |
| 4907 Kenmore Ave | 0.66mi | 3/1.0 | 888 (+3%) | 10mo | $189,900 | $214 | 56 |
| 2819 Lincoln Ave | 0.66mi | 3/2.0 | 910 (+5%) | 2mo | $240,000 | $264 | 55 |
| 4413 Torrington Ave | 0.44mi | 3/2.0 | 968 (+12%) | 1mo | $210,000 | $217 | 54 |
| 2910 Fortune Ave | 0.69mi | 3/1.0 | 744 (-14%) | 4mo | $155,000 | $208 | 42 |
Match score weights: distance 35% · size 25% · config 20% · recency 20%. Top-matched comps best support the ARV.
Projected returns pro-forma
-3.0% appreciation · 8.0% rent growth · sell at horizon
- IRR
- 1.9%
- Equity multiple
- 1.08×
- Total profit
- $4,204
- Equity at exit
- $29,075
- IRR
- 15.9%
- Equity multiple
- 2.60×
- Total profit
- $87,288
- Equity at exit
- $16,860
Cash invested: $54,600 (down + closing). Projections, not guarantees.
Landlord ↔ Tenant lean methodology
- Overall (STATE)
- 73 Landlord-Friendly
- State Ohio
- 73 Landlord-Friendly · R+6
- County
- — inherits STATE
- City
- — inherits STATE
ZIP-level market 44134
- Rents YoY
- 10.6%
- Active inventory
- 120
- Price-to-rent
- 7.5×
Monthly cashflow live
- Estimated rent
- $2,172 high interval (Pro) →
- Mortgage (P&I)
- −$1,023
- Tax from tax record
- −$230 /mo · $2,764/yr
- Insurance
- −$81
- HOA
- −$0
- Vacancy / Maint / Mgmt
- −$456
- Net cashflow
- $382
Break-even live
Sensitivity live
| Price | -10% $492 | -5% $437 | +0% $382 | +5% $326 | +10% $271 |
|---|---|---|---|---|---|
| Rent | -10% $210 | -5% $296 | +0% $382 | +5% $467 | +10% $553 |
| Rate | -1.0pp $480 | -0.5pp $431 | base $382 | +0.5pp $331 | +1.0pp $280 |
UW: 25.0% down · 7.5% · 30yr · 1.5% tax · 5.0% vac · 8.0% maint · 8.0% mgmt
Financing live
Cash to close
- Down payment
- $48,750
- Closing costs
- $5,850
- Reserves months
- —
- Total cash needed
- —
Loan-product check · same deal, 3 products live
Conventional
25% down · 7.5% · 30yr
- Down + closing
- —
- Monthly P&I
- —
- Monthly cashflow
- —
- DSCR
- —
- Eligible?
- —
Personal DTI + credit; lowest rate.
DSCR
20% down · 8.5% · 30yr
- Down + closing
- —
- Monthly P&I
- —
- Monthly cashflow
- —
- DSCR
- —
- Eligible?
- —
No personal income docs; deal must DSCR.
Hard money
10% down · 12.0% · 12mo
- Down + closing
- —
- Monthly P&I
- —
- Monthly cashflow
- —
- DSCR
- —
- Eligible?
- —
Short-term bridge; refi at stabilization.
Rent comps 9 comps
| Address | Beds | Baths | Sqft | Rent | $/sqft | DOM | Units | Dist |
|---|---|---|---|---|---|---|---|---|
| 5252 W 45th St Unit 1496134P Parma, OH | 3.0 | 2.0 | 1065 | $3,258 | $3.06 | 0d | 1 | 0.08mi |
| 5406 Merkle Ave Cleveland, OH | 2.0 | 1.0 | 946 | $1,300 | $1.37 | 6d | 1 | 0.43mi |
| 5406 Merkle Ave Cleveland, OH | 2.0 | 1.0 | 958 | $1,300 | $1.36 | 9d | 1 | 0.43mi |
| 4520 Kenmore Ave Cleveland, OH | 2.0 | 1.0 | 726 | $1,520 | $2.09 | 0d | 1 | 0.62mi |
| 3027 Fortune Ave Unit 2 Parma, OH | 2.0 | 1.0 | 726 | $1,075 | $1.48 | 0d | 1 | 0.64mi |
| 3027 Fortune Ave Unit 1 Parma, OH | 2.0 | 1.0 | 880 | $1,175 | $1.34 | 45d | 1 | 0.64mi |
| 2910 Fortune Ave Cleveland, OH | 2.0 | 1.0 | 744 | $1,775 | $2.39 | 25d | 1 | 0.69mi |
| 2611 Brookdale Ave Cleveland, OH | 3.0 | 1.0 | 1092 | $1,825 | $1.67 | 45d | 1 | 0.79mi |
| 2907 Snow Rd Unit up Parma, OH | 3.0 | 1.0 | 1026 | $1,700 | $1.66 | 45d | 1 | 1.02mi |
Tax reassessment forecast OH · Partial reset (capped growth)
- Current annual tax
- $2,764 · $230/mo
- Projected year-2 tax
- $2,903 · $242/mo
- Expected delta
- +$139/yr (+$12/mo · 5.0%)
ⓘ Screening estimate from a state-policy table — verify with the county assessor before closing.
Climate risk First Street
- Flood 1/10 Low FEMA zone X (unshaded) · 0% chance over 30 yrs
- Wildfire 1/10 Low
- Heat 3/10 Moderate 7 d/yr ≥95°F today · 17 d/yr by 30 yrs out
- Wind 1/10 Low
- Air quality 3/10 Moderate 2 unhealthy d/yr today · 4 by 30 yrs out
Nearby sold comps map
Loading sold comps map…
Walkable amenities ~0.75 mi
Loading nearby amenities…
Taxation est. · year 1
- Rental income
- $26,061
- − Mortgage interest
- −$10,923
- − Property taxes
- −$2,764
- − Insurance
- −$975
- − Repairs & maintenance
- −$2,085
- − Management
- −$2,085
- − Depreciation
- −$5,673
- Taxable income
- $1,557
- Est. tax owed @ 24.0%
- −$374
- After-tax cash flow
- $4,205/yr
For passive investors: Depreciation is non-cash, so a rental often shows a tax loss while cash-flowing — sheltering income. Rental losses are passive: they offset passive income freely, and up to $25,000/yr can offset ordinary (W-2) income if you actively participate and your MAGI is under $100k (phasing out to $0 by $150k); unused losses carry forward. On sale, claimed depreciation is recaptured at up to 25%, and gains may owe capital-gains tax (a 1031 exchange can defer both). Figures are a year-1 estimate at your 24.0% rate — not tax advice; consult a CPA.
Schools (NCES district)
- District
- Parma City
- NCES district ID
- 3904463
- Math proficiency
- 43% ▼ -18.00%
- Reading proficiency
- 52% ▼ -10.00%
- Median HH income
- $50,371
- Composite
- 40.72/100
- National rank
- #3662
- State rank
- #469 of 656 in OH
Livability — Parma
- Score
- 82/100
- State rank
- #84
- US rank
- #1232
Category grades
Schools grade is shown separately in the Schools card above.
Census & demographics
- Census place
- Parma, OH
- County
- Cuyahoga County · 1,090,369 people
- City population
- 66,574
- Metro
- Cleveland-Elyria, OH
- Population (ZIP)
- 37,774
- Household income
- $68,625
- Rent vs Own
- Severe rent burden
- 668.0
Population outlook (Cuyahoga County) Hauer SSP2
- Today (2025)
- 1,244,621 people
- By 2030
- 1,230,093 · -1.2%
- By 2040
- 1,189,108 · -4.5%
- By 2050
- 1,145,706 · -7.9%
- By 2075
- 1,076,557 · -13.5%
- By 2100
- 978,987 · -21.3%
Race, ethnicity, and origin ACS 2023
- Neighborhood character
- Predominantly White (85%)
- Race & ethnicity
- White 85% Two or more races 6% Hispanic / Latino 5% Black 3% Asian 3%
- Common ancestry
- Romanian 14% Subsaharan African 6% Slovak 1%
- Foreign-born
- 11% · Canada, Vietnam
- Languages at home
- 84% English-only · Russian/Polish/Slavic 7% Spanish 3% Other Indo-European 2%
Political lean MEDSL · Cuyahoga
- 2024 margin
- Solid D (+31.5) · D 65.4% · R 33.9%
- 2008→2024 swing
- -7.4pp toward R · 2008: 38.9pp · 2024: 31.5pp
- All cycles
- 2024: D+31.5 2020: D+34.1 2016: D+35.0 2012: D+38.7 2008: D+38.9
Not yet ingested
- Civics
- —
Market trends
- HPI YoY
- ▼ -215.17%
- Current HPI
- 184.0553
- Rent YoY
- ▲ 10.56%
- Metro
- Cleveland-Elyria, OH
- State GDP YoY
- ▲ 1.98%
- F500 in state
- 48
Industry mix (Fortune 500 HQ in OH)
| Industry | F500 HQs | Revenue |
|---|---|---|
| Insurance | 3 | $145B |
|
||
| Industrial Machinery | 3 | $49B |
|
||
| Financial Services | 3 | $24B |
|
||
| Consumer Goods | 2 | $93B |
|
||
| Aerospace / Defense | 2 | $47B |
|
||
| Utilities | 2 | $33B |
|
||
Price history
-97.9% since first listed21 events — show timeline
- 2026-05-29 Pending — MLSNOW
- 2026-05-29 Rental Removed $1,750 YESMLS
- 2026-05-28 Listed $195,000 MLSNOW
- 2026-05-26 Listed for Rent $1,750 YESMLS
- 2026-03-18 Sold (MLS) $125,000 MLSNOW
- 2026-02-11 Listed $125,000 MLSNOW
- 2019-12-06 Sold (Public Records) $76,000 Public Records
- 2019-12-06 Sold (MLS) $76,000 MLSNOW
- 2019-12-03 Listing Removed — MLSNOW
- 2019-11-13 Contingent — MLSNOW
- 2019-10-28 Relisted — MLSNOW
- 2019-10-28 Price Changed $89,500 MLSNOW
- 2019-10-24 Listing Removed — MLSNOW
- 2019-10-08 Price Changed $96,000 MLSNOW
- 2019-09-17 Price Changed $101,000 MLSNOW
- 2019-08-30 Listed $109,500 MLSNOW
- 1999-09-09 Listing Removed — MLSNOW
- 1999-06-02 Listed $102,000 MLSNOW
- 1999-06-01 Listing Removed — MLSNOW
- 1999-02-01 Listed $104,000 MLSNOW
- 1997-11-06 Sold (Public Records) $85,000 Public Records
Property tax history
+8.4%/yrLatest (2025): $2,764 · -5.1% YoY. Source: county tax records.
Cash-flow waterfall
monthlySold comps — $/sqft
last 12 mo · ≤1 miLoading sold comps…