37259 N Fairview Ln · Fox Lake Hills, IL
Flood risk 1/10 · Minimal
- FEMA flood zone
- X (unshaded)
- Chance of flooding over 30 yrs
- 0.0%
- Est. flood insurance / yr
- $507 – $1,088
Fire risk 3/10 · Minor
- Est. fire insurance / yr
- $804 – $1,492
Heat risk 2/10 · Minimal
- Hot days now (above 100°F)
- 7 days/yr
- Hot days in 30 yrs
- 14 days/yr
Wind risk 2/10 · Minimal
- Chance of severe wind over 30 yrs
- —
Air-quality risk 3/10 · Minor
- Unhealthy air days now
- 2 days/yr
- Unhealthy air days in 30 yrs
- 3 days/yr
Risk factors via First Street. Map © Google.
Why this score? — see what drove the C- grade
The composite is a weighted blend of 9 inputs, each scored 0–100. Each bar is that input's sub-score; the figure is the points it added to the 100-point composite (weight × sub-score).
- Cash flow +18.1/30.0
- ARV discount +11.5/15.0
- DSCR +5.7/10.0
- 1% rule +5.5/10.0
- Livability +3.4/5.0
- Rent growth +2.5/5.0
- Condition / age +2.5/5.0
- Schools +2.3/10.0
- Appreciation +0.0/10.0
$270,000
🖨 Deal sheet (PDF) 📄 Offer letter ✓ Due diligence
Listing remarks
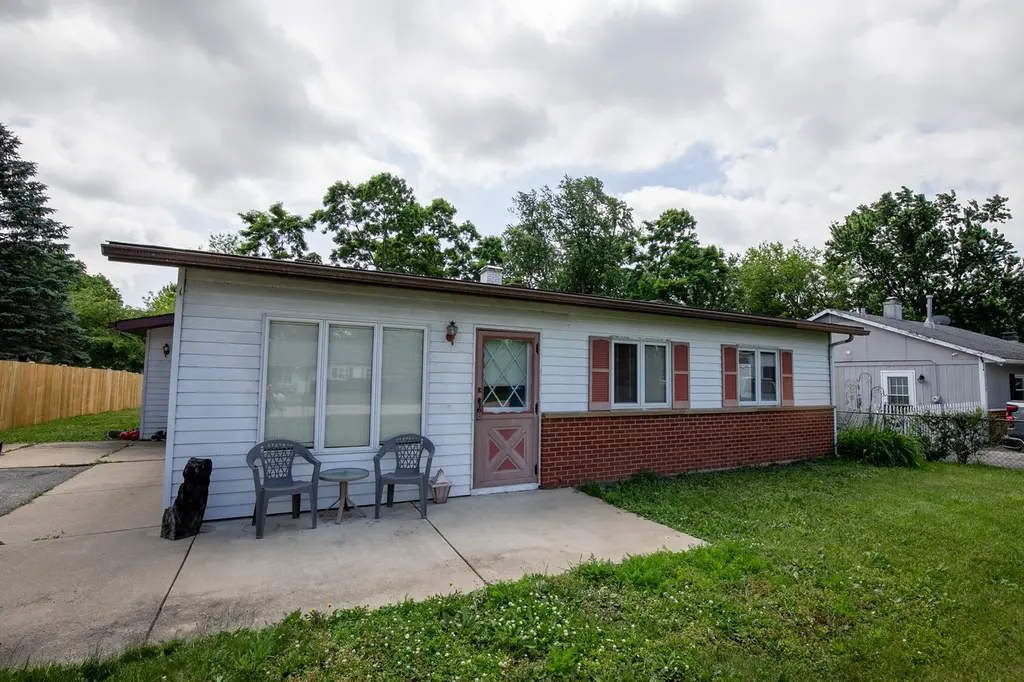
Welcome to this 2 bedroom, 1 and a half bath ranch in Lake Villa. New carpet and vinyl flooring throughout entire home. Large family room that opens to kitchen with room for a dining table and entertaining. Additional 2nd living space in the front of the house. Home has a large backyard and long driveway. Updates: HVAC, stove, dishwasher, washer and dryer all replaced in 2022. The roof was replaced in 2017. Home is being SOLD AS-IS.
Key facts
- Large family room
- Large backyard
- Long driveway
Tags
Property features AI
Finance
- Other: Ownership: Fee simple; Built before 1978
- HOA & community: No master association fee required
Exterior
- Utilities: Water source: Lake Michigan; Public sewer
- Home design: Detached single-family home; One-story
- Construction: Built 61–70 years ago; Vinyl siding and brick exterior
- Exterior features: Lot smaller than 0.25 acre; Lot dimensions approx. 0.2070 acres
Interior
- Kitchen: Kitchen on the main level (12 x 13)
- Bedrooms: Two bedrooms (both on the main level); Master bedroom on the main level (15 x 12); Second bedroom on the main level (11 x 11)
- Bathrooms: One full bathroom; One half bathroom
- Heating & cooling: Natural gas forced-air heating; Central air conditioning
- Interior features: Five total rooms; One fireplace located in the family room
- Laundry & utility: Main-level laundry room (9 x 9)
Neighborhood map
What this means for you Summary
Snapshot
- This is a 3-bed/1.0-bath single-family listed at $270k.
Deal economics
- At list price, monthly cash flow is $239 ($3k/yr) — positive.
- The deal already cash-flows at list — no discount required.
- Meets the 1% rule at list price ($3k rent vs $270k).
- Cap rate 7.4% vs local median 4.0% in Fox Lake Hills — top-decile yield for the area; either an underpriced asset or a hidden risk that comps aren't pricing in. Stress-test before assuming the spread holds.
Location & tenants
- Location reads 67/100 on livability (#489 in IL) — a middle-class / working-renter tenant base. Strengths: crime A+, employment A+, housing A+; Watch: amenities F, commute F, health & safety F.
- Grant Chsd 124 (suburban): math 23% / reading 27% proficiency, ranked #296 of 620 in IL (top 48%) — low school quality limits family demand, transient renter base, plan for 1-2y turnover.
- Zoned schools: Gavin Central Elementary School (math 8% / reading 12%, grade F, #1,517 of 2,056 statewide, top 78%, 481 students, 0% FRL); Gavin South Middle School (math 18% / reading 17%, grade F, #450 of 665 statewide, top 69%, 297 students, 0% FRL); Grant Community High School (math 23% / reading 27%, grade F, #247 of 693 statewide, top 36%, 1,837 students, 0% FRL).
- Market conditions: 84 active listings in the ZIP; 3 comparable units currently listed for rent nearby; rentals at typical pace (median 16d on market — plan ~3-4 weeks tenant-placement turnaround); high-income renter base; 948 units permitted in Lake County in 2024 (424 in 5+ unit buildings).
Forward outlook
- Local home prices are declining (-3.0%/yr); year-one equity from $2k of loan paydown is wiped out by about $8k of value loss. Plan a longer hold.
- Lake County population projected to shrink 8% by 2050 — rents likely to lag national; underwrite the cash flow, not the appreciation.
Negotiation context
- Only 12 days on market — expect competitive offers; lowballing is unlikely to land.
Risks & watch-outs
- Watch-outs: built in 1959 — expect roof / HVAC / electrical / plumbing capex.
Questions for the listing agent
- Built in 1959 — when were the roof, HVAC, electrical panel, plumbing, and water heater last replaced?
- Is there a deadline driving the sale (1031 exchange, divorce, estate, relocation)? That informs how much negotiation room exists.
- Schools are D-rated, which usually means shorter tenancies and higher turnover. Who's the typical renter profile here, and what's been the actual vacancy rate?
- What's the average days-on-market for RENTAL listings here right now (not sales)? A rising rental-DOM trend means longer vacancies and softer asking-rent achievability than the comps imply.
- What's the recent tenant-quality profile in this submarket — average credit score on applications, eviction rate, late-payment / NSF rate, and stable-employment percentage? A property-management company in the area should have these aggregated.
- How much new for-sale + rental construction is in the pipeline within 1–3 miles? Heavy new supply typically softens prices + rents 12–24 months out; constrained supply supports both.
Investment metrics
- 1% rule
- 1.05% ✓
- Cap rate
- 7.35%
- Cash-on-cash
- 3.79%
- DSCR
- 1.17
- GRM
- 7.9
CMA / ARV
- ARV (on-the-fly)
- $296,395
- Comps found
- 12
Show comp detail 12 sales within ~0.75 mi
| Address | Dist | Beds/Ba | Sqft | Sold | Price | $/sf | Match |
|---|---|---|---|---|---|---|---|
| 37227 N Hillside Dr | 0.18mi | 3/2.0 | 1,624 (+2%) | 3mo | $245,000 | $151 | 81 |
| 37411 N Fairview Ln | 0.15mi | 3/2.0 | 1,548 (-2%) | 6mo | $290,000 | $187 | 80 |
| 37203 N Il Route 59 | 0.11mi | 3/1.0 | 1,452 (-8%) | 9mo | $270,000 | $186 | 73 |
| 37072 Avon Dr N | 0.21mi | 3/2.0 | 1,500 (-5%) | 15mo | $224,000 | $149 | 65 |
| 37285 N Piper Ln | 0.23mi | 3/1.0 | 1,389 (-12%) | 10mo | $260,000 | $187 | 61 |
| 36849 N Eastmoor Ave | 0.66mi | 3/3.0 | 1,595 (+1%) | 1mo | $442,500 | $277 | 60 |
| 25462 W Arcade Dr S | 0.20mi | 3/1.0 | 1,354 (-15%) | 8mo | $135,000 | $100 | 60 |
| 25583 W Lakeview Ct | 0.31mi | 3/1.5 | 1,468 (-7%) | 14mo | $319,000 | $217 | 59 |
| 37440 N Lake Shore Dr | 0.43mi | 3/2.0 | 1,462 (-8%) | 5mo | $265,000 | $181 | 59 |
| 37255 N Lake Shore Dr | 0.31mi | 4/2.0 (+1) | 1,796 (+13%) | 8mo | $320,000 | $178 | 47 |
| 37193 N Lake Shore Dr | 0.32mi | 4/2.0 (+1) | 1,800 (+14%) | 11mo | $353,000 | $196 | 45 |
| 25744 W Lehmann Blvd | 0.63mi | 3/2.0 | 1,688 (+6%) | 14mo | $735,000 | $435 | 44 |
Match score weights: distance 35% · size 25% · config 20% · recency 20%. Top-matched comps best support the ARV.
Projected returns pro-forma
-3.0% appreciation · 3.0% rent growth · sell at horizon
- IRR
- -10.3%
- Equity multiple
- 0.62×
- Total profit
- $-28,416
- Equity at exit
- $40,258
- IRR
- -0.9%
- Equity multiple
- 0.94×
- Total profit
- $-4,643
- Equity at exit
- $23,345
Cash invested: $75,600 (down + closing). Projections, not guarantees.
Landlord ↔ Tenant lean methodology
- Overall (STATE)
- 43 Moderately Tenant-Leaning
- State Illinois
- 43 Moderately Tenant-Leaning · D+7
- County
- — inherits STATE
- City
- — inherits STATE
ZIP-level market 60046
- Active inventory
- 84
- Price-to-rent
- 7.9×
Monthly cashflow live
- Estimated rent
- $2,839 medium interval (Pro) →
- Mortgage (P&I)
- −$1,416
- Tax from tax record
- −$476 /mo · $5,710/yr
- Insurance
- −$112
- HOA
- −$0
- Lot rent
- −$0
- Vacancy / Maint / Mgmt
- −$596
- Net cashflow
- $239
Break-even live
Sensitivity live
| Price | -10% $392 | -5% $315 | +0% $239 | +5% $162 | +10% $86 |
|---|---|---|---|---|---|
| Rent | -10% $14 | -5% $127 | +0% $239 | +5% $351 | +10% $463 |
| Rate | -1.0pp $375 | -0.5pp $307 | base $239 | +0.5pp $169 | +1.0pp $98 |
UW: 25.0% down · 7.5% · 30yr · 1.5% tax · 5.0% vac · 8.0% maint · 8.0% mgmt
Financing live
Cash to close
- Down payment
- $67,500
- Closing costs
- $8,100
- Reserves months
- —
- Total cash needed
- —
Loan-product check · same deal, 3 products live
Conventional
25% down · 7.5% · 30yr
- Down + closing
- —
- Monthly P&I
- —
- Monthly cashflow
- —
- DSCR
- —
- Eligible?
- —
Personal DTI + credit; lowest rate.
DSCR
20% down · 8.5% · 30yr
- Down + closing
- —
- Monthly P&I
- —
- Monthly cashflow
- —
- DSCR
- —
- Eligible?
- —
No personal income docs; deal must DSCR.
Hard money
10% down · 12.0% · 12mo
- Down + closing
- —
- Monthly P&I
- —
- Monthly cashflow
- —
- DSCR
- —
- Eligible?
- —
Short-term bridge; refi at stabilization.
Rent comps 3 comps
| Address | Beds | Baths | Sqft | Rent | $/sqft | DOM | Units | Dist |
|---|---|---|---|---|---|---|---|---|
| 25640 W Glade Dr Unit SFH Lake Villa, IL | 3.0 | 2.0 | 1940 | $2,900 | $1.49 | 15d | 1 | 0.57mi |
| 25640 W Glade Dr Lake Villa, IL | 3.0 | 2.0 | 1940 | $2,700 | $1.39 | 0d | 1 | 0.57mi |
| 25638 W Glade Dr Lake Villa, IL | 3.0 | 2.0 | 1940 | $2,900 | $1.49 | 15d | 1 | 0.57mi |
Listing history 8 events
-
2026-06-22days on market $270,000 Active 12 DOM
-
2026-06-21days on market $270,000 Active 11 DOM
-
2026-06-18days on market $270,000 Active 8 DOM
-
2026-06-17days on market $270,000 Active 7 DOM
-
2026-06-16days on market $270,000 Active 6 DOM
-
2026-06-15days on market $270,000 Active 5 DOM
-
2026-06-13remarks 437-char remark
-
2026-06-13$270,000 Active 3 DOM
ⓘ Source: listings_history table (triggers on properties + properties_extension) + one-shot
backfill from property_details.listing_events for pre-trigger history.
Tax reassessment forecast IL · Partial reset (capped growth)
- Current annual tax
- $5,710 · $476/mo
- Projected year-2 tax
- $5,920 · $493/mo
- Expected delta
- +$209/yr (+$17/mo · 3.7%)
ⓘ Screening estimate from a state-policy table — verify with the county assessor before closing.
Climate risk First Street
- Flood 1/10 Low FEMA zone X (unshaded) · 0% chance over 30 yrs
- Wildfire 3/10 Moderate
- Heat 2/10 Low 7 d/yr ≥100°F today · 14 d/yr by 30 yrs out
- Wind 2/10 Low
- Air quality 3/10 Moderate 2 unhealthy d/yr today · 3 by 30 yrs out
Nearby sold comps map
Loading sold comps map…
Walkable amenities ~0.75 mi
Loading nearby amenities…
Taxation est. · year 1
- Rental income
- $34,071
- − Mortgage interest
- −$15,124
- − Property taxes
- −$5,710
- − Insurance
- −$1,350
- − Repairs & maintenance
- −$2,726
- − Management
- −$2,726
- − Depreciation
- −$7,855
- Taxable loss
- −$1,419
- Est. tax savings @ 24.0%
- +$341
- After-tax cash flow
- $3,206/yr
For passive investors: Depreciation is non-cash, so a rental often shows a tax loss while cash-flowing — sheltering income. Rental losses are passive: they offset passive income freely, and up to $25,000/yr can offset ordinary (W-2) income if you actively participate and your MAGI is under $100k (phasing out to $0 by $150k); unused losses carry forward. On sale, claimed depreciation is recaptured at up to 25%, and gains may owe capital-gains tax (a 1031 exchange can defer both). Figures are a year-1 estimate at your 24.0% rate — not tax advice; consult a CPA.
Schools (NCES district)
- District
- Grant Chsd 124
- NCES district ID
- 1717340
- Math proficiency
- 23% ▼ -9.00%
- Reading proficiency
- 27% ▼ -7.00%
- Median HH income
- $59,450
- Composite
- 22.95/100
- National rank
- #7989
- State rank
- #296 of 620 in IL
Livability — Fox Lake Hills
- Score
- 67/100
- State rank
- #489
- US rank
- #10117
Category grades
Schools grade is shown separately in the Schools card above.
Census & demographics
- Census place
- Fox Lake Hills, IL
- County
- Lake County · 591,991 people
- Metro
- Chicago-Naperville-Elgin, IL-IN-WI
- Population (ZIP)
- 34,613
- Household income
- $126,042
- Rent vs Own
- Severe rent burden
- 282.0
Population outlook (Lake County) Hauer SSP2
- Today (2025)
- 700,217 people
- By 2030
- 693,290 · -1.0%
- By 2040
- 673,588 · -3.8%
- By 2050
- 643,556 · -8.1%
- By 2075
- 562,792 · -19.6%
- By 2100
- 457,715 · -34.6%
Race, ethnicity, and origin ACS 2023
- Neighborhood character
- Predominantly White (70%)
- Race & ethnicity
- White 70% Hispanic / Latino 17% Two or more races 9% Asian 6% Black 4%
- Hispanic origin (detail)
- Mexican 12% Puerto Rican 2%
- Common ancestry
- Romanian 13% Portuguese 2% Lithuanian 2%
- Foreign-born
- 13% · Canada, South Korea, Vietnam
- Languages at home
- 80% English-only · Spanish 11% Russian/Polish/Slavic 3% Other Asian/Pacific 1%
Political lean MEDSL · Lake
- 2024 margin
- Strong D (+20.8) · D 59.7% · R 38.9% · Other 1.4%
- 2008→2024 swing
- +1.1pp toward D · 2008: 19.6pp · 2024: 20.8pp
- All cycles
- 2024: D+20.8 2020: D+24.1 2016: D+20.3 2012: D+8.1 2008: D+19.6
Not yet ingested
- Civics
- —
Market trends
- HPI YoY
- ▼ -137.45%
- Current HPI
- 202.1374
- Rent YoY
- —
- Metro
- Chicago-Naperville-Elgin, IL-IN-WI
- State GDP YoY
- ▲ 1.59%
- F500 in state
- 60
Industry mix (Fortune 500 HQ in IL)
| Industry | F500 HQs | Revenue |
|---|---|---|
| Insurance | 4 | $201B |
|
||
| Consumer Goods | 4 | $87B |
|
||
| Industrial Machinery | 3 | $64B |
|
||
| Healthcare | 2 | $55B |
|
||
| Retail / Pharmacy | 1 | $148B |
|
||
| Agriculture / Food | 1 | $86B |
|
||
Price history
1 event — show timeline
- 2026-06-10 Listed $270,000 MRED as Distributed by MLS Grid
Property tax history
+2.4%/yrLatest (2024): $5,710 · +5.1% YoY. Source: county tax records.
Cash-flow waterfall
monthlySold comps — $/sqft
last 12 mo · ≤1 miLoading sold comps…