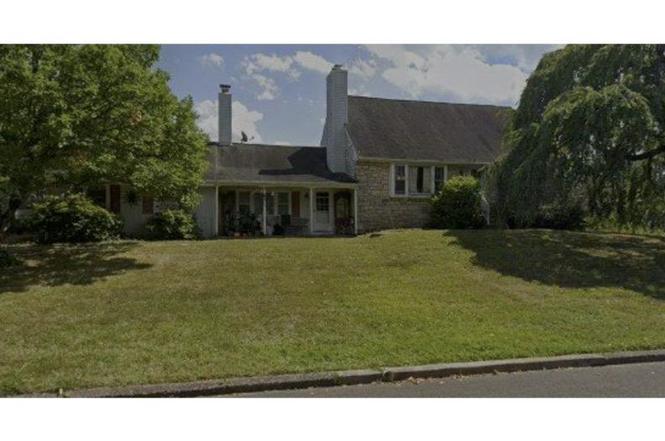
100 New Jersey Ave · Brittany Farms-The Highlands, PA
Flood risk 1/10 · Minimal
- FEMA flood zone
- X (unshaded)
- Chance of flooding over 30 yrs
- 0.0%
- Est. flood insurance / yr
- $473 – $860
Fire risk 1/10 · Minimal
- Est. fire insurance / yr
- $511 – $949
Heat risk 5/10 · Moderate
- Hot days now (above 100°F)
- 7 days/yr
- Hot days in 30 yrs
- 15 days/yr
Wind risk 6/10 · Moderate
- Chance of severe wind over 30 yrs
- 27.0%
Air-quality risk 4/10 · Minor
- Unhealthy air days now
- 4 days/yr
- Unhealthy air days in 30 yrs
- 6 days/yr
Risk factors via First Street. Map © Google.
Why this score? — see what drove the C+ grade
The composite is a weighted blend of 9 inputs, each scored 0–100. Each bar is that input's sub-score; the figure is the points it added to the 100-point composite (weight × sub-score).
- Cash flow +21.9/30.0
- ARV discount +15.0/15.0
- DSCR +7.0/10.0
- 1% rule +5.9/10.0
- Schools +5.8/10.0
- Rent growth +2.5/5.0
- Livability +2.5/5.0
- Condition / age +2.5/5.0
- Appreciation +0.0/10.0
$315,000
🖨 Deal sheet 📄 Offer letter ✓ Due diligence
Listing remarks MLS
Well maintained cape cod. All newer windows- newer heater, hardwood floors, very neutral and very clean- ready for a quick settlement. Five heating zones, full basement, two car garage- this is an incredible find!! Fireplace large family room for entertaining- corner lot- too many great features to mention- you must see this one!!
Key facts
- 0.43 acre lot
- 2 garage spots
- Built 2002
Neighborhood map
What this means for you Summary
Snapshot
- This is a 3-bed/2.0-bath single-family listed at $315k.
Deal economics
- At list price, monthly cash flow is $494 ($6k/yr) — positive.
- The deal already cash-flows at list — no discount required.
- Meets the 1% rule at list price ($3k rent vs $315k).
- Recommended offer: $310k (1.5% below list) — sets the bar for market timing.
- Cap rate 8.2% vs local median 2.9% in Brittany Farms-The Highlands — top-decile yield for the area; either an underpriced asset or a hidden risk that comps aren't pricing in. Stress-test before assuming the spread holds.
Location & tenants
- Location reads: area grade C — affects rentability + tenant quality, not the cash-flow math above.
- Central Bucks SD (suburban): math 55% / reading 71% proficiency, ranked #37 of 539 in PA (top 7%) — acceptable for families but not a draw, mixed tenant base, ~2y average lease; only 7% free/reduced lunch — higher-income household profile.
- Zoned schools: Central Bucks Hs-West (math 94% / reading 24%, grade C+, #81 of 437 statewide, top 18%, 1,504 students, 12% FRL).
- Market conditions: 132 active listings in the ZIP; 5 comparable units currently listed for rent nearby; rentals leasing fast (median 5d on market — plan ~1-2 weeks tenant-placement turnaround); high-income renter base; 663 units permitted in Bucks County in 2024 (106 in 5+ unit buildings).
Forward outlook
- Local home prices are declining (-3.0%/yr); year-one equity from $2k of loan paydown is wiped out by about $9k of value loss. Plan a longer hold.
- Bucks County population projected to shrink 7% by 2050 — rents likely to lag national; underwrite the cash flow, not the appreciation.
Negotiation context
- It's been on market 15 days — a 2% lower offer ($310k) is reasonable based on typical stale-listing flexibility.
- 4 sale attempts since 24y ago; this cycle's ask has dropped $235k (43%) from the opening price — seller is motivated, your offer sets the floor, not the list.
Risks & watch-outs
- Climate carrying-cost: major wind risk, 27% chance of damaging wind over 30y; extreme-heat days projected 7→15/yr by 2055 (HVAC capex compounding) — expect insurance premiums to compound above CPI over the hold.
Questions for the listing agent
- Is there a deadline driving the sale (1031 exchange, divorce, estate, relocation)? That informs how much negotiation room exists.
- What's the average days-on-market for RENTAL listings here right now (not sales)? A rising rental-DOM trend means longer vacancies and softer asking-rent achievability than the comps imply.
- What's the recent tenant-quality profile in this submarket — average credit score on applications, eviction rate, late-payment / NSF rate, and stable-employment percentage? A property-management company in the area should have these aggregated.
- How much new for-sale + rental construction is in the pipeline within 1–3 miles? Heavy new supply typically softens prices + rents 12–24 months out; constrained supply supports both.
Investment metrics
- 1% rule
- 1.09% ✓
- Cap rate
- 8.17%
- Cash-on-cash
- 6.72%
- DSCR
- 1.30
- GRM
- 7.6
CMA / ARV
- ARV (on-the-fly)
- $604,326
- Comps found
- 12
Show comp detail 12 sales within ~0.75 mi
| Address | Dist | Beds/Ba | Sqft | Sold | Price | $/sf | Match |
|---|---|---|---|---|---|---|---|
| 163 Pennsylvania Ave | 0.19mi | 3/2.0 | 2,249 (+5%) | 0mo | $350,000 | $156 | 82 |
| 127 Hampshire Dr | 0.15mi | 4/2.0 (+1) | 2,076 (-3%) | 10mo | $592,000 | $285 | 74 |
| 220 Hampshire Dr | 0.34mi | 4/2.0 (+1) | 2,092 (-2%) | 2mo | $525,000 | $251 | 74 |
| 200 Cornwall Dr | 0.40mi | 4/2.5 (+1) | 2,124 (-1%) | 8mo | $600,000 | $282 | 66 |
| 202 Cornwall Dr | 0.41mi | 4/2.5 (+1) | 2,209 (+3%) | 6mo | $575,000 | $260 | 64 |
| 245 Hampshire Dr | 0.47mi | 4/1.5 (+1) | 2,100 (-2%) | 7mo | $475,000 | $226 | 62 |
| 15 Clearview Ave | 0.74mi | 3/2.0 | 1,982 (-8%) | 0mo | $615,000 | $310 | 53 |
| 50 Hickory Ln | 0.66mi | 4/2.5 (+1) | 2,028 (-5%) | 2mo | $585,000 | $288 | 52 |
| 214 Surrey Rd | 0.41mi | 4/1.5 (+1) | 1,920 (-10%) | 7mo | $450,000 | $234 | 51 |
| 46 Hickory Ln | 0.67mi | 4/2.5 (+1) | 2,028 (-5%) | 6mo | $600,000 | $296 | 47 |
| 121 North Ln | 0.28mi | 4/2.5 (+1) | 2,464 (+15%) | 12mo | $610,000 | $248 | 45 |
| 48 Hickory Ln | 0.67mi | 4/2.5 (+1) | 2,028 (-5%) | 12mo | $625,000 | $308 | 43 |
Match score weights: distance 35% · size 25% · config 20% · recency 20%. Top-matched comps best support the ARV.
Projected returns pro-forma
-3.0% appreciation · 3.0% rent growth · sell at horizon
- IRR
- -6.0%
- Equity multiple
- 0.78×
- Total profit
- $-19,512
- Equity at exit
- $46,968
- IRR
- 3.7%
- Equity multiple
- 1.27×
- Total profit
- $23,838
- Equity at exit
- $27,235
Cash invested: $88,200 (down + closing). Projections, not guarantees.
Landlord ↔ Tenant lean methodology
- Overall (STATE)
- 62 Landlord-Friendly
- State Pennsylvania
- 62 Landlord-Friendly · EVEN
- County
- — inherits STATE
- City
- — inherits STATE
ZIP-level market 18914
- Active inventory
- 132
- Price-to-rent
- 7.6×
Monthly cashflow live
- Estimated rent
- $3,442 high interval (Pro) →
- Mortgage (P&I)
- −$1,652
- Tax from tax record
- −$442 /mo · $5,305/yr
- Insurance
- −$131
- HOA
- −$0
- Vacancy / Maint / Mgmt
- −$723
- Net cashflow
- $494
Break-even live
UW: 25.0% down · 7.5% · 30yr · 1.5% tax · 5.0% vac · 8.0% maint · 8.0% mgmt
Financing live
Cash to close
- Down payment
- $78,750
- Closing costs
- $9,450
- Reserves months
- —
- Total cash needed
- —
Loan-product check · same deal, 3 products live
Conventional
25% down · 7.5% · 30yr
- Down + closing
- —
- Monthly P&I
- —
- Monthly cashflow
- —
- DSCR
- —
- Eligible?
- —
Personal DTI + credit; lowest rate.
DSCR
20% down · 8.5% · 30yr
- Down + closing
- —
- Monthly P&I
- —
- Monthly cashflow
- —
- DSCR
- —
- Eligible?
- —
No personal income docs; deal must DSCR.
Hard money
10% down · 12.0% · 12mo
- Down + closing
- —
- Monthly P&I
- —
- Monthly cashflow
- —
- DSCR
- —
- Eligible?
- —
Short-term bridge; refi at stabilization.
Rent comps 5 comps
| Address | Beds | Baths | Sqft | Rent | $/sqft | DOM | Units | Dist |
|---|---|---|---|---|---|---|---|---|
| 108 Pipers Pl Chalfont, PA | 3.0 | 2.5 | 1540 | $2,800 | $1.82 | 4d | 1 | 0.60mi |
| 105 Galway Cir Chalfont, PA | 3.0 | 2.5 | 2020 | $2,695 | $1.33 | 43d | 1 | 0.87mi |
| 328 Foxtail Ln Chalfont, PA | 3.0 | 2.5 | 2343 | $3,800 | $1.62 | 24d | 1 | 0.94mi |
| 312 W Boulder Dr Chalfont, PA | 3.0 | 2.5 | 2150 | $3,200 | $1.49 | 2d | 1 | 1.11mi |
| 212 Foxhedge Rd Chalfont, PA | 4.0 | 3.0 | 2080 | $3,900 | $1.88 | 1d | 1 | 1.14mi |
Listing history 12 events
-
2026-04-14price $265,000
-
2026-03-11price $315,000
-
2026-02-25price $415,000
-
2026-02-25status Pending
-
2026-02-25price $315,000
-
2026-02-10status Active
-
2026-02-10Active Under Contract
-
2026-02-10$549,900
-
2004-12-09soldstatus $280,000
-
2004-11-23soldstatus $280,000 332-char remark
Show marketing remark (332 chars)
Well maintained cape cod. All newer windows- newer heater, hardwood floors, very neutral and very clean- ready for a quick settlement. Five heating zones, full basement, two car garage- this is an incredible find!! Fireplace large family room for entertaining- corner lot- too many great features to mention- you must see this one!!
-
2002-12-29historical
-
2002-09-21$359,990
ⓘ Source: listings_history table (triggers on properties + properties_extension) + one-shot
backfill from property_details.listing_events for pre-trigger history.
Tax reassessment forecast PA · Partial reset (capped growth)
- Current annual tax
- $5,305 · $442/mo
- Projected year-2 tax
- $5,305 · $442/mo
- Expected delta
- $0/yr ($0/mo · 0.0%)
ⓘ Screening estimate from a state-policy table — verify with the county assessor before closing.
Climate risk First Street
- Flood 1/10 Low FEMA zone X (unshaded) · 0% chance over 30 yrs
- Wildfire 1/10 Low
- Heat 5/10 Major 7 d/yr ≥100°F today · 15 d/yr by 30 yrs out
- Wind 6/10 Major 27% chance of damaging wind over 30 yrs
- Air quality 4/10 Moderate 4 unhealthy d/yr today · 6 by 30 yrs out
Nearby sold comps map
Loading sold comps map…
Walkable amenities ~0.75 mi
Loading nearby amenities…
Taxation est. · year 1
- Rental income
- $41,301
- − Mortgage interest
- −$17,645
- − Property taxes
- −$5,305
- − Insurance
- −$1,575
- − Repairs & maintenance
- −$3,304
- − Management
- −$3,304
- − Depreciation
- −$9,164
- Taxable income
- $1,005
- Est. tax owed @ 24.0%
- −$241
- After-tax cash flow
- $5,684/yr
For passive investors: Depreciation is non-cash, so a rental often shows a tax loss while cash-flowing — sheltering income. Rental losses are passive: they offset passive income freely, and up to $25,000/yr can offset ordinary (W-2) income if you actively participate and your MAGI is under $100k (phasing out to $0 by $150k); unused losses carry forward. On sale, claimed depreciation is recaptured at up to 25%, and gains may owe capital-gains tax (a 1031 exchange can defer both). Figures are a year-1 estimate at your 24.0% rate — not tax advice; consult a CPA.
Schools (NCES district)
- District
- Central Bucks SD
- NCES district ID
- 4205310
- Math proficiency
- 55% ▼ -12.00%
- Reading proficiency
- 71% ▼ -12.00%
- Median HH income
- $97,513
- Composite
- 58.05/100
- National rank
- #1032
- State rank
- #37 of 539 in PA
Livability — Brittany Farms-The Highlands
No livability data for this city. (Only ~50 U.S. cities are tracked.)
Census & demographics
- Census place
- Brittany Farms-The Highlands, PA
- County
- Bucks County · 506,477 people
- Metro
- Philadelphia-Camden-Wilmington, PA-NJ-DE-MD
- Population (ZIP)
- 21,598
- Household income
- $148,824
- Rent vs Own
- Severe rent burden
- 325.0
Population outlook (Bucks County) Hauer SSP2
- Today (2025)
- 630,973 people
- By 2030
- 627,093 · -0.6%
- By 2040
- 609,680 · -3.4%
- By 2050
- 584,225 · -7.4%
- By 2075
- 539,840 · -14.4%
- By 2100
- 483,970 · -23.3%
Race, ethnicity, and origin ACS 2023
- Neighborhood character
- Predominantly White (85%)
- Race & ethnicity
- White 85% Asian 6% Black 4% Hispanic / Latino 4% Two or more races 4%
- Common ancestry
- Romanian 6% Lithuanian 2% Italian 2%
- Foreign-born
- 8% · Canada, South Korea, China
- Languages at home
- 90% English-only · Other Indo-European 3% Spanish 2% Korean 1%
Political lean MEDSL · Bucks
- 2024 margin
- Toss-up / Even · D 49.5% · R 49.5%
- 2008→2024 swing
- -8.7pp toward R · 2008: 8.7pp · 2024: -0.1pp
- All cycles
- 2024: R+0.1 2020: D+4.4 2016: D+0.6 2012: D+1.2 2008: D+8.7
Not yet ingested
- Civics
- —
Market trends
- HPI YoY
- ▼ -373.34%
- Current HPI
- 286.574
- Rent YoY
- —
- Metro
- Philadelphia-Camden-Wilmington, PA-NJ-DE-MD
- State GDP YoY
- ▲ 1.68%
- F500 in state
- 34
Industry mix (Fortune 500 HQ in PA)
| Industry | F500 HQs | Revenue |
|---|---|---|
| Healthcare | 2 | $309B |
|
||
| Insurance | 2 | $27B |
|
||
| Telecommunications / Media | 1 | $124B |
|
||
| Industrial Distribution | 1 | $22B |
|
||
| Financial Services | 1 | $20B |
|
||
| Chemicals / Materials | 1 | $18B |
|
||
Price history
-26.4% since first listed12 events — show timeline
- 2026-04-14 Price Changed $265,000 BRIGHT MLS
- 2026-03-11 Price Changed $315,000 BRIGHT MLS
- 2026-02-25 Price Changed $415,000 BRIGHT MLS
- 2026-02-25 Pending — BRIGHT MLS
- 2026-02-25 Price Changed $315,000 BRIGHT MLS
- 2026-02-10 Relisted — BRIGHT MLS
- 2026-02-10 Listed — BRIGHT MLS
- 2026-02-10 Listed $549,900 BRIGHT MLS
- 2004-12-09 Sold (Public Records) $280,000 Public Records
- 2004-11-23 Sold (MLS) $280,000 BRIGHT MLS
- 2002-12-29 Listing Removed — BRIGHT MLS
- 2002-09-21 Listed $359,990 BRIGHT MLS
Property tax history
+1.5%/yrLatest (2026): $5,305 · +5.7% YoY. Source: county tax records.
Cash-flow waterfall
monthlySold comps — $/sqft
last 12 mo · ≤1 miLoading sold comps…