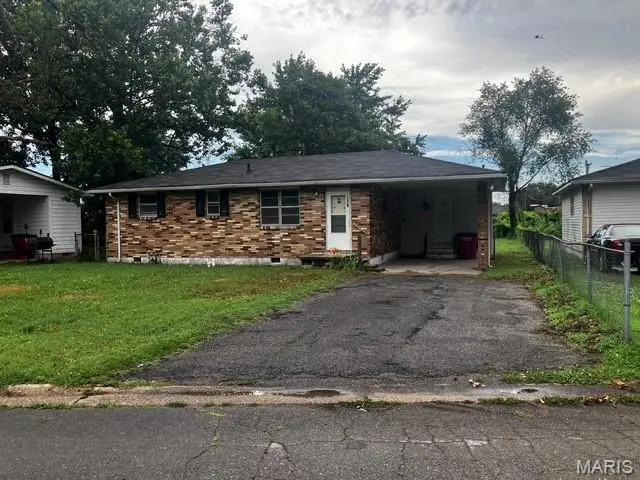
170 Lee Ave · Sikeston, MO
Flood risk 6/10 · Moderate
- FEMA flood zone
- X
- Chance of flooding over 30 yrs
- 0.71%
- Est. flood insurance / yr
- $507 – $1,088
Fire risk 1/10 · Minimal
- Est. fire insurance / yr
- $1,054 – $1,958
Heat risk 6/10 · Moderate
- Hot days now (above 108°F)
- 7 days/yr
- Hot days in 30 yrs
- 21 days/yr
Wind risk 3/10 · Minor
- Chance of severe wind over 30 yrs
- 5.0%
Air-quality risk 2/10 · Minimal
- Unhealthy air days now
- 0 days/yr
- Unhealthy air days in 30 yrs
- 1 days/yr
Risk factors via First Street. Map © Google.
Why this score? — see what drove the B- grade
The composite is a weighted blend of 9 inputs, each scored 0–100. Each bar is that input's sub-score; the figure is the points it added to the 100-point composite (weight × sub-score).
- Cash flow +30.0/30.0
- DSCR +10.0/10.0
- 1% rule +9.8/10.0
- ARV discount +7.5/15.0
- Livability +3.2/5.0
- Schools +2.8/10.0
- Rent growth +2.5/5.0
- Condition / age +2.5/5.0
- Appreciation +0.0/10.0
$60,000
🖨 Deal sheet 📄 Offer letter ✓ Due diligence
Listing remarks
3 Bedroom Brick Home with Fenced Backyard This brick exterior home offers 3 bedrooms, 1 bathroom, a comfortable living room, kitchen with dining area, and a separate laundry room. The property also features an attached one-car carport and a chain-link fenced backyard, providing a secure area for children, pets, or outdoor activities. Conveniently designed with practical living spaces, this home presents an excellent opportunity for owner-occupants or investors. -All offers must be entered through propoffers.com.
Key facts
- Attached carport
- Brick home
- Fenced backyard
Tags
Property features AI
Exterior
- Parking: Carport (1 space)
- Utilities: Public water; Public sewer; Electric service (220 volts); Electricity connected; Water available; Sewer available
- Home design: Single-family residential home; One story
- Construction: Brick construction
- Exterior features: City lot
Interior
- Bedrooms: 3 bedrooms (all on the main level)
- Bathrooms: 1 full bathroom
- Interior features: Forced air heating; Central air conditioning
Neighborhood map
What this means for you Summary
Snapshot
- This is a 3-bed/1.0-bath other listed at $60k.
Deal economics
- At list price, monthly cash flow is $337 ($4k/yr) — positive.
- The deal already cash-flows at list — no discount required.
- Meets the 1% rule at list price ($890 rent vs $60k).
- Cap rate 13.0% vs local median 4.0% in Sikeston — top-decile yield for the area; either an underpriced asset or a hidden risk that comps aren't pricing in. Stress-test before assuming the spread holds.
Location & tenants
- Location reads 64/100 on livability (#319 in MO) — a middle-class / working-renter tenant base. Strengths: cost of living A+, housing A+, health & safety A+; Watch: employment D, crime F, amenities F.
- Sikeston R-6 (town): math 33% / reading 34% proficiency, ranked #243 of 324 in MO (top 75%) — families likely to look elsewhere, expect single-tenant / working-renter base with shorter leases; 61% free/reduced lunch — lower-income household profile, screen leases tightly.
- Zoned schools: Sikeston Senior High School (math 40% / reading 48%, grade F, #205 of 521 statewide, top 40%, 1,009 students, 100% FRL) — zoned schools average 100% FRL vs 61% district-wide (39 pts higher); higher-poverty schools than district average — tighter screening recommended.
- Market conditions: 168 active listings in the ZIP; 1 comparable units currently listed for rent nearby; 123 units permitted in Scott County in 2024 (32 in 5+ unit buildings).
Forward outlook
- Local home prices are declining (-3.0%/yr); year-one equity from $415 of loan paydown is wiped out by about $2k of value loss. Plan a longer hold.
- Scott County population projected at -16% by 2050 — secular population decline; favor cash flow + early exit over multi-decade hold.
- At projected returns (-3.0% appreciation + 3.0% rent growth), your $17k cash investment doubles in ~6 years — after that, you're playing with house money.
Negotiation context
- Only 7 days on market — expect competitive offers; lowballing is unlikely to land.
- 2 sale attempts with the ask held roughly flat each time — persistent listings suggest the price (not the market) is what's stuck; bring a comps-based counter.
Risks & watch-outs
- Climate carrying-cost: major flood risk; extreme-heat days projected 7→21/yr by 2055 (HVAC capex compounding) — expect insurance premiums to compound above CPI over the hold.
Questions for the listing agent
- Built in 1961 — when were the roof, HVAC, electrical panel, plumbing, and water heater last replaced?
- Is there a deadline driving the sale (1031 exchange, divorce, estate, relocation)? That informs how much negotiation room exists.
- Schools are D-rated, which usually means shorter tenancies and higher turnover. Who's the typical renter profile here, and what's been the actual vacancy rate?
- Crime grade is F in this area — have there been break-ins, vandalism, or insurance claims at this property in the last 3 years? What carrier currently insures it and at what premium?
- What's the average days-on-market for RENTAL listings here right now (not sales)? A rising rental-DOM trend means longer vacancies and softer asking-rent achievability than the comps imply.
- What's the recent tenant-quality profile in this submarket — average credit score on applications, eviction rate, late-payment / NSF rate, and stable-employment percentage? A property-management company in the area should have these aggregated.
- How much new for-sale + rental construction is in the pipeline within 1–3 miles? Heavy new supply typically softens prices + rents 12–24 months out; constrained supply supports both.
Investment metrics
- 1% rule
- 1.48% ✓
- Cap rate
- 13.02%
- Cash-on-cash
- 24.04%
- DSCR
- 2.07
- GRM
- 5.6
CMA / ARV
No comps found within radius.
Projected returns pro-forma
-3.0% appreciation · 3.0% rent growth · sell at horizon
- IRR
- 17.2%
- Equity multiple
- 1.70×
- Total profit
- $11,697
- Equity at exit
- $8,946
- IRR
- 25.7%
- Equity multiple
- 3.25×
- Total profit
- $37,721
- Equity at exit
- $5,188
Cash invested: $16,800 (down + closing). Projections, not guarantees.
Landlord ↔ Tenant lean methodology
- Overall (STATE)
- 81 Strongly Landlord-Friendly
- State Missouri
- 81 Strongly Landlord-Friendly · R+10
- County
- — inherits STATE
- City
- — inherits STATE
ZIP-level market 63801
- Home prices YoY
- -11.6%
- Active inventory
- 168
- Price-to-rent
- 5.6×
Monthly cashflow live
- Estimated rent
- $890 medium interval (Pro) →
- Mortgage (P&I)
- −$315
- Tax from tax record
- −$27 /mo · $323/yr
- Insurance
- −$25
- HOA
- −$0
- Vacancy / Maint / Mgmt
- −$187
- Net cashflow
- $337
Break-even live
UW: 25.0% down · 7.5% · 30yr · 1.5% tax · 5.0% vac · 8.0% maint · 8.0% mgmt
Financing live
Cash to close
- Down payment
- $15,000
- Closing costs
- $1,800
- Reserves months
- —
- Total cash needed
- —
Loan-product check · same deal, 3 products live
Conventional
25% down · 7.5% · 30yr
- Down + closing
- —
- Monthly P&I
- —
- Monthly cashflow
- —
- DSCR
- —
- Eligible?
- —
Personal DTI + credit; lowest rate.
DSCR
20% down · 8.5% · 30yr
- Down + closing
- —
- Monthly P&I
- —
- Monthly cashflow
- —
- DSCR
- —
- Eligible?
- —
No personal income docs; deal must DSCR.
Hard money
10% down · 12.0% · 12mo
- Down + closing
- —
- Monthly P&I
- —
- Monthly cashflow
- —
- DSCR
- —
- Eligible?
- —
Short-term bridge; refi at stabilization.
Rent comps 1 comps
| Address | Beds | Baths | Sqft | Rent | $/sqft | DOM | Units | Dist |
|---|---|---|---|---|---|---|---|---|
| 1203 - 1207 Lawrence Sikeston, MO | 2.0 | 1.5 | 1100 | $890 | $0.81 | 43d | 1 | 1.41mi |
Listing history 8 events
-
2026-06-19days on market $60,000 Active 7 DOM
-
2026-06-18days on market $60,000 Active 6 DOM
-
2026-06-17days on market $60,000 Active 5 DOM
-
2026-06-17remarks 517-char remark
-
2026-06-16days on market $60,000 Active 4 DOM
-
2026-06-15days on market $60,000 Active 3 DOM
-
2026-06-13remarks 465-char remark
-
2026-06-13$60,000 Active 1 DOM
ⓘ Source: listings_history table (triggers on properties + properties_extension) + one-shot
backfill from property_details.listing_events for pre-trigger history.
Tax reassessment forecast MO · Resets to sale price
- Current annual tax
- $323 · $27/mo
- Projected year-2 tax
- $582 · $48/mo
- Expected delta
- +$259/yr (+$22/mo · 80.3%)
ⓘ Screening estimate from a state-policy table — verify with the county assessor before closing.
Climate risk First Street
- Flood 6/10 Major FEMA zone X · 71% chance over 30 yrs
- Wildfire 1/10 Low
- Heat 6/10 Major 7 d/yr ≥108°F today · 21 d/yr by 30 yrs out
- Wind 3/10 Moderate 5% chance of damaging wind over 30 yrs
- Air quality 2/10 Low 0 unhealthy d/yr today · 1 by 30 yrs out
Nearby sold comps map
Loading sold comps map…
Walkable amenities ~0.75 mi
Loading nearby amenities…
Taxation est. · year 1
- Rental income
- $10,680
- − Mortgage interest
- −$3,361
- − Property taxes
- −$323
- − Insurance
- −$300
- − Repairs & maintenance
- −$854
- − Management
- −$854
- − Depreciation
- −$1,745
- Taxable income
- $3,242
- Est. tax owed @ 24.0%
- −$778
- After-tax cash flow
- $3,261/yr
For passive investors: Depreciation is non-cash, so a rental often shows a tax loss while cash-flowing — sheltering income. Rental losses are passive: they offset passive income freely, and up to $25,000/yr can offset ordinary (W-2) income if you actively participate and your MAGI is under $100k (phasing out to $0 by $150k); unused losses carry forward. On sale, claimed depreciation is recaptured at up to 25%, and gains may owe capital-gains tax (a 1031 exchange can defer both). Figures are a year-1 estimate at your 24.0% rate — not tax advice; consult a CPA.
Schools (NCES district)
- District
- Sikeston R-6
- NCES district ID
- 2928260
- Math proficiency
- 33% ▼ -4.00%
- Reading proficiency
- 34% ▼ -2.00%
- Median HH income
- $36,800
- Composite
- 27.85/100
- National rank
- #6879
- State rank
- #243 of 324 in MO
Livability — Sikeston
- Score
- 64/100
- State rank
- #319
- US rank
- #14606
Category grades
Schools grade is shown separately in the Schools card above.
Census & demographics
- Census place
- Sikeston, MO
- Population (ZIP)
- 22,121
Population outlook (Scott County) Hauer SSP2
- Today (2025)
- 37,964 people
- By 2030
- 36,963 · -2.6%
- By 2040
- 34,632 · -8.8%
- By 2050
- 32,024 · -15.6%
- By 2075
- 25,250 · -33.5%
- By 2100
- 18,078 · -52.4%
Race, ethnicity, and origin ACS 2023
- Neighborhood character
- Predominantly White (73%)
- Race & ethnicity
- White 73% Black 19% Two or more races 6% Hispanic / Latino 2%
- Common ancestry
- Slovak 2% Lithuanian 1% Italian 1%
- Foreign-born
- 1% · Canada
- Languages at home
- 96% English-only · Spanish 2% Other Indo-European 1%
Political lean MEDSL · Scott
- 2024 margin
- Solid R (+58.9) · D 20.2% · R 79.2%
- 2008→2024 swing
- -29.5pp toward R · 2008: -29.4pp · 2024: -58.9pp
- All cycles
- 2024: R+58.9 2020: R+56.5 2016: R+55.6 2012: R+38.2 2008: R+29.4
Not yet ingested
- Civics
- —
Market trends
- HPI YoY
- ▼ -18.54%
- Current HPI
- 141.0868
- Rent YoY
- —
- Metro
- —
- State GDP YoY
- ▲ 1.84%
- F500 in state
- 20
Industry mix (Fortune 500 HQ in MO)
| Industry | F500 HQs | Revenue |
|---|---|---|
| Healthcare | 1 | $163B |
|
||
| Insurance | 1 | $21B |
|
||
| Industrial Technology | 1 | $17B |
|
||
| Retail | 1 | $16B |
|
||
| Industrial Distribution | 1 | $10B |
|
||
| Utilities | 1 | $9B |
|
||
Price history
+20.2% since first listed4 events — show timeline
- 2026-06-12 Listed $60,000 MARIS as Distributed by MLS Grid
- 2026-02-09 Pending — MARIS as Distributed by MLS Grid
- 2026-01-24 Listed $49,900 MARIS as Distributed by MLS Grid
- 2004-01-01 Sold (Public Records) — Public Records
Property tax history
+3.0%/yrLatest (2025): $323 · +30.1% YoY. Source: county tax records.
Cash-flow waterfall
monthlySold comps — $/sqft
last 12 mo · ≤1 miLoading sold comps…