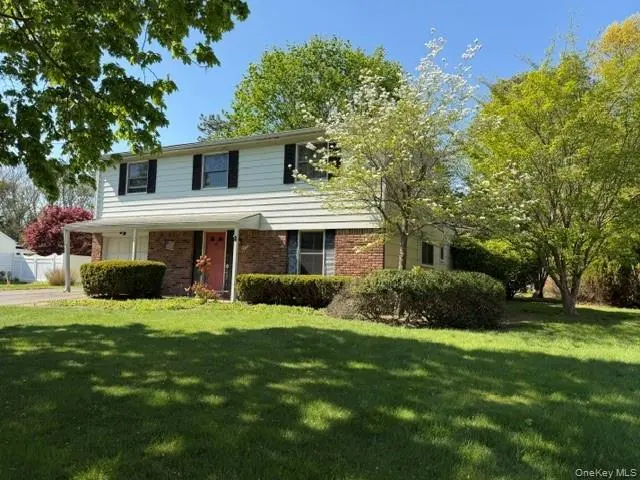
5 Broadhurst St · Coram, NY
Flood risk 1/10 · Minimal
- FEMA flood zone
- X (unshaded)
- Chance of flooding over 30 yrs
- 0.0%
- Est. flood insurance / yr
- $473 – $860
Fire risk 1/10 · Minimal
- Est. fire insurance / yr
- $691 – $1,283
Heat risk 5/10 · Moderate
- Hot days now (above 93°F)
- 7 days/yr
- Hot days in 30 yrs
- 17 days/yr
Wind risk 6/10 · Moderate
- Chance of severe wind over 30 yrs
- 77.0%
Air-quality risk 4/10 · Minor
- Unhealthy air days now
- 3 days/yr
- Unhealthy air days in 30 yrs
- 5 days/yr
Risk factors via First Street. Map © Google.
Why this score? — see what drove the D grade
The composite is a weighted blend of 9 inputs, each scored 0–100. Each bar is that input's sub-score; the figure is the points it added to the 100-point composite (weight × sub-score).
- ARV discount +14.2/15.0
- Cash flow +8.8/30.0
- Schools +6.2/10.0
- Livability +3.3/5.0
- Rent growth +2.6/5.0
- Condition / age +2.5/5.0
- DSCR +2.4/10.0
- 1% rule +1.9/10.0
- Appreciation +0.0/10.0
$649,998
🖨 Deal sheet 📄 Offer letter ✓ Due diligence
Listing remarks
Spacious split-level home in desirable Port Jefferson Station, set on a quiet residential street close to public transportation, shopping, dining, and everyday conveniences. This inviting home offers 4 bedrooms and 1.5 baths with a comfortable, functional layout. The eat-in kitchen features hi-hat lighting and plenty of room for casual dining. A large family room provides excellent space for relaxing or entertaining, while the living room features sliding glass doors leading to the rear brick patio. High vaulted ceilings create an open and airy feel, and the generous half-acre lot offers ample outdoor space for entertaining, recreation, gardening, or future possibilities. Updated anderson W
Key facts
- Large family room
- Sliding glass doors
- Eat-in kitchen
Tags
Property features AI
Exterior
- Parking: Driveway; 1-car garage; No carport
- Utilities: Electricity connected (PSEG); Water connected; Phone connected; Cesspool sewer
- Home design: Single-family residence; Tri-level; Full attic
- Construction: Aluminum siding; Brick and frame construction
- Exterior features: Mailbox; Back yard; Front yard; Patio; Level lot; Private lot; Near public transit; Located on a cul-de-sac
Interior
- Kitchen: Oven; Range; Refrigerator
- Bedrooms: Tri-level layout (total 8 rooms)
- Bathrooms: 1 full bathroom; 1 half bathroom
- Heating & cooling: Oil heating; Baseboard heat; No central air
- Interior features: Eat-in kitchen; Entrance foyer; Formal dining room; Patio
- Laundry & utility: Laundry in basement
Neighborhood map
What this means for you Summary
Snapshot
- This is a 4-bed/1.5-bath single-family listed at $650k.
Deal economics
- At list price, monthly cash flow is $-538 ($-6k/yr) — negative.
- To cash-flow at today's rent, offer at most $555k (14.6% below list).
- To meet the 1% rule (rent ≥ 1% of price), the offer needs to be $448k (31.1% below list).
- Recommended offer: $448k (31.1% below list) — sets the bar for 1% rule.
- Cap rate 5.3% vs local median 3.5% in Coram — top-decile yield for the area; either an underpriced asset or a hidden risk that comps aren't pricing in. Stress-test before assuming the spread holds.
Location & tenants
- Location reads 66/100 on livability (#646 in NY) — a middle-class / working-renter tenant base. Strengths: employment A+, housing A+, health & safety B; Watch: amenities F, commute F, cost of living F.
- Brookhaven-Comsewogue Union Free School District (suburban): math 62% / reading 76% proficiency, ranked #123 of 590 in NY (top 21%) — acceptable for families but not a draw, mixed tenant base, ~2y average lease; only 19% free/reduced lunch — higher-income household profile.
- Zoned schools: Clinton Avenue School (441 students, 43% FRL); John F Kennedy Middle School (math 37% / reading 52%, grade D, #348 of 729 statewide, top 50%, 822 students, 35% FRL); Comsewogue High School (math 86% / reading 92%, grade A+, #288 of 1,100 statewide, top 27%, 1,153 students, 30% FRL) — zoned schools average 36% FRL vs 19% district-wide (17 pts higher); higher-poverty schools than district average — tighter screening recommended.
- Market conditions: Rents flat; 142 active listings in the ZIP; 2 comparable units currently listed for rent nearby; high-income renter base; 1,366 units permitted in Suffolk County in 2024 (216 in 5+ unit buildings).
- This rent runs 45% of the median local income ($121k/yr) — at the standard rent-burdened threshold; future hikes will face affordability resistance.
Forward outlook
- Local home prices are declining (-3.0%/yr); year-one equity from $4k of loan paydown is wiped out by about $20k of value loss. Plan a longer hold.
- Suffolk County population projected to shrink 5% by 2050 — rents likely to lag national; underwrite the cash flow, not the appreciation.
Negotiation context
- It's been on market 45 days — a 3% lower offer ($630k) is reasonable based on typical stale-listing flexibility.
Risks & watch-outs
- Climate carrying-cost: major wind risk, 77% chance of damaging wind over 30y; extreme-heat days projected 7→17/yr by 2055 (HVAC capex compounding) — expect insurance premiums to compound above CPI over the hold.
Questions for the listing agent
- What do current leases actually rent for vs. the listed asking? Can we see a recent rent roll and the last 12 months of T-12 income?
- It's been on market 45 days. Have you received any prior offers? Is the seller open to a 31% concession, seller financing, or rate buy-down credit?
- Built in 1975 — when were the roof, HVAC, electrical panel, plumbing, and water heater last replaced?
- Is there a deadline driving the sale (1031 exchange, divorce, estate, relocation)? That informs how much negotiation room exists.
- Schools are B-rated — typically a magnet for longer-tenancy family renters. What's the average tenant stay here, and is there a school-zone premium baked into asking?
- The area grade is low — what's the realistic commute time and amenity access for the typical tenant pool here? Any planned neighborhood developments (good or bad) we should know about?
- What's the average days-on-market for RENTAL listings here right now (not sales)? A rising rental-DOM trend means longer vacancies and softer asking-rent achievability than the comps imply.
- What's the recent tenant-quality profile in this submarket — average credit score on applications, eviction rate, late-payment / NSF rate, and stable-employment percentage? A property-management company in the area should have these aggregated.
- How much new for-sale + rental construction is in the pipeline within 1–3 miles? Heavy new supply typically softens prices + rents 12–24 months out; constrained supply supports both.
Investment metrics
- 1% rule
- 0.69% ✗
- Cap rate
- 5.30%
- Cash-on-cash
- -3.55%
- DSCR
- 0.84
- GRM
- 12.1
CMA / ARV
- ARV (median comp)
- $764,474
- List price
- $649,998
- Delta
- -14.97%
- Verdict
- UNDERPRICED
- Comps
- 20 within 1.0 mi
Show comp detail 12 sales within ~0.75 mi
| Address | Dist | Beds/Ba | Sqft | Sold | Price | $/sf | Match |
|---|---|---|---|---|---|---|---|
| 19 Osborne Ave | 0.43mi | 4/1.5 | 1,730 (-2%) | 1mo | $750,000 | $434 | 76 |
| 18 Doane Ave | 0.16mi | 3/1.5 (-1) | 1,582 (-10%) | 6mo | $615,000 | $389 | 65 |
| 11 Vermont Ave | 0.39mi | 3/2.5 (-1) | 1,858 (+5%) | 2mo | $785,000 | $422 | 62 |
| 20 Gabon Ln | 0.64mi | 4/2.5 | 1,788 (+1%) | 4mo | $579,000 | $324 | 60 |
| 23 Wheat Path Rd W | 0.67mi | 4/2.0 | 1,808 (+2%) | 7mo | $620,000 | $343 | 57 |
| 17 Felway Dr | 0.74mi | 3/3.0 (-1) | 1,750 (-1%) | 0mo | $700,000 | $400 | 53 |
| 30 Apex Dr | 0.69mi | 4/3.0 | 1,700 (-4%) | 4mo | $675,000 | $397 | 52 |
| 5 Aspen St | 0.56mi | 4/1.5 | 1,560 (-12%) | 8mo | $580,000 | $372 | 48 |
| 27 Westbrook Rd | 0.74mi | 3/2.0 (-1) | 1,659 (-6%) | 1mo | $675,000 | $407 | 48 |
| 15 Autumn Dr | 0.64mi | 4/1.5 | 1,988 (+13%) | 2mo | $770,000 | $387 | 47 |
| 33 Kathleen Cres | 0.55mi | 3/2.0 (-1) | 1,582 (-10%) | 9mo | $595,000 | $376 | 43 |
| 19 Goodwin Ln | 0.64mi | 3/2.0 (-1) | 1,500 (-15%) | 1mo | $575,000 | $383 | 37 |
Match score weights: distance 35% · size 25% · config 20% · recency 20%. Top-matched comps best support the ARV.
Projected returns pro-forma
-3.0% appreciation · 0.39% rent growth · sell at horizon
- IRR
- -24.9%
- Equity multiple
- 0.17×
- Total profit
- $-151,268
- Equity at exit
- $96,917
- IRR
- -29.8%
- Equity multiple
- -0.22×
- Total profit
- $-221,276
- Equity at exit
- $56,200
Cash invested: $181,999 (down + closing). Projections, not guarantees.
Landlord ↔ Tenant lean methodology
- Overall (STATE)
- 15 Strongly Tenant-Friendly
- State New York
- 15 Strongly Tenant-Friendly · D+10
- County
- — inherits STATE
- City
- — inherits STATE
ZIP-level market 11776
- Rents YoY
- 0.4%
- Active inventory
- 142
- Price-to-rent
- 12.1×
Monthly cashflow live
- Estimated rent
- $4,478 medium interval (Pro) →
- Mortgage (P&I)
- −$3,409
- Tax from tax record
- −$397 /mo · $4,759/yr
- Insurance
- −$271
- HOA
- −$0
- Vacancy / Maint / Mgmt
- −$940
- Net cashflow
- $-538
Break-even live
UW: 25.0% down · 7.5% · 30yr · 1.5% tax · 5.0% vac · 8.0% maint · 8.0% mgmt
Financing live
Cash to close
- Down payment
- $162,500
- Closing costs
- $19,500
- Reserves months
- —
- Total cash needed
- —
Loan-product check · same deal, 3 products live
Conventional
25% down · 7.5% · 30yr
- Down + closing
- —
- Monthly P&I
- —
- Monthly cashflow
- —
- DSCR
- —
- Eligible?
- —
Personal DTI + credit; lowest rate.
DSCR
20% down · 8.5% · 30yr
- Down + closing
- —
- Monthly P&I
- —
- Monthly cashflow
- —
- DSCR
- —
- Eligible?
- —
No personal income docs; deal must DSCR.
Hard money
10% down · 12.0% · 12mo
- Down + closing
- —
- Monthly P&I
- —
- Monthly cashflow
- —
- DSCR
- —
- Eligible?
- —
Short-term bridge; refi at stabilization.
Rent comps 2 comps
| Address | Beds | Baths | Sqft | Rent | $/sqft | DOM | Units | Dist |
|---|---|---|---|---|---|---|---|---|
| 10 Todd Ct Port Jefferson Station, NY | 4.0 | 2.5 | 2217 | $4,500 | $2.03 | 19d | 1 | 1.13mi |
| 52 Huron St Port Jefferson Station, NY | 3.0 | 2.0 | 2161 | $4,350 | $2.01 | 1d | 1 | 1.49mi |
Listing history 15 events
-
2026-06-18days on market $649,998 Active 45 DOM
-
2026-06-17days on market $649,998 Active 44 DOM
-
2026-06-16days on market $649,998 Active 43 DOM
-
2026-06-15days on market $649,998 Active 42 DOM
-
2026-06-13days on market $649,998 Active 40 DOM
-
2026-06-09days on market $649,998 Active 36 DOM
-
2026-06-08days on market $649,998 Active 35 DOM
-
2026-06-07days on market $649,998 Active 34 DOM
-
2026-06-04days on market $649,998 Active 31 DOM
-
2026-06-03days on market $649,998 Active 30 DOM
-
2026-06-02days on market $649,998 Active 29 DOM
-
2026-06-01days on market $649,998 Active 28 DOM
-
2026-05-31days on market $649,998 Active 27 DOM
-
2026-05-05price $649,998 827-char remark
-
2026-05-04$549,998 Active 827-char remark
ⓘ Source: listings_history table (triggers on properties + properties_extension) + one-shot
backfill from property_details.listing_events for pre-trigger history.
Tax reassessment forecast NY · Partial reset (capped growth)
- Current annual tax
- $4,759 · $397/mo
- Projected year-2 tax
- $7,872 · $656/mo
- Expected delta
- +$3,113/yr (+$259/mo · 65.4%)
ⓘ Screening estimate from a state-policy table — verify with the county assessor before closing.
Climate risk First Street
- Flood 1/10 Low FEMA zone X (unshaded) · 0% chance over 30 yrs
- Wildfire 1/10 Low
- Heat 5/10 Major 7 d/yr ≥93°F today · 17 d/yr by 30 yrs out
- Wind 6/10 Major 77% chance of damaging wind over 30 yrs
- Air quality 4/10 Moderate 3 unhealthy d/yr today · 5 by 30 yrs out
Nearby sold comps map
Loading sold comps map…
Walkable amenities ~0.75 mi
Loading nearby amenities…
Taxation est. · year 1
- Rental income
- $53,737
- − Mortgage interest
- −$36,410
- − Property taxes
- −$4,759
- − Insurance
- −$3,250
- − Repairs & maintenance
- −$4,299
- − Management
- −$4,299
- − Depreciation
- −$18,909
- Taxable loss
- −$18,189
- Est. tax savings @ 24.0%
- +$4,365
- After-tax cash flow
- $-2,095/yr
For passive investors: Depreciation is non-cash, so a rental often shows a tax loss while cash-flowing — sheltering income. Rental losses are passive: they offset passive income freely, and up to $25,000/yr can offset ordinary (W-2) income if you actively participate and your MAGI is under $100k (phasing out to $0 by $150k); unused losses carry forward. On sale, claimed depreciation is recaptured at up to 25%, and gains may owe capital-gains tax (a 1031 exchange can defer both). Figures are a year-1 estimate at your 24.0% rate — not tax advice; consult a CPA.
Schools (NCES district)
- District
- Brookhaven-Comsewogue Union Free School District
- NCES district ID
- 3615780
- Math proficiency
- 62% ▼ -6.00%
- Reading proficiency
- 76% ▲ 9.00%
- Median HH income
- $84,654
- Composite
- 61.8/100
- National rank
- #733
- State rank
- #123 of 590 in NY
Livability — Coram
- Score
- 66/100
- State rank
- #646
- US rank
- #12097
Category grades
Schools grade is shown separately in the Schools card above.
Census & demographics
- Census place
- Coram, NY
- County
- Suffolk County · 679,920 people
- City population
- 28,495
- Metro
- New York-Newark-Jersey City, NY-NJ-PA
- Population (ZIP)
- 22,808
- Household income
- $120,573
- Rent vs Own
- Severe rent burden
- 648.0
Population outlook (Suffolk County) Hauer SSP2
- Today (2025)
- 1,505,262 people
- By 2030
- 1,498,318 · -0.5%
- By 2040
- 1,471,101 · -2.3%
- By 2050
- 1,424,848 · -5.3%
- By 2075
- 1,337,157 · -11.2%
- By 2100
- 1,217,720 · -19.1%
Race, ethnicity, and origin ACS 2023
- Neighborhood character
- Predominantly White (66%)
- Race & ethnicity
- White 66% Hispanic / Latino 25% Two or more races 8% Black 4% Asian 3%
- Hispanic origin (detail)
- Mexican 1% Puerto Rican 4% Dominican 10%
- Common ancestry
- Romanian 5% Scotch-Irish 2% Portuguese 1%
- Foreign-born
- 14% · Canada, Jamaica, South Korea
- Languages at home
- 77% English-only · Spanish 16% Other Indo-European 4% Other Asian/Pacific 1%
Political lean MEDSL · Suffolk
- 2024 margin
- Lean R (+10.0) · D 45.0% · R 55.0%
- 2008→2024 swing
- -16.0pp toward R · 2008: 6.0pp · 2024: -10.0pp
- All cycles
- 2024: R+10.0 2020: R+0.0 2016: R+8.2 2012: D+2.9 2008: D+6.0
Not yet ingested
- Civics
- —
Market trends
- HPI YoY
- ▼ -656.56%
- Current HPI
- 343.598
- Rent YoY
- ▲ 0.39%
- Metro
- New York-Newark-Jersey City, NY-NJ-PA
- State GDP YoY
- ▲ 2.60%
- F500 in state
- 92
Industry mix (Fortune 500 HQ in NY)
| Industry | F500 HQs | Revenue |
|---|---|---|
| Financial Services | 10 | $950B |
|
||
| Consumer Goods | 9 | $162B |
|
||
| Insurance | 4 | $225B |
|
||
| Telecommunications | 2 | $144B |
|
||
| Pharmaceuticals | 2 | $112B |
|
||
| Media / Entertainment | 2 | $69B |
|
||
Price history
+18.2% since first listed2 events — show timeline
- 2026-05-05 Price Changed $649,998 OneKey® MLS as Distributed by MLS Grid
- 2026-05-04 Listed $549,998 OneKey® MLS as Distributed by MLS Grid
Property tax history
-2.7%/yrLatest (2025): $4,759 · +0.0% YoY. Source: county tax records.
Cash-flow waterfall
monthlySold comps — $/sqft
last 12 mo · ≤1 miLoading sold comps…