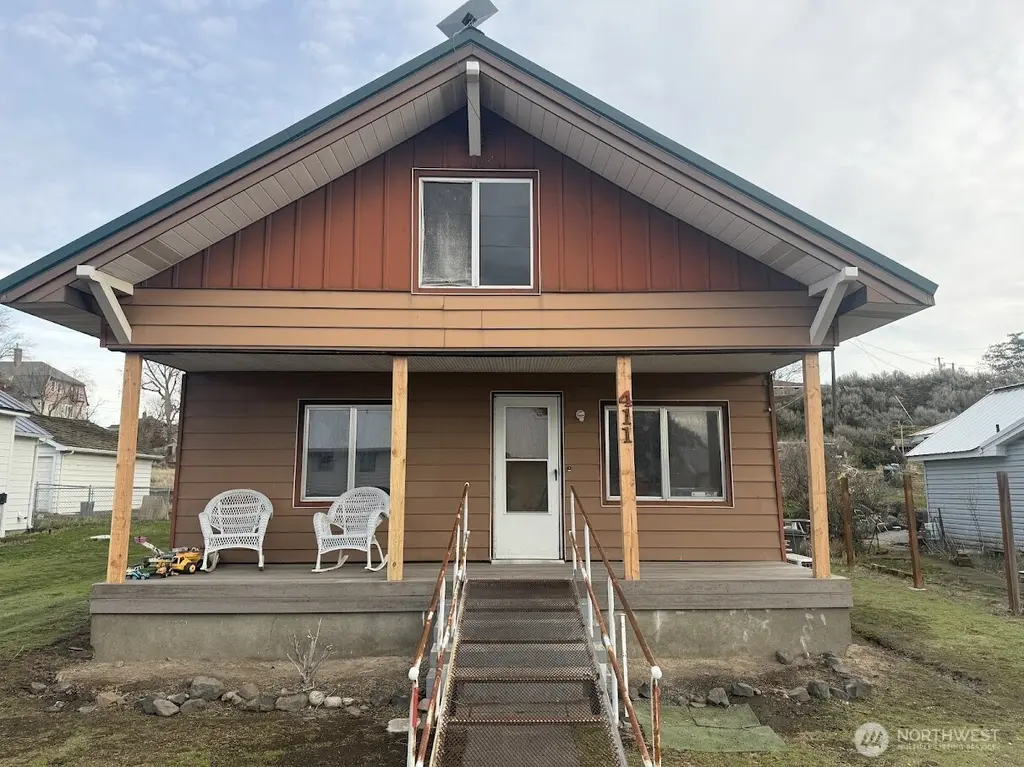
411 S Divisioon St · Odessa, WA
Flood risk 1/10 · Minimal
- FEMA flood zone
- —
- Chance of flooding over 30 yrs
- 0.0%
- Est. flood insurance / yr
- —
Fire risk 7/10 · Major
- Est. fire insurance / yr
- $604 – $1,122
Heat risk 4/10 · Minor
- Hot days now (above 96°F)
- 7 days/yr
- Hot days in 30 yrs
- 15 days/yr
Wind risk 1/10 · Minimal
- Chance of severe wind over 30 yrs
- —
Air-quality risk 8/10 · Major
- Unhealthy air days now
- 15 days/yr
- Unhealthy air days in 30 yrs
- 15 days/yr
Risk factors via First Street. Map © Google.
Why this score? — see what drove the D grade
The composite is a weighted blend of 9 inputs, each scored 0–100. Each bar is that input's sub-score; the figure is the points it added to the 100-point composite (weight × sub-score).
- ARV discount +15.0/15.0
- Cash flow +8.9/30.0
- Schools +4.2/10.0
- Appreciation +3.6/10.0
- Livability +3.5/5.0
- DSCR +2.5/10.0
- Rent growth +2.5/5.0
- Condition / age +2.5/5.0
- 1% rule +1.7/10.0
$159,000
🖨 Deal sheet (PDF) 📄 Offer letter ✓ Due diligence
Listing remarks
This charming property presents an excellent opportunity for both first-time homebuyers and savvy investors. Its prime location and desirable features make it an attractive option in today's market. The property boasts a 2-bed, 1-bath home, which includes 3 new mini-splits for heating and cooling. A big kitchen and primary bedroom with a large walk in shower. The kitchen, living room, and front bedroom all have newer laminate flooring. The property features a spacious, large storage shed designed to accommodate extensive storage needs, providing practical space solutions for various belongings. The backyard boasts an attractive, well-designed deck for out door living. The front of the house
Key facts
- Well designed deck
- New mini splits
- Prime location
Tags
Neighborhood map
What this means for you Summary
Snapshot
- This is a 2-bed/1.0-bath single-family listed at $159k.
Deal economics
- At list price, monthly cash flow is $-129 ($-2k/yr) — negative.
- To cash-flow at today's rent, offer at most $136k (14.3% below list).
- To meet the 1% rule (rent ≥ 1% of price), the offer needs to be $106k (33.5% below list).
- Recommended offer: $106k (33.5% below list) — sets the bar for 1% rule.
Location & tenants
- Location reads 69/100 on livability (#263 in WA) — a middle-class / working-renter tenant base. Strengths: cost of living A+, housing A+, health & safety A+; Watch: employment D+, crime F, amenities F.
- Odessa School District (rural): math 35% / reading 60% proficiency, ranked #166 of 291 in WA (top 57%) — families likely to look elsewhere, expect single-tenant / working-renter base with shorter leases.
- Zoned schools: P C Jantz Elementary (124 students, 53% FRL); Odessa High School (112 students, 56% FRL) — zoned schools average 55% FRL vs 37% district-wide (18 pts higher); higher-poverty schools than district average — tighter screening recommended.
- Market conditions: 18 active listings in the ZIP; 49 units permitted in Lincoln County in 2024 (0 in 5+ unit buildings).
Forward outlook
- Local home prices are declining (-2.9%/yr); year-one equity from $1k of loan paydown is wiped out by about $5k of value loss. Plan a longer hold.
- Lincoln County population projected at -20% by 2050 — secular population decline; favor cash flow + early exit over multi-decade hold.
Negotiation context
- It's been on market 156 days — a 12% lower offer ($140k) is reasonable based on typical stale-listing flexibility.
- 5 sale attempts since 25y ago; this cycle's ask has dropped $40k (20%) from the opening price — seller is motivated, your offer sets the floor, not the list.
- Current owner paid $34k; list at $159k implies a 368% gain — meaningful room to come down on a strong offer.
Risks & watch-outs
- Watch-outs: built in 1915 — expect roof / HVAC / electrical / plumbing capex.
- Climate carrying-cost: major wildfire risk — expect insurance premiums to compound above CPI over the hold.
Questions for the listing agent
- What do current leases actually rent for vs. the listed asking? Can we see a recent rent roll and the last 12 months of T-12 income?
- It's been on market 156 days. Have you received any prior offers? Is the seller open to a 33% concession, seller financing, or rate buy-down credit?
- Built in 1915 — when were the roof, HVAC, electrical panel, plumbing, and water heater last replaced?
- Why hasn't it sold? Are there any deal-killer items the seller is aware of (foundation, flood, title, zoning, code violations)?
- Is there a deadline driving the sale (1031 exchange, divorce, estate, relocation)? That informs how much negotiation room exists.
- Crime grade is F in this area — have there been break-ins, vandalism, or insurance claims at this property in the last 3 years? What carrier currently insures it and at what premium?
- The area grade is low — what's the realistic commute time and amenity access for the typical tenant pool here? Any planned neighborhood developments (good or bad) we should know about?
- What's the average days-on-market for RENTAL listings here right now (not sales)? A rising rental-DOM trend means longer vacancies and softer asking-rent achievability than the comps imply.
- What's the recent tenant-quality profile in this submarket — average credit score on applications, eviction rate, late-payment / NSF rate, and stable-employment percentage? A property-management company in the area should have these aggregated.
- How much new for-sale + rental construction is in the pipeline within 1–3 miles? Heavy new supply typically softens prices + rents 12–24 months out; constrained supply supports both.
Investment metrics
- 1% rule
- 0.67% ✗
- Cap rate
- 5.32%
- Cash-on-cash
- -3.48%
- DSCR
- 0.85
- GRM
- 12.5
CMA / ARV
- ARV (median comp)
- $191,940
- List price
- $159,000
- Delta
- -17.16%
- Verdict
- UNDERPRICED
- Comps
- 12 within 1.0 mi
Show comp detail 5 sales within ~0.75 mi
| Address | Dist | Beds/Ba | Sqft | Sold | Price | $/sf | Match |
|---|---|---|---|---|---|---|---|
| 211 E 3Rd Ave | 0.25mi | 2/1.0 | 1,247 (+4%) | 8mo | $195,777 | $157 | 75 |
| 8 W 3rd St | 0.15mi | 3/1.0 (+1) | 1,122 (-6%) | 8mo | $167,500 | $149 | 71 |
| 311 E 1st Ave | 0.38mi | 2/1.0 | 1,134 (-6%) | 16mo | $145,000 | $128 | 60 |
| 202 N Division St | 0.43mi | 3/1.0 (+1) | 1,092 (-9%) | 7mo | $150,000 | $137 | 54 |
| 107 E 5th Ave | 0.12mi | 3/1.5 (+1) | 1,370 (+14%) | 18mo | $215,000 | $157 | 49 |
Match score weights: distance 35% · size 25% · config 20% · recency 20%. Top-matched comps best support the ARV.
Projected returns pro-forma
-2.89% appreciation · 3.0% rent growth · sell at horizon
- IRR
- -21.4%
- Equity multiple
- 0.25×
- Total profit
- $-33,294
- Equity at exit
- $24,515
- IRR
- -15.1%
- Equity multiple
- 0.12×
- Total profit
- $-39,202
- Equity at exit
- $15,139
Cash invested: $44,520 (down + closing). Projections, not guarantees.
Landlord ↔ Tenant lean methodology
- Overall (STATE)
- 28 Tenant-Leaning
- State Washington
- 28 Tenant-Leaning · D+8
- County
- — inherits STATE
- City
- — inherits STATE
ZIP-level market 99159
- Home prices YoY
- -1.0%
- Active inventory
- 18
- Price-to-rent
- 12.5×
Monthly cashflow live
- Estimated rent
- $1,058 medium interval (Pro) →
- Mortgage (P&I)
- −$834
- Tax from tax record
- −$65 /mo · $774/yr
- Insurance
- −$66
- HOA
- −$0
- Vacancy / Maint / Mgmt
- −$222
- Net cashflow
- $-129
Break-even live
Sensitivity live
| Price | -10% $-39 | -5% $-84 | +0% $-129 | +5% $-174 | +10% $-219 |
|---|---|---|---|---|---|
| Rent | -10% $-213 | -5% $-171 | +0% $-129 | +5% $-87 | +10% $-46 |
| Rate | -1.0pp $-49 | -0.5pp $-89 | base $-129 | +0.5pp $-170 | +1.0pp $-212 |
UW: 25.0% down · 7.5% · 30yr · 1.5% tax · 5.0% vac · 8.0% maint · 8.0% mgmt
Financing live
Cash to close
- Down payment
- $39,750
- Closing costs
- $4,770
- Reserves months
- —
- Total cash needed
- —
Loan-product check · same deal, 3 products live
Conventional
25% down · 7.5% · 30yr
- Down + closing
- —
- Monthly P&I
- —
- Monthly cashflow
- —
- DSCR
- —
- Eligible?
- —
Personal DTI + credit; lowest rate.
DSCR
20% down · 8.5% · 30yr
- Down + closing
- —
- Monthly P&I
- —
- Monthly cashflow
- —
- DSCR
- —
- Eligible?
- —
No personal income docs; deal must DSCR.
Hard money
10% down · 12.0% · 12mo
- Down + closing
- —
- Monthly P&I
- —
- Monthly cashflow
- —
- DSCR
- —
- Eligible?
- —
Short-term bridge; refi at stabilization.
Listing history 29 events
-
2026-06-21days on market $159,000 Active 156 DOM
-
2026-06-21days on market $159,000 Active 155 DOM
-
2026-06-18days on market $159,000 Active 153 DOM
-
2026-06-17days on market $159,000 Active 152 DOM
-
2026-06-16days on market $159,000 Active 151 DOM
-
2026-06-15days on market $159,000 Active 150 DOM
-
2026-06-15days on market $159,000 Active 149 DOM
-
2026-06-13days on market $159,000 Active 148 DOM
-
2026-06-12days on market $159,000 Active 147 DOM
-
2026-06-09days on market $159,000 Active 144 DOM
-
2026-06-08days on market $159,000 Active 143 DOM
-
2026-06-08days on market $159,000 Active 142 DOM
-
2026-06-05days on market $159,000 Active 140 DOM
-
2026-06-03days on market $159,000 Active 138 DOM
-
2026-06-02days on market $159,000 Active 137 DOM
-
2026-06-01days on market $159,000 Active 136 DOM
-
2026-05-31days on market $159,000 Active 135 DOM
-
2026-05-31pricestatus $159,000 Active 134 DOM
-
2026-03-23price $169,000
-
2026-02-20price $189,000
-
2026-01-16$199,000 Active
-
2015-08-18soldstatus $34,000
-
2014-08-12$34,500
-
2007-03-20soldstatus $30,000 Closed
-
2007-01-10historical
-
2007-01-08status
-
2006-10-25$35,000
-
2002-12-31historical
-
2001-12-20$35,000
ⓘ Source: listings_history table (triggers on properties + properties_extension) + one-shot
backfill from property_details.listing_events for pre-trigger history.
Tax reassessment forecast WA · Resets to sale price
- Current annual tax
- $774 · $65/mo
- Projected year-2 tax
- $1,558 · $130/mo
- Expected delta
- +$784/yr (+$65/mo · 101.3%)
ⓘ Screening estimate from a state-policy table — verify with the county assessor before closing.
Climate risk First Street
- Flood 1/10 Low 0% chance over 30 yrs
- Wildfire 7/10 Severe
- Heat 4/10 Moderate 7 d/yr ≥96°F today · 15 d/yr by 30 yrs out
- Wind 1/10 Low
- Air quality 8/10 Severe 15 unhealthy d/yr today · 15 by 30 yrs out
Nearby sold comps map
Loading sold comps map…
Walkable amenities ~0.75 mi
Loading nearby amenities…
Taxation est. · year 1
- Rental income
- $12,691
- − Mortgage interest
- −$8,906
- − Property taxes
- −$774
- − Insurance
- −$795
- − Repairs & maintenance
- −$1,015
- − Management
- −$1,015
- − Depreciation
- −$4,625
- Taxable loss
- −$4,441
- Est. tax savings @ 24.0%
- +$1,066
- After-tax cash flow
- $-483/yr
For passive investors: Depreciation is non-cash, so a rental often shows a tax loss while cash-flowing — sheltering income. Rental losses are passive: they offset passive income freely, and up to $25,000/yr can offset ordinary (W-2) income if you actively participate and your MAGI is under $100k (phasing out to $0 by $150k); unused losses carry forward. On sale, claimed depreciation is recaptured at up to 25%, and gains may owe capital-gains tax (a 1031 exchange can defer both). Figures are a year-1 estimate at your 24.0% rate — not tax advice; consult a CPA.
Schools (NCES district)
- District
- Odessa School District
- NCES district ID
- 5306120
- Math proficiency
- 35% ▼ -5.00%
- Reading proficiency
- 60% ▲ 10.00%
- Median HH income
- $45,359
- Composite
- 42.34/100
- National rank
- #6948
- State rank
- #166 of 291 in WA
Livability — Odessa
- Score
- 69/100
- State rank
- #263
- US rank
- #9057
Category grades
Schools grade is shown separately in the Schools card above.
Census & demographics
- Census place
- Odessa, WA
- Population (ZIP)
- 1,177
Population outlook (Lincoln County) Hauer SSP2
- Today (2025)
- 9,599 people
- By 2030
- 9,146 · -4.7%
- By 2040
- 8,298 · -13.6%
- By 2050
- 7,683 · -20.0%
- By 2075
- 6,790 · -29.3%
- By 2100
- 6,029 · -37.2%
Race, ethnicity, and origin ACS 2023
- Neighborhood character
- Predominantly White (89%)
- Race & ethnicity
- White 89% Two or more races 3% Hispanic / Latino 2% Black 2% Asian 2% Native American 1%
- Common ancestry
- Lithuanian 3% Iranian 2% Portuguese 1%
- Foreign-born
- 6% · Canada, China
- Languages at home
- 92% English-only · German/W. Germanic 4% Other Asian/Pacific 1% Spanish 1%
Political lean MEDSL · Lincoln
- 2024 margin
- Solid R (+50.6) · D 23.6% · R 74.2% · Other 2.2%
- 2008→2024 swing
- -20.9pp toward R · 2008: -29.6pp · 2024: -50.6pp
- All cycles
- 2024: R+50.6 2020: R+48.9 2016: R+50.2 2012: R+40.9 2008: R+29.6
Not yet ingested
- Civics
- —
Market trends
- HPI YoY
- ▼ -2.89%
- Current HPI
- 278.2447
- Rent YoY
- —
- Metro
- —
- State GDP YoY
- ▲ 4.65%
- F500 in state
- 22
Industry mix (Fortune 500 HQ in WA)
| Industry | F500 HQs | Revenue |
|---|---|---|
| Retail | 2 | $269B |
|
||
| Technology / Retail | 1 | $638B |
|
||
| Technology | 1 | $245B |
|
||
| Telecommunications | 1 | $38B |
|
||
| Food / Beverage | 1 | $36B |
|
||
| Automotive / Trucks | 1 | $34B |
|
||
Price history
+382.9% since first listed11 events — show timeline
- 2026-03-23 Price Changed $169,000 NWMLS as Distributed by MLS Grid
- 2026-02-20 Price Changed $189,000 NWMLS as Distributed by MLS Grid
- 2026-01-16 Listed $199,000 NWMLS as Distributed by MLS Grid
- 2015-08-18 Sold (MLS) $34,000 NWMLS as Distributed by MLS Grid
- 2014-08-12 Listed $34,500 NWMLS as Distributed by MLS Grid
- 2007-03-20 Sold (MLS) $30,000 NWMLS as Distributed by MLS Grid
- 2007-01-10 Delisted — NWMLS as Distributed by MLS Grid
- 2007-01-08 Relisted — NWMLS as Distributed by MLS Grid
- 2006-10-25 Listed $35,000 NWMLS as Distributed by MLS Grid
- 2002-12-31 Listing Removed — SPOKANEMLS as Distributed by MLS Grid
- 2001-12-20 Listed $35,000 SPOKANEMLS as Distributed by MLS Grid
Property tax history
+6.3%/yrLatest (2026): $774 · -0.7% YoY. Source: county tax records.
Cash-flow waterfall
monthlySold comps — $/sqft
last 12 mo · ≤1 miLoading sold comps…