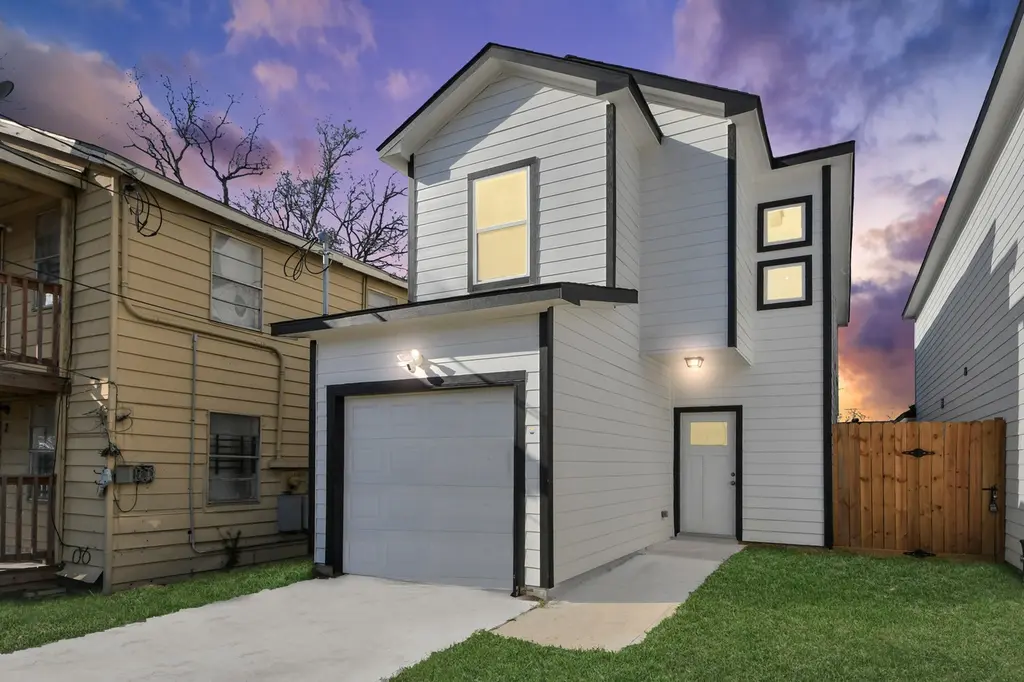
 🏗️ New Construction
4011 Elmwood St · Houston, TX
Flood risk 4/10 · Minor
- FEMA flood zone
- X (unshaded)
- Chance of flooding over 30 yrs
- 0.22%
- Est. flood insurance / yr
- $507 – $1,088
Fire risk 1/10 · Minimal
- Est. fire insurance / yr
- $1,222 – $2,270
Heat risk 9/10 · Severe
- Hot days now (above 109°F)
- 7 days/yr
- Hot days in 30 yrs
- 23 days/yr
Wind risk 9/10 · Severe
- Chance of severe wind over 30 yrs
- 99.0%
Air-quality risk 2/10 · Minimal
- Unhealthy air days now
- 2 days/yr
- Unhealthy air days in 30 yrs
- 2 days/yr
Risk factors via First Street. Map © Google.
Why this score? — see what drove the C- grade
The composite is a weighted blend of 9 inputs, each scored 0–100. Each bar is that input's sub-score; the figure is the points it added to the 100-point composite (weight × sub-score).
- Cash flow +14.1/30.0
- Appreciation +10.0/10.0
- ARV discount +7.5/15.0
- 1% rule +4.3/10.0
- DSCR +4.3/10.0
- Condition / age +4.0/5.0
- Rent growth +3.7/5.0
- Livability +3.7/5.0
- Schools +2.7/10.0
$265,900
🖨 Deal sheet (PDF) 📄 Offer letter ✓ Due diligence
Listing remarks
Modern new construction two-story home featuring 3 bedrooms and 2.5 bathrooms, located just minutes from the heart of downtown. This thoughtfully designed home offers an open-concept layout with high ceilings, abundant natural light, and stylish contemporary finishes throughout. The spacious kitchen features sleek cabinetry, quartz countertops, stainless steel appliances, and a large island that flows seamlessly into the living and dining areas—perfect for entertaining. Upstairs you'll find generously sized bedrooms, including a private primary suite with a beautifully designed bathroom. Additional highlights include modern flooring, designer lighting, and a convenient one-car garage.
Key facts
- Quartz countertops
- Spacious kitchen
- Large island
Tags
Property features AI
Exterior
- Parking: Attached garage (1 car); Driveway
- Security: Smoke detector(s)
- Utilities: Public water; Public sewer
- Home design: Residential property; New construction (2023); Slab foundation; Composition roof
- Construction: Cement siding and wood siding; Built in 2023; Slab foundation; Composition roof
- Exterior features: Fenced backyard; Front porch
Interior
- Kitchen: Dishwasher; Disposal; Gas oven; Gas range; Microwave
- Bedrooms: Primary bedroom on first floor (approx. 10'8" x 13'); Bedroom on second floor (approx. 14' x 9'8"); Bedroom on second floor (approx. 11' x 12')
- Flooring: Laminate; Tile
- Bathrooms: Two full bathrooms; One half bathroom; Primary bathroom on first floor (approx. 10' x 8')
- Heating & cooling: Central heating (gas); Central air (electric)
- Interior features: High ceilings; Ceiling fan(s); Double vanity; Bath in primary bedroom; Separate shower; Kitchen/family room combo; Kitchen/dining combo; Self-closing cabinet doors and drawers; Programmable thermostat
- Laundry & utility: Washer hookup; Electric dryer hookup
Neighborhood map
What this means for you Summary
Snapshot
- This is a 3-bed/2.5-bath single-family listed at $266k. Condition is rated good.
Deal economics
- At list price, monthly cash flow is $39 ($467/yr) — positive.
- To cash-flow at today's rent, offer at most $261k (2.0% below list).
- To meet the 1% rule (rent ≥ 1% of price), the offer needs to be $237k (10.8% below list).
- Recommended offer: $237k (10.8% below list) — sets the bar for 1% rule.
- Cap rate 6.5% vs local median 3.1% in Houston — top-decile yield for the area; either an underpriced asset or a hidden risk that comps aren't pricing in. Stress-test before assuming the spread holds.
Location & tenants
- Location reads 74/100 on livability (#184 in TX, #4,771 nationally) — a middle-class / working-renter tenant base. Strengths: amenities A+, cost of living A+, housing A+; Watch: crime F.
- Houston ISD (urban): math 27% / reading 35% proficiency, ranked #593 of 826 in TX (top 72%) — families likely to look elsewhere, expect single-tenant / working-renter base with shorter leases; 71% free/reduced lunch — lower-income household profile, screen leases tightly.
- Zoned schools: Bastian El (math 17% / reading 17%, grade F, #3,836 of 4,322 statewide, top 91%, 648 students, 99% FRL); Attucks Middle (math 15% / reading 22%, grade F, #1,478 of 1,662 statewide, top 90%, 439 students, 98% FRL); Worthing H S (math 22% / reading 21%, grade F, #1,377 of 1,632 statewide, top 85%, 827 students, 96% FRL) — zoned schools average 98% FRL vs 71% district-wide (26 pts higher); higher-poverty schools than district average — tighter screening recommended.
- Zoned-school proficiency averages 19% at this address vs 31% district-wide (-12 pts) — the specific schools serving this property underperform the Houston ISD average; the district grade overstates school quality for this exact location.
- Market conditions: Rents rising fast (+4.8%/yr); 321 active listings in the ZIP; 39 comparable units currently listed for rent nearby; rentals at typical pace (median 27d on market — plan ~3-4 weeks tenant-placement turnaround); 44% of comp listings sitting > 30 days — soft ceiling on asking rent; lower-income renter base — watch delinquency; 29,883 units permitted in Harris County in 2024 (8,621 in 5+ unit buildings).
Forward outlook
- In year one you build about $27k of equity ($2k loan paydown + $25k appreciation (10.0% local appreciation)).
- Harris County population projected at +47% by 2050 — long-run rental-demand tailwind backs the buy-and-hold thesis.
- At projected returns (10.0% appreciation + 4.8% rent growth), your $71k cash investment doubles in ~3 years — after that, you're playing with house money.
- By year 2, paydown + projected appreciation supports a ~$44k cash-out refi (75% LTV) — recoverable capital for the next deal without selling this one.
Negotiation context
- It's been on market 32 days — a 3% lower offer ($258k) is reasonable based on typical stale-listing flexibility.
- 2 sale attempts with the ask held roughly flat each time — persistent listings suggest the price (not the market) is what's stuck; bring a comps-based counter.
Risks & watch-outs
- Climate carrying-cost: severe wind risk, 99% chance of damaging wind over 30y; extreme-heat days projected 7→23/yr by 2055 (HVAC capex compounding) — expect insurance premiums to compound above CPI over the hold.
Questions for the listing agent
- It's been on market 32 days. Have you received any prior offers? Is the seller open to a 11% concession, seller financing, or rate buy-down credit?
- Is there a deadline driving the sale (1031 exchange, divorce, estate, relocation)? That informs how much negotiation room exists.
- Schools are D-rated, which usually means shorter tenancies and higher turnover. Who's the typical renter profile here, and what's been the actual vacancy rate?
- Crime grade is F in this area — have there been break-ins, vandalism, or insurance claims at this property in the last 3 years? What carrier currently insures it and at what premium?
- What's the average days-on-market for RENTAL listings here right now (not sales)? A rising rental-DOM trend means longer vacancies and softer asking-rent achievability than the comps imply.
- What's the recent tenant-quality profile in this submarket — average credit score on applications, eviction rate, late-payment / NSF rate, and stable-employment percentage? A property-management company in the area should have these aggregated.
- How much new for-sale + rental construction is in the pipeline within 1–3 miles? Heavy new supply typically softens prices + rents 12–24 months out; constrained supply supports both.
Investment metrics
- 1% rule
- 0.93% ✗
- Cap rate
- 6.48%
- Cash-on-cash
- 0.66%
- DSCR
- 1.03
- GRM
- 8.9
CMA / ARV
- ARV (median comp)
- $253,762
- List price
- $265,900
- Delta
- 4.78%
- Verdict
- FAIR
- Comps
- 20 within 1.0 mi
Show comp detail 12 sales within ~0.75 mi
| Address | Dist | Beds/Ba | Sqft | Sold | Price | $/sf | Match |
|---|---|---|---|---|---|---|---|
| 9007 Comal St | 0.48mi | 3/2.5 | 1,703 (-4%) | 4mo | $289,000 | $170 | 68 |
| 4357 Maggie St | 0.51mi | 4/3.0 (+1) | 1,781 (+0%) | 3mo | $239,950 | $135 | 66 |
| 8815 Edgar St | 0.46mi | 3/2.5 | 1,620 (-9%) | 5mo | $299,990 | $185 | 60 |
| 8817 Edgar St | 0.46mi | 3/2.5 | 1,620 (-9%) | 6mo | $299,990 | $185 | 59 |
| 8819 Edgar St | 0.47mi | 3/2.5 | 1,620 (-9%) | 7mo | $299,990 | $185 | 58 |
| 4425 Elmwood St | 0.38mi | 3/2.5 | 1,995 (+12%) | 4mo | $310,000 | $155 | 58 |
| 4418 Rosemont St | 0.32mi | 4/3.5 (+1) | 1,961 (+11%) | 1mo | $250,000 | $127 | 58 |
| 4427 Elmwood St | 0.39mi | 3/2.5 | 1,995 (+12%) | 4mo | $310,000 | $155 | 58 |
| 4338 Larkspur St | 0.56mi | 3/2.5 | 1,958 (+10%) | 4mo | $230,000 | $117 | 53 |
| 8813 Edgar St | 0.46mi | 3/2.5 | 2,000 (+13%) | 7mo | $365,000 | $183 | 52 |
| 9003 Comal St | 0.46mi | 3/3.5 | 2,012 (+14%) | 2mo | $339,900 | $169 | 50 |
| 9001 Comal St | 0.46mi | 3/3.5 | 2,012 (+14%) | 7mo | $349,990 | $174 | 46 |
Match score weights: distance 35% · size 25% · config 20% · recency 20%. Top-matched comps best support the ARV.
Projected returns pro-forma
10.0% appreciation · 4.77% rent growth · sell at horizon
- IRR
- 25.4%
- Equity multiple
- 3.04×
- Total profit
- $145,064
- Equity at exit
- $228,609
- IRR
- 22.9%
- Equity multiple
- 7.12×
- Total profit
- $434,779
- Equity at exit
- $493,004
Cash invested: $71,053 (down + closing). Projections, not guarantees.
Landlord ↔ Tenant lean methodology
- Overall (STATE)
- 87 Strongly Landlord-Friendly
- State Texas
- 87 Strongly Landlord-Friendly · R+5
- County
- — inherits STATE
- City
- — inherits STATE
ZIP-level market 77051
- Home prices YoY
- 9.7%
- Rents YoY
- 4.8%
- Active inventory
- 321
- Price-to-rent
- 9.3×
Monthly cashflow live
- Estimated rent
- $2,371 high interval (Pro) →
- Mortgage (P&I)
- −$1,331
- Tax from tax record
- −$398 /mo · $4,771/yr
- Insurance
- −$106
- HOA
- −$0
- Vacancy / Maint / Mgmt
- −$498
- Net cashflow
- $39
Break-even live
Sensitivity live
| Price | -10% $183 | -5% $111 | +0% $39 | +5% $-33 | +10% $-105 |
|---|---|---|---|---|---|
| Rent | -10% $-148 | -5% $-55 | +0% $39 | +5% $133 | +10% $226 |
| Rate | -1.0pp $167 | -0.5pp $103 | base $39 | +0.5pp $-27 | +1.0pp $-94 |
UW: 25.0% down · 7.5% · 30yr · 1.5% tax · 5.0% vac · 8.0% maint · 8.0% mgmt
Financing live
Cash to close
- Down payment
- $63,441
- Closing costs
- $7,613
- Reserves months
- —
- Total cash needed
- —
Loan-product check · same deal, 3 products live
Conventional
25% down · 7.5% · 30yr
- Down + closing
- —
- Monthly P&I
- —
- Monthly cashflow
- —
- DSCR
- —
- Eligible?
- —
Personal DTI + credit; lowest rate.
DSCR
20% down · 8.5% · 30yr
- Down + closing
- —
- Monthly P&I
- —
- Monthly cashflow
- —
- DSCR
- —
- Eligible?
- —
No personal income docs; deal must DSCR.
Hard money
10% down · 12.0% · 12mo
- Down + closing
- —
- Monthly P&I
- —
- Monthly cashflow
- —
- DSCR
- —
- Eligible?
- —
Short-term bridge; refi at stabilization.
Rent comps 39 comps
| Address | Beds | Baths | Sqft | Rent | $/sqft | DOM | Units | Dist |
|---|---|---|---|---|---|---|---|---|
| 4117 Shelby Cir Unit 1230900P Houston, TX | 4.0 | 2.0 | 1367 | $5,253 | $3.84 | 1d | 1 | 0.18mi |
| 4406 Sterling St Houston, TX | 3.0 | 2.5 | 1840 | $1,999 | $1.09 | 19d | 1 | 0.32mi |
| 8328 Corinth St Unit B Houston, TX | 3.0 | 2.5 | 1500 | $2,800 | $1.87 | 22d | 1 | 0.33mi |
| 3620 Du Bois St Unit 1302349P Houston, TX | 3.0 | 2.5 | 1797 | $2,945 | $1.64 | 5d | 1 | 0.37mi |
| 4514 Galesburg St Unit B Houston, TX | 3.0 | 2.5 | 1680 | $3,500 | $2.08 | 26d | 1 | 0.47mi |
| 4526 Knoxville St Unit A Houston, TX | 3.0 | 2.5 | 1474 | $1,775 | $1.20 | 17d | 1 | 0.53mi |
| 8606 Lee Otis St Houston, TX | 4.0 | 2.5 | 1869 | $1,975 | $1.06 | 1d | 1 | 0.55mi |
| 8010 Livingston St Houston, TX | 3.0 | 2.0 | 1400 | $1,800 | $1.29 | 46d | 1 | 0.59mi |
| 4601 White Rock St Unit A Houston, TX | 3.0 | 2.5 | 1700 | $2,500 | $1.47 | 46d | 1 | 0.63mi |
| 4609 Bricker St Unit ABC Houston, TX | 3.0 | 2.5 | 1375 | $3,500 | $2.55 | 13d | 1 | 0.71mi |
| 4609 Bricker St Unit B Houston, TX | 3.0 | 2.5 | 1300 | $3,500 | $2.69 | 15d | 1 | 0.71mi |
| 7806 Comal St Unit B Houston, TX | 3.0 | 2.5 | 1800 | $2,200 | $1.22 | 46d | 1 | 0.71mi |
| 4613 Bricker St Unit B Houston, TX | 3.0 | 2.5 | 1600 | $2,300 | $1.44 | 46d | 1 | 0.72mi |
| 4538 Clover St Houston, TX | 4.0 | 2.0 | 1768 | $1,595 | $0.90 | 46d | 1 | 0.72mi |
| 8107 Calhoun Rd Houston, TX | 3.0 | 2.5 | 1304 | $2,250 | $1.73 | 26d | 1 | 0.78mi |
| 4835 Sunflower St Unit 1546466P Houston, TX | 3.0 | 2.0 | 1883 | $4,516 | $2.40 | 17d | 1 | 0.79mi |
| 4530 Mayflower St Houston, TX | 3.0 | 2.0 | 1302 | $1,800 | $1.38 | 46d | 1 | 0.83mi |
| 3710 Rockingham St Houston, TX | 3.0 | 2.0 | 1890 | $1,700 | $0.90 | 46d | 1 | 0.94mi |
| 4723 Mallow St Houston, TX | 3.0 | 2.5 | 1472 | $1,850 | $1.26 | 7d | 1 | 0.95mi |
| 2889 Reed Rd Houston, TX | 1.0–2.0 | 1.0–2.0 | 997 | $1,648 | $1.65 | 5d | 2 | 1.03mi |
| 7321 Conley St Unit B Houston, TX | 3.0 | 2.0 | 1501 | $2,025 | $1.35 | 23d | 1 | 1.09mi |
| 7321 Conley St Unit A Houston, TX | 3.0 | 2.5 | 1869 | $2,025 | $1.08 | 23d | 1 | 1.09mi |
| 3846 Seabrook St Houston, TX | 3.0 | 3.5 | 1833 | $2,300 | $1.25 | 46d | 1 | 1.14mi |
| 9606 Ashville Dr Unit B Houston, TX | 3.0 | 2.0 | 1610 | $1,570 | $0.98 | 46d | 1 | 1.15mi |
| 3732 Seabrook St Houston, TX | 3.0 | 2.5 | 1727 | $2,350 | $1.36 | 26d | 1 | 1.18mi |
| 7710 Darnay Dr Houston, TX | 3.0 | 3.0 | 1635 | $2,095 | $1.28 | 46d | 1 | 1.22mi |
| 3655 Seabrook St Unit 6 Houston, TX | 2.0 | 1.0 | 1600 | $1,000 | $0.62 | 46d | 1 | 1.23mi |
| 9610 Buffum St Houston, TX | 3.0 | 3.0 | 1605 | $1,799 | $1.12 | 46d | 1 | 1.27mi |
| 5036 Mallow St Houston, TX | 3.0 | 3.0 | 1472 | $2,050 | $1.39 | 46d | 1 | 1.33mi |
| 7507 Springhill St Houston, TX | 3.0 | 3.5 | 2000 | $4,500 | $2.25 | 46d | 1 | 1.33mi |
| 4918 Wilmington St Unit A Houston, TX | 3.0 | 3.0 | 1300 | $2,100 | $1.62 | 46d | 1 | 1.34mi |
| 5222 Northridge Dr Houston, TX | 4.0 | 2.0 | 1300 | $1,850 | $1.42 | 26d | 1 | 1.35mi |
| 7358 Guadalcanal Rd Houston, TX | 3.0 | 3.0 | 1768 | $2,195 | $1.24 | 46d | 1 | 1.36mi |
| 5201 Kenilwood Dr Unit B Houston, TX | 3.0 | 2.0 | 2442 | $1,725 | $0.71 | 16d | 1 | 1.41mi |
| 3615 Dreyfus St Houston, TX | 3.0 | 3.0 | 2011 | $2,800 | $1.39 | 46d | 1 | 1.43mi |
| 8181 El Mundo St Houston, TX | 1.0–3.0 | 1.0–2.5 | 1356 | $2,262 | $1.67 | 1d | 48 | 1.44mi |
| 8181 El Mundo St Houston, TX | 1.0–3.0 | 1.0–2.0 | 1241 | $2,041 | $1.64 | 26d | 18 | 1.44mi |
| 4921a Pederson St Unit A Houston, TX | 3.0 | 2.0 | 1765 | $2,150 | $1.22 | 15d | 1 | 1.44mi |
| 5012 Higgins St Unit B Houston, TX | 3.0 | 2.5 | 1611 | $1,650 | $1.02 | 26d | 1 | 1.49mi |
Listing history 16 events
-
2026-06-21days on market $265,900 Active 32 DOM
-
2026-06-18days on market $265,900 Active 29 DOM
-
2026-06-17days on market $265,900 Active 28 DOM
-
2026-06-16days on market $265,900 Active 27 DOM
-
2026-06-15days on market $265,900 Active 26 DOM
-
2026-06-13days on market $265,900 Active 24 DOM
-
2026-06-10days on market $265,900 Active 20 DOM
-
2026-06-08days on market $265,900 Active 19 DOM
-
2026-06-07days on market $265,900 Active 18 DOM
-
2026-06-04days on market $265,900 Active 15 DOM
-
2026-06-01days on market $265,900 Active 12 DOM
-
2026-05-31days on market $265,900 Active 11 DOM
-
2026-05-15historical
-
2026-03-05$265,900 Active
-
2021-12-27soldstatus
-
1988-01-02soldstatus
ⓘ Source: listings_history table (triggers on properties + properties_extension) + one-shot
backfill from property_details.listing_events for pre-trigger history.
Tax reassessment forecast TX · Resets to sale price
- Current annual tax
- $4,771 · $398/mo
- Projected year-2 tax
- $4,866 · $405/mo
- Expected delta
- +$95/yr (+$8/mo · 2.0%)
ⓘ Screening estimate from a state-policy table — verify with the county assessor before closing.
Climate risk First Street
- Flood 4/10 Moderate FEMA zone X (unshaded) · 22% chance over 30 yrs
- Wildfire 1/10 Low
- Heat 9/10 Extreme 7 d/yr ≥109°F today · 23 d/yr by 30 yrs out
- Wind 9/10 Extreme 99% chance of damaging wind over 30 yrs
- Air quality 2/10 Low 2 unhealthy d/yr today · 2 by 30 yrs out
Nearby sold comps map
Loading sold comps map…
Walkable amenities ~0.75 mi
Loading nearby amenities…
Taxation est. · year 1
- Rental income
- $28,450
- − Mortgage interest
- −$14,215
- − Property taxes
- −$4,771
- − Insurance
- −$1,269
- − Repairs & maintenance
- −$2,276
- − Management
- −$2,276
- − Depreciation
- −$7,382
- Taxable loss
- −$3,739
- Est. tax savings @ 24.0%
- +$897
- After-tax cash flow
- $1,364/yr
For passive investors: Depreciation is non-cash, so a rental often shows a tax loss while cash-flowing — sheltering income. Rental losses are passive: they offset passive income freely, and up to $25,000/yr can offset ordinary (W-2) income if you actively participate and your MAGI is under $100k (phasing out to $0 by $150k); unused losses carry forward. On sale, claimed depreciation is recaptured at up to 25%, and gains may owe capital-gains tax (a 1031 exchange can defer both). Figures are a year-1 estimate at your 24.0% rate — not tax advice; consult a CPA.
Condition & rehab AI · 13 photos
This modern two-story home is in good condition with a good condition score of 80. It features a well-maintained kitchen, bathrooms, and exterior. The home is move-in ready with minor cosmetic updates needed for the exterior siding and gutters.
Value-add opportunities
- Resale Paint exterior siding — Fresh paint can enhance curb appeal and property value.
- Rental Replace or clean gutters — Clean gutters improve drainage and reduce maintenance costs for tenants.
Renovation cost estimate screening
Value-add ROI direction
- Resale Paint exterior siding — Fresh paint can enhance curb appeal and property value. ↑
- Rental Replace or clean gutters — Clean gutters improve drainage and reduce maintenance costs for tenants. ↑
ⓘ Cost ranges are severity-bucket heuristics (US national rule-of-thumb). Get contractor quotes + a written scope before underwriting a rehab budget.
Schools (NCES district)
- District
- Houston ISD
- NCES district ID
- 4823640
- Math proficiency
- 27% ▼ -18.00%
- Reading proficiency
- 35% ▼ -6.00%
- Median HH income
- $46,054
- Composite
- 26.63/100
- National rank
- #7173
- State rank
- #593 of 826 in TX
Livability — Houston
- Score
- 74/100
- State rank
- #184
- US rank
- #4771
Category grades
Schools grade is shown separately in the Schools card above.
Census & demographics
- Census place
- Houston, TX
- County
- Harris County · 4,702,590 people
- City population
- 3,226,434
- Metro
- Houston-The Woodlands-Sugar Land, TX
- Population (ZIP)
- 19,795
- Household income
- $37,415
- Rent vs Own
- Severe rent burden
- 1446.0
Population outlook (Harris County) Hauer SSP2
- Today (2025)
- 5,571,493 people
- By 2030
- 6,089,821 · +9.3%
- By 2040
- 7,142,806 · +28.2%
- By 2050
- 8,185,864 · +46.9%
- By 2075
- 10,574,329 · +89.8%
- By 2100
- 12,109,958 · +117.4%
Race, ethnicity, and origin ACS 2023
- Neighborhood character
- Predominantly Black (77%)
- Race & ethnicity
- Black 77% Hispanic / Latino 16% Two or more races 11% White 3%
- Hispanic origin (detail)
- Mexican 6% Puerto Rican 1%
- Foreign-born
- 8% · Canada, China
- Languages at home
- 88% English-only · Spanish 10%
Political lean MEDSL · Harris
- 2024 margin
- Lean D (+5.5) · D 52.0% · R 46.4% · Other 1.6%
- 2008→2024 swing
- +3.9pp toward D · 2008: 1.6pp · 2024: 5.5pp
- All cycles
- 2024: D+5.5 2020: D+13.3 2016: D+12.4 2012: D+0.1 2008: D+1.6
Not yet ingested
- Civics
- —
Market trends
- HPI YoY
- ▲ 16.02%
- Current HPI
- 180.4283
- Rent YoY
- ▲ 4.77%
- Metro
- Houston-The Woodlands-Sugar Land, TX
- State GDP YoY
- ▲ 3.95%
- F500 in state
- 110
Industry mix (Fortune 500 HQ in TX)
| Industry | F500 HQs | Revenue |
|---|---|---|
| Energy | 16 | $1,198B |
|
||
| Technology | 5 | $198B |
|
||
| Engineering / Construction | 4 | $72B |
|
||
| Energy Services | 3 | $60B |
|
||
| Utilities | 3 | $41B |
|
||
| Healthcare | 2 | $330B |
|
||
Price history
+0.0% since first listed5 events — show timeline
- 2026-05-20 Listed $265,900 HARMLS
- 2026-05-15 Listing Removed — HARMLS
- 2026-03-05 Listed $265,900 HARMLS
- 2021-12-27 Sold (Public Records) — Public Records
- 1988-01-02 Sold (Public Records) — Public Records
Property tax history
+159.2%/yrLatest (2025): $4,771 · -1.0% YoY. Source: county tax records.
Cash-flow waterfall
monthlySold comps — $/sqft
last 12 mo · ≤1 miLoading sold comps…