 🏗️ New Construction
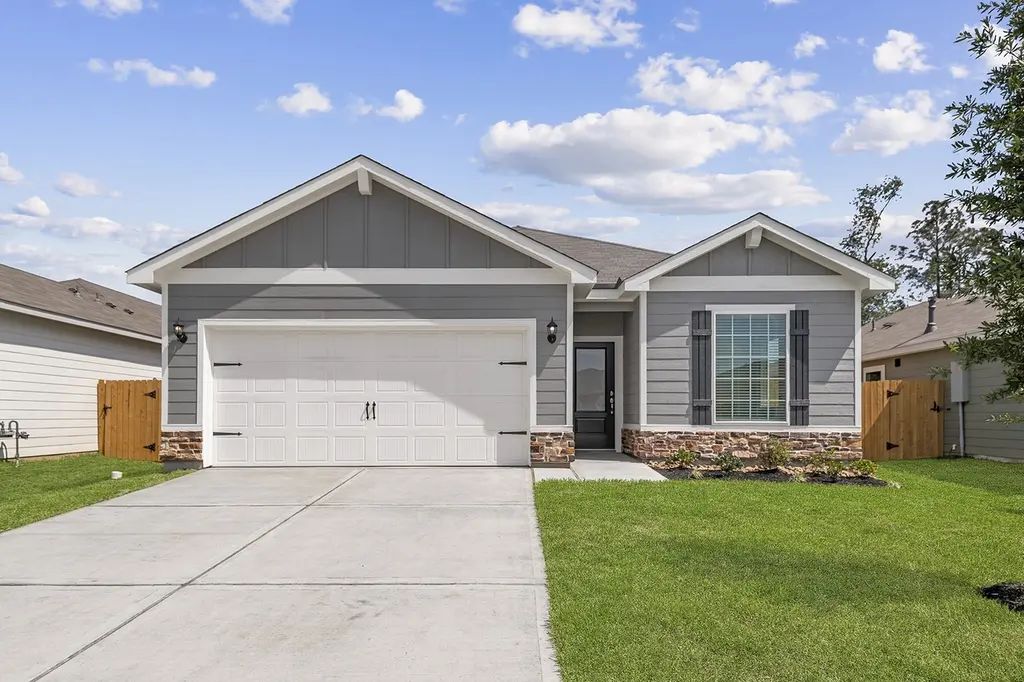
15403 Maple Terrace Dr · Cut and Shoot, TX
Flood risk No data
- FEMA flood zone
- —
- Chance of flooding over 30 yrs
- —
- Est. flood insurance / yr
- —
Fire risk No data
- Est. fire insurance / yr
- —
Heat risk No data
- Hot days now (above threshold)
- —
- Hot days in 30 yrs
- —
Wind risk No data
- Chance of severe wind over 30 yrs
- —
Air-quality risk No data
- Unhealthy air days now
- —
- Unhealthy air days in 30 yrs
- —
Risk factors via First Street. Map © Google.
Why this score? — see what drove the D+ grade
The composite is a weighted blend of 9 inputs, each scored 0–100. Each bar is that input's sub-score; the figure is the points it added to the 100-point composite (weight × sub-score).
- Cash flow +16.4/30.0
- ARV discount +7.5/15.0
- DSCR +5.1/10.0
- Schools +5.1/10.0
- 1% rule +3.4/10.0
- Livability +2.8/5.0
- Condition / age +2.5/5.0
- Rent growth +2.4/5.0
- Appreciation +0.0/10.0
$274,900
🖨 Deal sheet (PDF) 📄 Offer letter ✓ Due diligence
Listing remarks
Experience easy, stylish living in the Maple floorplan at Sweetwater Ridge! This spacious one-story home is ideal for relaxing and entertaining, with a private dining room, large family room, and an upgraded kitchen featuring granite countertops, Whirlpool appliances (including a refrigerator and built-in microwave), luxury vinyl plank flooring, and rich wood cabinetry. A breakfast bar and extended covered patio offer great gathering spaces—and with no back neighbors, you'll enjoy extra peace and privacy. The private owner’s retreat includes a soaker tub, step-in shower, and generous walk-in closet. Two additional bedrooms and a second full bath provide flexible space for guests
Key facts
- 2 garage spots
- Built 2026
- Listed 17 days
Property features AI
Finance
- Financial info: Lease considered
- HOA & community: Homeowners association with annual fee; Annual association fee $480; Community amenities include dog park, lake/pond, picnic area, playground, park, and trails; Curbs in the community
Exterior
- Parking: Attached garage; 2 garage spaces
- Security: Owned security system; Smoke detectors
- Utilities: Public water; Public sewer
- Home design: Residential property; New construction (built 2026); Single-story layout (all main rooms on first floor)
- Construction: Composition roof
- Exterior features: Covered patio; Patio and deck; Private yard; Sprinkler/irrigation system; Back yard fencing
Interior
- Kitchen: Dishwasher; Garbage disposal; Gas oven; Gas range; Microwave; Refrigerator; ENERGY STAR qualified appliances; Pantry
- Bedrooms: Primary bedroom on first floor (approx. 14 x 14); Bedroom on first floor (approx. 10 x 14); Bedroom on first floor (approx. 16 x 9); Bedroom on first floor (approx. 12 x 9)
- Flooring: Carpet; Plank flooring; Vinyl
- Bathrooms: 2 full bathrooms; Primary bathroom on first floor (approx. 8 x 9); Additional bathroom on first floor (approx. 12 x 5)
- Heating & cooling: Heat pump; Central air (electric); Attic fan
- Interior features: Kitchen/family room combo; Pantry; Soaking tub; Separate shower; Tub with shower; Window treatments; Ceiling fans; Programmable thermostat; Low emissivity windows; Window coverings; Ventilation
- Laundry & utility: Washer hookup; Electric dryer hookup; Gas dryer hookup; Utility room on first floor (approx. 6 x 6); Tankless water heater
Neighborhood map
What this means for you Summary
Snapshot
- This is a 4-bed/2.0-bath land listed at $275k.
Deal economics
- At list price, monthly cash flow is $142 ($2k/yr) — positive.
- To cash-flow at today's rent, offer at most $274k (0.3% below list).
- To meet the 1% rule (rent ≥ 1% of price), the offer needs to be $209k (23.9% below list).
- Recommended offer: $209k (23.9% below list) — sets the bar for 1% rule.
- Cap rate 7.0% vs local median 4.9% in Cut and Shoot — top-decile yield for the area; either an underpriced asset or a hidden risk that comps aren't pricing in. Stress-test before assuming the spread holds.
Location & tenants
- Location reads 56/100 on livability (#1,326 in TX) — a working-class tenant base; expect higher turnover. Strengths: cost of living A+, housing A+; Watch: crime D-, amenities F, commute F.
- Conroe ISD (other): math 57% / reading 57% proficiency, ranked #69 of 826 in TX (top 8%) — acceptable for families but not a draw, mixed tenant base, ~2y average lease.
- Zoned schools: Austin El (math 39% / reading 29%, grade F, #2,149 of 4,322 statewide, top 50%, 950 students, 81% FRL); Moorhead J H (math 35% / reading 42%, grade F, #704 of 1,662 statewide, top 43%, 1,391 students, 82% FRL); Conroe H S (math 32% / reading 51%, grade F, #767 of 1,632 statewide, top 47%, 4,915 students, 61% FRL) — zoned schools average 75% FRL vs 34% district-wide (40 pts higher); higher-poverty schools than district average — tighter screening recommended.
- Zoned-school proficiency averages 38% at this address vs 57% district-wide (-19 pts) — the specific schools serving this property underperform the Conroe ISD average; the district grade overstates school quality for this exact location.
- Market conditions: Rents soft (-0.3%/yr); 721 active listings in the ZIP; 6 comparable units currently listed for rent nearby; rentals leasing fast (median 0d on market — plan ~1-2 weeks tenant-placement turnaround); solid renter incomes; 13,259 units permitted in Montgomery County in 2024 (1,402 in 5+ unit buildings).
- This rent runs 33% of the median local income ($75k/yr) — at the standard rent-burdened threshold; future hikes will face affordability resistance.
Forward outlook
- Local home prices are declining (-3.0%/yr); year-one equity from $2k of loan paydown is wiped out by about $7k of value loss. Plan a longer hold.
- Montgomery County population projected at +65% by 2050 — long-run rental-demand tailwind backs the buy-and-hold thesis.
Negotiation context
- It's been on market 17 days — a 2% lower offer ($271k) is reasonable based on typical stale-listing flexibility.
- 7 sale attempts with the ask held roughly flat each time — persistent listings suggest the price (not the market) is what's stuck; bring a comps-based counter.
Questions for the listing agent
- What does the HOA fee cover, when was the last increase, and are there any pending special assessments or reserve-fund shortfalls?
- Is there a deadline driving the sale (1031 exchange, divorce, estate, relocation)? That informs how much negotiation room exists.
- Schools are F-rated, which usually means shorter tenancies and higher turnover. Who's the typical renter profile here, and what's been the actual vacancy rate?
- Crime grade is D in this area — have there been break-ins, vandalism, or insurance claims at this property in the last 3 years? What carrier currently insures it and at what premium?
- The area grade is low — what's the realistic commute time and amenity access for the typical tenant pool here? Any planned neighborhood developments (good or bad) we should know about?
- What's the average days-on-market for RENTAL listings here right now (not sales)? A rising rental-DOM trend means longer vacancies and softer asking-rent achievability than the comps imply.
- What's the recent tenant-quality profile in this submarket — average credit score on applications, eviction rate, late-payment / NSF rate, and stable-employment percentage? A property-management company in the area should have these aggregated.
- How much new for-sale + rental construction is in the pipeline within 1–3 miles? Heavy new supply typically softens prices + rents 12–24 months out; constrained supply supports both.
Investment metrics
- 1% rule
- 0.84% ✗
- Cap rate
- 6.98%
- Cash-on-cash
- 2.44%
- DSCR
- 1.11
- GRM
- 9.9
CMA / ARV
- ARV (median comp)
- $248,947
- List price
- $274,900
- Delta
- 10.43%
- Verdict
- OVERPRICED
- Comps
- 20 within 1.0 mi
Projected returns pro-forma
-3.0% appreciation · 0.0% rent growth · sell at horizon
- IRR
- -15.5%
- Equity multiple
- 0.46×
- Total profit
- $-37,523
- Equity at exit
- $37,119
- IRR
- -12.5%
- Equity multiple
- 0.35×
- Total profit
- $-45,107
- Equity at exit
- $21,524
Cash invested: $69,705 (down + closing). Projections, not guarantees.
Landlord ↔ Tenant lean methodology
- Overall (STATE)
- 87 Strongly Landlord-Friendly
- State Texas
- 87 Strongly Landlord-Friendly · R+5
- County
- — inherits STATE
- City
- — inherits STATE
ZIP-level market 77303
- Home prices YoY
- -22.4%
- Rents YoY
- -0.3%
- Active inventory
- 721
- Price-to-rent
- 11.0×
Monthly cashflow live
- Estimated rent
- $2,091 high interval (Pro) →
- Mortgage (P&I)
- −$1,306
- Tax from tax record
- −$60 /mo · $725/yr
- Insurance
- −$104
- HOA
- −$40
- Vacancy / Maint / Mgmt
- −$439
- Net cashflow
- $142
Break-even live
Sensitivity live
| Price | -10% $283 | -5% $212 | +0% $142 | +5% $72 | +10% $1 |
|---|---|---|---|---|---|
| Rent | -10% $-23 | -5% $59 | +0% $142 | +5% $225 | +10% $307 |
| Rate | -1.0pp $267 | -0.5pp $205 | base $142 | +0.5pp $77 | +1.0pp $12 |
UW: 25.0% down · 7.5% · 30yr · 1.5% tax · 5.0% vac · 8.0% maint · 8.0% mgmt
Financing live
Cash to close
- Down payment
- $62,237
- Closing costs
- $7,468
- Reserves months
- —
- Total cash needed
- —
Loan-product check · same deal, 3 products live
Conventional
25% down · 7.5% · 30yr
- Down + closing
- —
- Monthly P&I
- —
- Monthly cashflow
- —
- DSCR
- —
- Eligible?
- —
Personal DTI + credit; lowest rate.
DSCR
20% down · 8.5% · 30yr
- Down + closing
- —
- Monthly P&I
- —
- Monthly cashflow
- —
- DSCR
- —
- Eligible?
- —
No personal income docs; deal must DSCR.
Hard money
10% down · 12.0% · 12mo
- Down + closing
- —
- Monthly P&I
- —
- Monthly cashflow
- —
- DSCR
- —
- Eligible?
- —
Short-term bridge; refi at stabilization.
Rent comps 6 comps
| Address | Beds | Baths | Sqft | Rent | $/sqft | DOM | Units | Dist |
|---|---|---|---|---|---|---|---|---|
| 15793 Bayberry Trace Dr Conroe, TX | 3.0–4.0 | 2.0–2.5 | 1639 | $2,240 | $1.37 | 0d | 1 | 0.18mi |
| 15648 Plum Brook Dr Conroe, TX | 4.0 | 2.0 | 1793 | $1,930 | $1.08 | 0d | 1 | 0.19mi |
| 15642 Plum Brook Dr Conroe, TX | 3.0 | 2.0 | 1306 | $1,610 | $1.23 | 0d | 1 | 0.19mi |
| 15652 Plum Brook Dr Conroe, TX | 4.0 | 2.5 | 2203 | $2,135 | $0.97 | 0d | 1 | 0.19mi |
| 15667 Plum Brook Dr Conroe, TX | 4.0 | 2.0 | 1793 | $1,930 | $1.08 | 0d | 1 | 0.19mi |
| 15663 Plum Brook Dr Conroe, TX | 3.0 | 2.0 | 1306 | $1,610 | $1.23 | 0d | 1 | 0.19mi |
HOA detail
- Monthly dues
- $40 · $480/yr
- Likely covers
- waterpool
Listing history 23 events
-
2026-06-21days on market $274,900 Active 17 DOM
-
2026-06-18days on market $274,900 Active 14 DOM
-
2026-06-17days on market $274,900 Active 13 DOM
-
2026-06-16days on market $274,900 Active 12 DOM
-
2026-06-15days on market $274,900 Active 11 DOM
-
2026-06-13days on market $274,900 Active 9 DOM
-
2026-06-09days on market $274,900 Active 5 DOM
-
2026-06-08days on market $274,900 Active 4 DOM
-
2026-06-07days on market $274,900 Active 3 DOM
-
2026-06-03days on market $274,900 Active 28 DOM
-
2026-06-02days on market $274,900 Active 27 DOM
-
2026-06-01days on market $274,900 Active 26 DOM
-
2026-05-31days on market $274,900 Active 25 DOM
-
2026-05-14$1,830
-
2026-05-13status Active 881-char remark
-
2026-05-08historical 881-char remark
-
2026-05-01$274,900 Active 881-char remark
-
2025-06-12historical $1,945
-
2025-06-07$1,945
-
2025-06-06historical $1,945
-
2025-05-06$1,945
-
2025-03-09historical $1,995
-
2025-03-08$1,995
ⓘ Source: listings_history table (triggers on properties + properties_extension) + one-shot
backfill from property_details.listing_events for pre-trigger history.
Tax reassessment forecast TX · Resets to sale price
- Current annual tax
- $725 · $60/mo
- Projected year-2 tax
- $5,031 · $419/mo
- Expected delta
- +$4,305/yr (+$359/mo · 593.7%)
ⓘ Screening estimate from a state-policy table — verify with the county assessor before closing.
Nearby sold comps map
Loading sold comps map…
Walkable amenities ~0.75 mi
Loading nearby amenities…
Taxation est. · year 1
- Rental income
- $25,088
- − Mortgage interest
- −$13,945
- − Property taxes
- −$725
- − Insurance
- −$1,245
- − Repairs & maintenance
- −$2,007
- − Management
- −$2,007
- − HOA
- −$480
- − Depreciation
- −$7,242
- Taxable loss
- −$2,563
- Est. tax savings @ 24.0%
- +$615
- After-tax cash flow
- $2,319/yr
For passive investors: Depreciation is non-cash, so a rental often shows a tax loss while cash-flowing — sheltering income. Rental losses are passive: they offset passive income freely, and up to $25,000/yr can offset ordinary (W-2) income if you actively participate and your MAGI is under $100k (phasing out to $0 by $150k); unused losses carry forward. On sale, claimed depreciation is recaptured at up to 25%, and gains may owe capital-gains tax (a 1031 exchange can defer both). Figures are a year-1 estimate at your 24.0% rate — not tax advice; consult a CPA.
Schools (NCES district)
- District
- Conroe ISD
- NCES district ID
- 4815000
- Math proficiency
- 57% ▼ -6.00%
- Reading proficiency
- 57% ▼ -1.00%
- Median HH income
- $71,541
- Composite
- 50.65/100
- National rank
- #1833
- State rank
- #69 of 826 in TX
Livability — Cut and Shoot
- Score
- 56/100
- State rank
- #1326
- US rank
- #22835
Category grades
Schools grade is shown separately in the Schools card above.
Census & demographics
- County
- Montgomery County · 663,713 people
- Metro
- Houston-The Woodlands-Sugar Land, TX
- Population (ZIP)
- 28,854
- Household income
- $75,348
- Rent vs Own
- Severe rent burden
- 464.0
Population outlook (Montgomery County) Hauer SSP2
- Today (2025)
- 713,896 people
- By 2030
- 805,263 · +12.8%
- By 2040
- 992,708 · +39.1%
- By 2050
- 1,179,590 · +65.2%
- By 2075
- 1,628,084 · +128.1%
- By 2100
- 1,937,880 · +171.5%
Race, ethnicity, and origin ACS 2023
- Neighborhood character
- Diverse neighborhood (Simpson 0.56)
- Race & ethnicity
- White 54% Hispanic / Latino 38% Two or more races 17% Black 4%
- Hispanic origin (detail)
- Mexican 25%
- Common ancestry
- Lithuanian 1% Romanian 1% Slovak 1%
- Foreign-born
- 13% · Canada, Jamaica
- Languages at home
- 69% English-only · Spanish 31%
Political lean MEDSL · Montgomery
- 2024 margin
- Solid R (+45.5) · D 26.8% · R 72.3%
- 2008→2024 swing
- +7.2pp toward D · 2008: -52.7pp · 2024: -45.5pp
- All cycles
- 2024: R+45.5 2020: R+43.8 2016: R+51.4 2012: R+60.7 2008: R+52.7
Not yet ingested
- Civics
- —
Market trends
- HPI YoY
- ▼ -77.71%
- Current HPI
- 269.5367
- Rent YoY
- ▼ -0.31%
- Metro
- Houston-The Woodlands-Sugar Land, TX
- State GDP YoY
- ▲ 3.95%
- F500 in state
- 110
Industry mix (Fortune 500 HQ in TX)
| Industry | F500 HQs | Revenue |
|---|---|---|
| Energy | 16 | $1,198B |
|
||
| Technology | 5 | $198B |
|
||
| Engineering / Construction | 4 | $72B |
|
||
| Energy Services | 3 | $60B |
|
||
| Utilities | 3 | $41B |
|
||
| Healthcare | 2 | $330B |
|
||
Price history
-7.0% since first listed14 events — show timeline
- 2026-06-11 Rental Removed $1,855 HARMLS
- 2026-06-04 Listed $274,900 HARMLS
- 2026-06-03 Listing Removed — HARMLS
- 2026-05-30 Price Changed $1,855 HARMLS
- 2026-05-14 Listed for Rent $1,830 HARMLS
- 2026-05-13 Relisted — HARMLS
- 2026-05-08 Listing Removed — HARMLS
- 2026-05-01 Listed $274,900 HARMLS
- 2025-06-12 Rental Removed $1,945 BUILDIUM
- 2025-06-07 Listed for Rent $1,945 BUILDIUM
- 2025-06-06 Rental Removed $1,945 HARMLS
- 2025-05-06 Listed for Rent $1,945 HARMLS
- 2025-03-09 Rental Removed $1,995 HARMLS
- 2025-03-08 Listed for Rent $1,995 HARMLS
Property tax history
+17.2%/yrLatest (2025): $725 · -0.1% YoY. Source: county tax records.
Cash-flow waterfall
monthlySold comps — $/sqft
last 12 mo · ≤1 miLoading sold comps…