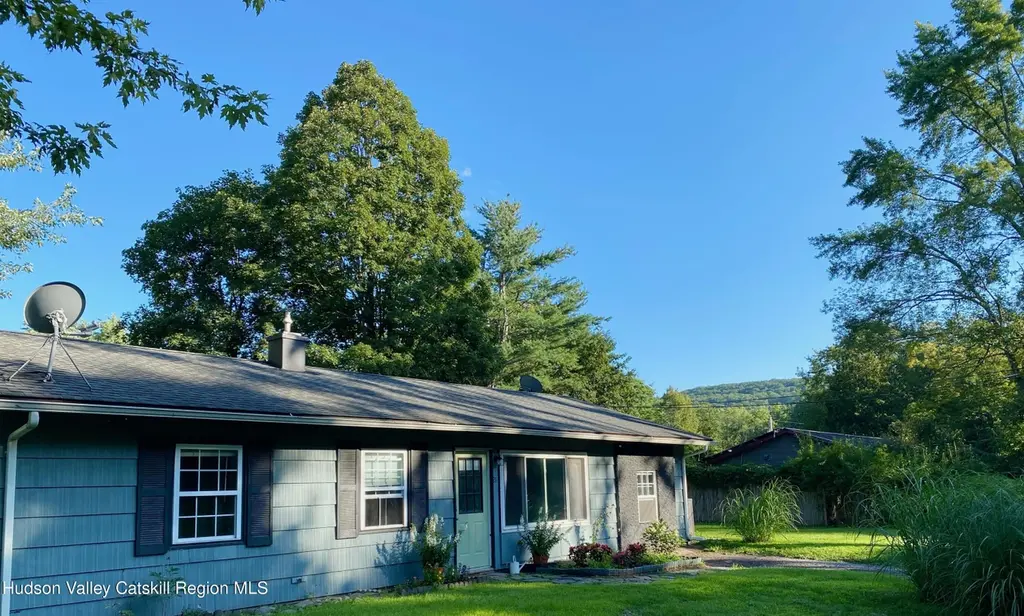
21 Overlook Dr · Woodstock, NY
Flood risk 1/10 · Minimal
- FEMA flood zone
- X (unshaded)
- Chance of flooding over 30 yrs
- 0.0%
- Est. flood insurance / yr
- $507 – $1,088
Fire risk 3/10 · Minor
- Est. fire insurance / yr
- $691 – $1,283
Heat risk 3/10 · Minor
- Hot days now (above 94°F)
- 7 days/yr
- Hot days in 30 yrs
- 16 days/yr
Wind risk 3/10 · Minor
- Chance of severe wind over 30 yrs
- 6.0%
Air-quality risk 2/10 · Minimal
- Unhealthy air days now
- 0 days/yr
- Unhealthy air days in 30 yrs
- 1 days/yr
Risk factors via First Street. Map © Google.
Why this score? — see what drove the C grade
The composite is a weighted blend of 9 inputs, each scored 0–100. Each bar is that input's sub-score; the figure is the points it added to the 100-point composite (weight × sub-score).
- Cash flow +18.7/30.0
- ARV discount +13.7/15.0
- DSCR +5.9/10.0
- Schools +5.2/10.0
- 1% rule +4.5/10.0
- Livability +3.9/5.0
- Rent growth +2.5/5.0
- Condition / age +2.5/5.0
- Appreciation +0.0/10.0
$399,999
🖨 Deal sheet 📄 Offer letter ✓ Due diligence
Listing remarks MLS
Super Fresh Woodstock Ranch nicely sited on large . 39 Acre lot in Bearsville Flatts! 3 Bedrooms, 1 Bath, fresh flooring , bedroom carpets, paint, Ship Lap livingroom wall-loaded with windows. Kitchen is neat & complete with great Stainless sink, coffee bar, glass back splash, Corion style countertops. , Huge Pantry! Family room is currently being used as a primary bedroom, very spacious 19.3x11. Huge back yard perfect for BBQ's & entertaining. Quiet, low traffic area- nice for bike riding and dogs. Perfect fulltime or weekender, so much to do in this walkable Woodstock location, Dixon Roadside, Bearsville Theater, Janes Ice Cream, Bear Cantina, Sun Frost Farm stand, Hiking, Biking, and Dog Park. Close to tried & true swimming holes- you are gonna love this !
Key facts
- Large living space
- Sizeable garden
- Largest lots
Tags
Property features AI
Exterior
- Parking: Driveway
- Utilities: Public water; Private sewer
- Home design: Single family residence; One story; House; Residential
- Construction: Slab foundation; Built as a house
- Exterior features: Back yard; Corner lot; Shingle roof
Interior
- Kitchen: Free-standing range; Microwave; Refrigerator
- Flooring: Carpet; Laminate
- Bathrooms: 1 full bathroom
- Heating & cooling: Forced air heating; Has heating
- Interior features: Exhaust fan; Range hood
- Laundry & utility: Washer and dryer; Dryer
Neighborhood map
What this means for you Summary
Snapshot
- This is a 3-bed/1.0-bath single-family listed at $400k.
Deal economics
- At list price, monthly cash flow is $398 ($5k/yr) — positive.
- The deal already cash-flows at list — no discount required.
- To meet the 1% rule (rent ≥ 1% of price), the offer needs to be $380k (5.0% below list).
- Recommended offer: $380k (5.0% below list) — sets the bar for 1% rule.
- Cap rate 7.5% vs local median 2.6% in Woodstock — top-decile yield for the area; either an underpriced asset or a hidden risk that comps aren't pricing in. Stress-test before assuming the spread holds.
Location & tenants
- Location reads 77/100 on livability (#205 in NY, #3,176 nationally) — a middle-class / working-renter tenant base. Strengths: crime A+, amenities A+, health & safety A+; Watch: employment D, commute F, cost of living F.
- Onteora Central School District (rural): math 58% / reading 59% proficiency, ranked #288 of 755 in NY (top 38%) — acceptable for families but not a draw, mixed tenant base, ~2y average lease.
- Market conditions: 72 active listings in the ZIP; 1 comparable units currently listed for rent nearby; 464 units permitted in Ulster County in 2024 (170 in 5+ unit buildings).
Forward outlook
- Local home prices are declining (-3.0%/yr); year-one equity from $3k of loan paydown is wiped out by about $12k of value loss. Plan a longer hold.
- Ulster County population projected at -14% by 2050 — secular population decline; favor cash flow + early exit over multi-decade hold.
Negotiation context
- Only 8 days on market — expect competitive offers; lowballing is unlikely to land.
- 3 sale attempts since 17y ago with the ask held roughly flat each time — persistent listings suggest the price (not the market) is what's stuck; bring a comps-based counter.
- Current owner paid $338k; 19% above their basis — modest negotiation headroom, anchor on the comps not their cost.
Risks & watch-outs
- Watch-outs: built in 1956 — expect roof / HVAC / electrical / plumbing capex.
Questions for the listing agent
- Built in 1956 — when were the roof, HVAC, electrical panel, plumbing, and water heater last replaced?
- Is there a deadline driving the sale (1031 exchange, divorce, estate, relocation)? That informs how much negotiation room exists.
- Schools are B-rated — typically a magnet for longer-tenancy family renters. What's the average tenant stay here, and is there a school-zone premium baked into asking?
- What's the average days-on-market for RENTAL listings here right now (not sales)? A rising rental-DOM trend means longer vacancies and softer asking-rent achievability than the comps imply.
- What's the recent tenant-quality profile in this submarket — average credit score on applications, eviction rate, late-payment / NSF rate, and stable-employment percentage? A property-management company in the area should have these aggregated.
- How much new for-sale + rental construction is in the pipeline within 1–3 miles? Heavy new supply typically softens prices + rents 12–24 months out; constrained supply supports both.
Investment metrics
- 1% rule
- 0.95% ✗
- Cap rate
- 7.49%
- Cash-on-cash
- 4.26%
- DSCR
- 1.19
- GRM
- 8.8
CMA / ARV
- ARV (on-the-fly)
- $464,400
- Comps found
- 10
Show comp detail 10 sales within ~0.75 mi
| Address | Dist | Beds/Ba | Sqft | Sold | Price | $/sf | Match |
|---|---|---|---|---|---|---|---|
| 22 Overlook Dr | 0.03mi | 3/1.0 | 1,199 (-0%) | 19mo | $515,000 | $430 | 83 |
| 44 Overlook Dr | 0.17mi | 3/1.0 | 1,164 (-3%) | 6mo | $450,500 | $387 | 82 |
| 24 Overlook Dr | 0.04mi | 3/1.0 | 1,266 (+6%) | 11mo | $301,250 | $238 | 80 |
| 57 Overlook Dr | 0.17mi | 2/2.0 (-1) | 1,177 (-2%) | 8mo | $325,000 | $276 | 74 |
| 15 Overlook Dr | 0.03mi | 3/1.0 | 1,286 (+7%) | 19mo | $423,500 | $329 | 71 |
| 2 Fern Hollow Holw | 0.72mi | 2/1.0 (-1) | 1,263 (+5%) | 1mo | $475,000 | $376 | 52 |
| 7 Dixon Ave | 0.24mi | 2/2.0 (-1) | 1,056 (-12%) | 10mo | $350,000 | $331 | 52 |
| 7 Lark Dr | 0.32mi | 3/2.5 | 1,345 (+12%) | 19mo | $745,000 | $554 | 43 |
| 53 Blueberry Hill Rd | 0.58mi | 3/3.0 | 1,152 (-4%) | 18mo | $952,500 | $827 | 43 |
| 196 Tinker St | 0.72mi | 2/1.5 (-1) | 1,065 (-11%) | 2mo | $525,000 | $493 | 39 |
Match score weights: distance 35% · size 25% · config 20% · recency 20%. Top-matched comps best support the ARV.
Projected returns pro-forma
-3.0% appreciation · 3.0% rent growth · sell at horizon
- IRR
- -9.7%
- Equity multiple
- 0.65×
- Total profit
- $-39,540
- Equity at exit
- $59,641
- IRR
- -0.3%
- Equity multiple
- 0.98×
- Total profit
- $-1,996
- Equity at exit
- $34,585
Cash invested: $112,000 (down + closing). Projections, not guarantees.
Landlord ↔ Tenant lean methodology
- Overall (STATE)
- 15 Strongly Tenant-Friendly
- State New York
- 15 Strongly Tenant-Friendly · D+10
- County
- — inherits STATE
- City
- — inherits STATE
ZIP-level market 12498
- Home prices YoY
- -21.8%
- Active inventory
- 72
- Price-to-rent
- 8.8×
Monthly cashflow live
- Estimated rent
- $3,800 medium interval (Pro) →
- Mortgage (P&I)
- −$2,098
- Tax from tax record
- −$340 /mo · $4,082/yr
- Insurance
- −$167
- HOA
- −$0
- Vacancy / Maint / Mgmt
- −$798
- Net cashflow
- $398
Break-even live
UW: 25.0% down · 7.5% · 30yr · 1.5% tax · 5.0% vac · 8.0% maint · 8.0% mgmt
Financing live
Cash to close
- Down payment
- $100,000
- Closing costs
- $12,000
- Reserves months
- —
- Total cash needed
- —
Loan-product check · same deal, 3 products live
Conventional
25% down · 7.5% · 30yr
- Down + closing
- —
- Monthly P&I
- —
- Monthly cashflow
- —
- DSCR
- —
- Eligible?
- —
Personal DTI + credit; lowest rate.
DSCR
20% down · 8.5% · 30yr
- Down + closing
- —
- Monthly P&I
- —
- Monthly cashflow
- —
- DSCR
- —
- Eligible?
- —
No personal income docs; deal must DSCR.
Hard money
10% down · 12.0% · 12mo
- Down + closing
- —
- Monthly P&I
- —
- Monthly cashflow
- —
- DSCR
- —
- Eligible?
- —
Short-term bridge; refi at stabilization.
Rent comps 1 comps
| Address | Beds | Baths | Sqft | Rent | $/sqft | DOM | Units | Dist |
|---|---|---|---|---|---|---|---|---|
| 35 Race Track Rd Bearsville, NY | 2.0 | 1.0 | 956 | $3,800 | $3.97 | 43d | 1 | 1.03mi |
Listing history 8 events
-
2026-06-19days on market $399,999 Active 8 DOM
-
2026-06-18days on market $399,999 Active 7 DOM
-
2026-06-17days on market $399,999 Active 6 DOM
-
2026-06-16days on market $399,999 Active 5 DOM
-
2026-06-15days on market $399,999 Active 4 DOM
-
2026-06-14days on market $399,999 Active 2 DOM
-
2026-06-12remarks 699-char remark
-
2026-06-12$399,999 Active 1 DOM
ⓘ Source: listings_history table (triggers on properties + properties_extension) + one-shot
backfill from property_details.listing_events for pre-trigger history.
Tax reassessment forecast NY · Partial reset (capped growth)
- Current annual tax
- $4,082 · $340/mo
- Projected year-2 tax
- $5,421 · $452/mo
- Expected delta
- +$1,339/yr (+$112/mo · 32.8%)
ⓘ Screening estimate from a state-policy table — verify with the county assessor before closing.
Climate risk First Street
- Flood 1/10 Low FEMA zone X (unshaded) · 0% chance over 30 yrs
- Wildfire 3/10 Moderate
- Heat 3/10 Moderate 7 d/yr ≥94°F today · 16 d/yr by 30 yrs out
- Wind 3/10 Moderate 6% chance of damaging wind over 30 yrs
- Air quality 2/10 Low 0 unhealthy d/yr today · 1 by 30 yrs out
Nearby sold comps map
Loading sold comps map…
Walkable amenities ~0.75 mi
Loading nearby amenities…
Taxation est. · year 1
- Rental income
- $45,600
- − Mortgage interest
- −$22,406
- − Property taxes
- −$4,082
- − Insurance
- −$2,000
- − Repairs & maintenance
- −$3,648
- − Management
- −$3,648
- − Depreciation
- −$11,636
- Taxable loss
- −$1,821
- Est. tax savings @ 24.0%
- +$437
- After-tax cash flow
- $5,207/yr
For passive investors: Depreciation is non-cash, so a rental often shows a tax loss while cash-flowing — sheltering income. Rental losses are passive: they offset passive income freely, and up to $25,000/yr can offset ordinary (W-2) income if you actively participate and your MAGI is under $100k (phasing out to $0 by $150k); unused losses carry forward. On sale, claimed depreciation is recaptured at up to 25%, and gains may owe capital-gains tax (a 1031 exchange can defer both). Figures are a year-1 estimate at your 24.0% rate — not tax advice; consult a CPA.
Schools (NCES district)
- District
- Onteora Central School District
- NCES district ID
- 3621840
- Math proficiency
- 58% ▬ 0.00%
- Reading proficiency
- 59% ▼ -3.00%
- Median HH income
- $56,997
- Composite
- 52.17/100
- National rank
- #3482
- State rank
- #288 of 755 in NY
Livability — Woodstock
- Score
- 77/100
- State rank
- #205
- US rank
- #3176
Category grades
Schools grade is shown separately in the Schools card above.
Census & demographics
- Census place
- Woodstock, NY
- City population
- 4,530
- Population (ZIP)
- 4,530
Population outlook (Ulster County) Hauer SSP2
- Today (2025)
- 175,887 people
- By 2030
- 171,876 · -2.3%
- By 2040
- 161,771 · -8.0%
- By 2050
- 151,470 · -13.9%
- By 2075
- 133,023 · -24.4%
- By 2100
- 113,504 · -35.5%
Race, ethnicity, and origin ACS 2023
- Neighborhood character
- Predominantly White (84%)
- Race & ethnicity
- White 84% Hispanic / Latino 6% Two or more races 5% Asian 3% Black 2%
- Hispanic origin (detail)
- Common ancestry
- Scotch-Irish 8% Italian 7% Romanian 5%
- Foreign-born
- 12% · Canada, China, Jamaica
- Languages at home
- 90% English-only · Spanish 3% French/Haitian/Cajun 2% German/W. Germanic 1%
Political lean MEDSL · Ulster
- 2024 margin
- D (+18.7) · D 59.3% · R 40.7%
- 2008→2024 swing
- -4.9pp toward R · 2008: 23.6pp · 2024: 18.7pp
- All cycles
- 2024: D+18.7 2020: D+20.9 2016: D+9.1 2012: D+21.9 2008: D+23.6
Not yet ingested
- Civics
- —
Market trends
- HPI YoY
- ▼ -96.28%
- Current HPI
- 344.8651
- Rent YoY
- —
- Metro
- —
- State GDP YoY
- ▲ 2.60%
- F500 in state
- 92
Industry mix (Fortune 500 HQ in NY)
| Industry | F500 HQs | Revenue |
|---|---|---|
| Financial Services | 10 | $950B |
|
||
| Consumer Goods | 9 | $162B |
|
||
| Insurance | 4 | $225B |
|
||
| Telecommunications | 2 | $144B |
|
||
| Pharmaceuticals | 2 | $112B |
|
||
| Media / Entertainment | 2 | $69B |
|
||
Price history
+566.7% since first listed10 events — show timeline
- 2026-06-11 Listed $399,999 HVCRMLS
- 2023-08-16 Sold (Public Records) $337,500 Public Records
- 2023-08-15 Sold (MLS) $337,500 HVCRMLS
- 2023-07-18 Pending — HVCRMLS
- 2023-06-27 Pending — HVCRMLS
- 2023-04-11 Listed $359,000 HVCRMLS
- 2009-12-03 Sold (Public Records) $124,000 Public Records
- 2009-11-20 Sold (MLS) $120,000 HVCRMLS
- 2009-08-03 Listed $124,900 HVCRMLS
- 1986-10-31 Sold (Public Records) $60,000 Public Records
Property tax history
+4.6%/yrLatest (2025): $4,082 · -5.3% YoY. Source: county tax records.
Cash-flow waterfall
monthlySold comps — $/sqft
last 12 mo · ≤1 miLoading sold comps…