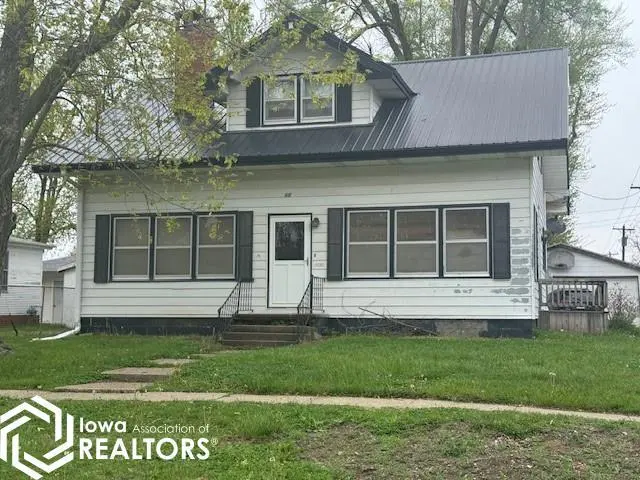
813 Park Ave · Chariton, IA
Flood risk 1/10 · Minimal
- FEMA flood zone
- X (unshaded)
- Chance of flooding over 30 yrs
- 0.0%
- Est. flood insurance / yr
- $473 – $860
Fire risk 5/10 · Moderate
- Est. fire insurance / yr
- $902 – $1,676
Heat risk 3/10 · Minor
- Hot days now (above 104°F)
- 7 days/yr
- Hot days in 30 yrs
- 15 days/yr
Wind risk 2/10 · Minimal
- Chance of severe wind over 30 yrs
- —
Air-quality risk 2/10 · Minimal
- Unhealthy air days now
- 1 days/yr
- Unhealthy air days in 30 yrs
- 2 days/yr
Risk factors via First Street. Map © Google.
Why this score? — see what drove the B grade
The composite is a weighted blend of 9 inputs, each scored 0–100. Each bar is that input's sub-score; the figure is the points it added to the 100-point composite (weight × sub-score).
- Cash flow +30.0/30.0
- 1% rule +10.0/10.0
- DSCR +10.0/10.0
- ARV discount +7.5/15.0
- Schools +5.1/10.0
- Livability +4.0/5.0
- Rent growth +2.5/5.0
- Condition / age +2.5/5.0
- Appreciation +0.0/10.0
$55,000
🖨 Deal sheet 📄 Offer letter ✓ Due diligence
Listing remarks MLS
Nice older family home needs some work. Property is being sold in it "AS-IS" condition. Pool table to stay with property.
Key facts
- 9,148 sq ft lot
- Garage
- Built 1900
Neighborhood map
What this means for you Summary
Snapshot
- This is a 3-bed/1.0-bath single-family listed at $55k.
Deal economics
- At list price, monthly cash flow is $554 ($7k/yr) — positive.
- The deal already cash-flows at list — no discount required.
- Meets the 1% rule at list price ($1k rent vs $55k).
- Recommended offer: $48k (12.0% below list) — sets the bar for market timing.
- Cap rate 18.4% vs local median 4.0% in Chariton — top-decile yield for the area; either an underpriced asset or a hidden risk that comps aren't pricing in. Stress-test before assuming the spread holds.
Location & tenants
- Location reads 80/100 on livability (#84 in IA, #1,703 nationally) — a professional / high-income tenant draw. Strengths: cost of living A+, housing A+, health & safety A+; Watch: employment C-, amenities F, commute F.
- Chariton Community School District (town): math 57% / reading 65% proficiency, ranked #241 of 289 in IA (top 83%) — acceptable for families but not a draw, mixed tenant base, ~2y average lease.
- Market conditions: 80 active listings in the ZIP; 3 units permitted in Lucas County in 2024 (0 in 5+ unit buildings).
Forward outlook
- Local home prices are declining (-3.0%/yr); year-one equity from $380 of loan paydown is wiped out by about $2k of value loss. Plan a longer hold.
- Lucas County population projected at -23% by 2050 — secular population decline; favor cash flow + early exit over multi-decade hold.
- At projected returns (-3.0% appreciation + 3.0% rent growth), your $15k cash investment doubles in ~3 years — after that, you're playing with house money.
Negotiation context
- It's been on market 381 days — a 12% lower offer ($48k) is reasonable based on typical stale-listing flexibility.
- 3 sale attempts; this cycle's ask has dropped $40k (42%) from the opening price — seller is motivated, your offer sets the floor, not the list.
Risks & watch-outs
- Watch-outs: property tax is 3.9% of price; built in 1900 — expect roof / HVAC / electrical / plumbing capex.
- Climate carrying-cost: moderate wildfire risk — expect insurance premiums to compound above CPI over the hold.
Questions for the listing agent
- It's been on market 381 days. Have you received any prior offers? Is the seller open to a 12% concession, seller financing, or rate buy-down credit?
- Built in 1900 — when were the roof, HVAC, electrical panel, plumbing, and water heater last replaced?
- Property tax is high relative to price — has the assessment been appealed recently, and will the sale trigger a re-assessment?
- Why hasn't it sold? Are there any deal-killer items the seller is aware of (foundation, flood, title, zoning, code violations)?
- Is there a deadline driving the sale (1031 exchange, divorce, estate, relocation)? That informs how much negotiation room exists.
- Schools are A-rated — typically a magnet for longer-tenancy family renters. What's the average tenant stay here, and is there a school-zone premium baked into asking?
- What's the average days-on-market for RENTAL listings here right now (not sales)? A rising rental-DOM trend means longer vacancies and softer asking-rent achievability than the comps imply.
- What's the recent tenant-quality profile in this submarket — average credit score on applications, eviction rate, late-payment / NSF rate, and stable-employment percentage? A property-management company in the area should have these aggregated.
- How much new for-sale + rental construction is in the pipeline within 1–3 miles? Heavy new supply typically softens prices + rents 12–24 months out; constrained supply supports both.
Investment metrics
- 1% rule
- 2.40% ✓
- Cap rate
- 18.38%
- Cash-on-cash
- 43.16%
- DSCR
- 2.92
- GRM
- 3.5
CMA / ARV
- ARV (median comp)
- $166,534
- List price
- $55,000
- Delta
- -66.97%
- Verdict
- UNDERPRICED
- Comps
- 20 within 1.0 mi
Show comp detail 12 sales within ~0.75 mi
| Address | Dist | Beds/Ba | Sqft | Sold | Price | $/sf | Match |
|---|---|---|---|---|---|---|---|
| 534 N 8th St | 0.13mi | 3/2.0 | 1,840 (-0%) | 7mo | $206,000 | $112 | 84 |
| 534 N Grand St | 0.11mi | 3/2.0 | 1,972 (+7%) | 2mo | $15,500 | $8 | 78 |
| 632 Osage Ave | 0.27mi | 3/2.0 | 1,844 (-0%) | 13mo | $127,000 | $69 | 72 |
| 821 N Grand St | 0.13mi | 4/2.0 (+1) | 1,926 (+4%) | 14mo | $60,000 | $31 | 67 |
| 1019 Ilion Ave | 0.31mi | 3/2.0 | 1,616 (-13%) | 1mo | $200,000 | $124 | 60 |
| 1223 Park Ave | 0.35mi | 4/2.0 (+1) | 1,780 (-4%) | 12mo | $190,000 | $107 | 58 |
| 1125 Lucas Ave | 0.33mi | 3/3.5 | 1,858 (+0%) | 19mo | $315,000 | $170 | 58 |
| 710 N 6th St | 0.24mi | 3/2.0 | 1,668 (-10%) | 13mo | $250,000 | $150 | 57 |
| 813 Armory Ave | 0.66mi | 3/1.0 | 1,968 (+6%) | 4mo | $162,000 | $82 | 55 |
| 1219 N 12th St | 0.52mi | 3/3.0 | 1,724 (-7%) | 12mo | $205,000 | $119 | 46 |
| 302 S Grand St | 0.69mi | 3/1.0 | 1,680 (-9%) | 8mo | $20,000 | $12 | 46 |
| 1603 Curtis Ave | 0.74mi | 4/1.5 (+1) | 1,824 (-1%) | 14mo | $160,550 | $88 | 44 |
Match score weights: distance 35% · size 25% · config 20% · recency 20%. Top-matched comps best support the ARV.
Projected returns pro-forma
-3.0% appreciation · 3.0% rent growth · sell at horizon
- IRR
- 40.1%
- Equity multiple
- 2.72×
- Total profit
- $26,450
- Equity at exit
- $8,201
- IRR
- 46.4%
- Equity multiple
- 5.47×
- Total profit
- $68,806
- Equity at exit
- $4,755
Cash invested: $15,400 (down + closing). Projections, not guarantees.
Landlord ↔ Tenant lean methodology
- Overall (STATE)
- 83 Strongly Landlord-Friendly
- State Iowa
- 83 Strongly Landlord-Friendly · R+6
- County
- — inherits STATE
- City
- — inherits STATE
ZIP-level market 50049
- Home prices YoY
- -4.4%
- Active inventory
- 80
- Price-to-rent
- 3.5×
Monthly cashflow live
- Estimated rent
- $1,319 medium interval (Pro) →
- Mortgage (P&I)
- −$288
- Tax from tax record
- −$176 /mo · $2,118/yr
- Insurance
- −$23
- HOA
- −$0
- Vacancy / Maint / Mgmt
- −$277
- Net cashflow
- $554
Break-even live
UW: 25.0% down · 7.5% · 30yr · 1.5% tax · 5.0% vac · 8.0% maint · 8.0% mgmt
Financing live
Cash to close
- Down payment
- $13,750
- Closing costs
- $1,650
- Reserves months
- —
- Total cash needed
- —
Loan-product check · same deal, 3 products live
Conventional
25% down · 7.5% · 30yr
- Down + closing
- —
- Monthly P&I
- —
- Monthly cashflow
- —
- DSCR
- —
- Eligible?
- —
Personal DTI + credit; lowest rate.
DSCR
20% down · 8.5% · 30yr
- Down + closing
- —
- Monthly P&I
- —
- Monthly cashflow
- —
- DSCR
- —
- Eligible?
- —
No personal income docs; deal must DSCR.
Hard money
10% down · 12.0% · 12mo
- Down + closing
- —
- Monthly P&I
- —
- Monthly cashflow
- —
- DSCR
- —
- Eligible?
- —
Short-term bridge; refi at stabilization.
Listing history 24 events
-
2026-06-18days on market $55,000 Active 381 DOM
-
2026-06-17days on market $55,000 Active 380 DOM
-
2026-06-16days on market $55,000 Active 379 DOM
-
2026-06-15days on market $55,000 Active 378 DOM
-
2026-06-13days on market $55,000 Active 376 DOM
-
2026-06-12days on market $55,000 Active 375 DOM
-
2026-06-09days on market $55,000 Active 372 DOM
-
2026-06-08days on market $55,000 Active 371 DOM
-
2026-06-07days on market $55,000 Active 370 DOM
-
2026-06-07days on market $55,000 Active 369 DOM
-
2026-06-04days on market $55,000 Active 366 DOM
-
2026-06-02days on market $55,000 Active 365 DOM
-
2026-06-01days on market $55,000 Active 364 DOM
-
2026-05-31days on market $55,000 Active 363 DOM
-
2026-05-31days on market $55,000 Active 362 DOM
-
2026-05-19price $55,000 131-char remark
Show marketing remark (131 chars)
Nice older family home needs some work. Property is being sold in it "AS-IS" condition. Pool table to stay with property.
-
2026-04-30status Active 131-char remark
Show marketing remark (131 chars)
Nice older family home needs some work. Property is being sold in it "AS-IS" condition. Pool table to stay with property.
-
2026-04-30price $59,900 131-char remark
Show marketing remark (131 chars)
Nice older family home needs some work. Property is being sold in it "AS-IS" condition. Pool table to stay with property.
-
2026-03-30status Pending 131-char remark
Show marketing remark (131 chars)
Nice older family home needs some work. Property is being sold in it "AS-IS" condition. Pool table to stay with property.
-
2025-11-05status Active 131-char remark
Show marketing remark (131 chars)
Nice older family home needs some work. Property is being sold in it "AS-IS" condition. Pool table to stay with property.
-
2025-11-05price $74,900 131-char remark
Show marketing remark (131 chars)
Nice older family home needs some work. Property is being sold in it "AS-IS" condition. Pool table to stay with property.
-
2025-10-17price $79,900 131-char remark
Show marketing remark (131 chars)
Nice older family home needs some work. Property is being sold in it "AS-IS" condition. Pool table to stay with property.
-
2025-06-02price $89,900 131-char remark
Show marketing remark (131 chars)
Nice older family home needs some work. Property is being sold in it "AS-IS" condition. Pool table to stay with property.
-
2025-04-28$95,000 Active 131-char remark
Show marketing remark (131 chars)
Nice older family home needs some work. Property is being sold in it "AS-IS" condition. Pool table to stay with property.
ⓘ Source: listings_history table (triggers on properties + properties_extension) + one-shot
backfill from property_details.listing_events for pre-trigger history.
Tax reassessment forecast IA · Partial reset (capped growth)
- Current annual tax
- $2,118 · $176/mo
- Projected year-2 tax
- $2,118 · $176/mo
- Expected delta
- $0/yr ($0/mo · 0.0%)
ⓘ Screening estimate from a state-policy table — verify with the county assessor before closing.
Climate risk First Street
- Flood 1/10 Low FEMA zone X (unshaded) · 0% chance over 30 yrs
- Wildfire 5/10 Major
- Heat 3/10 Moderate 7 d/yr ≥104°F today · 15 d/yr by 30 yrs out
- Wind 2/10 Low
- Air quality 2/10 Low 1 unhealthy d/yr today · 2 by 30 yrs out
Nearby sold comps map
Loading sold comps map…
Walkable amenities ~0.75 mi
Loading nearby amenities…
Taxation est. · year 1
- Rental income
- $15,823
- − Mortgage interest
- −$3,081
- − Property taxes
- −$2,118
- − Insurance
- −$275
- − Repairs & maintenance
- −$1,266
- − Management
- −$1,266
- − Depreciation
- −$1,600
- Taxable income
- $6,218
- Est. tax owed @ 24.0%
- −$1,492
- After-tax cash flow
- $5,154/yr
For passive investors: Depreciation is non-cash, so a rental often shows a tax loss while cash-flowing — sheltering income. Rental losses are passive: they offset passive income freely, and up to $25,000/yr can offset ordinary (W-2) income if you actively participate and your MAGI is under $100k (phasing out to $0 by $150k); unused losses carry forward. On sale, claimed depreciation is recaptured at up to 25%, and gains may owe capital-gains tax (a 1031 exchange can defer both). Figures are a year-1 estimate at your 24.0% rate — not tax advice; consult a CPA.
Schools (NCES district)
- District
- Chariton Community School District
- NCES district ID
- 1907050
- Math proficiency
- 57% ▼ -11.00%
- Reading proficiency
- 65% ▼ -6.00%
- Median HH income
- $44,415
- Composite
- 51.35/100
- National rank
- #1738
- State rank
- #241 of 289 in IA
Livability — Chariton
- Score
- 80/100
- State rank
- #84
- US rank
- #1703
Category grades
Schools grade is shown separately in the Schools card above.
Census & demographics
- Census place
- Chariton, IA
- Population (ZIP)
- 6,425
Population outlook (Lucas County) Hauer SSP2
- Today (2025)
- 8,106 people
- By 2030
- 7,755 · -4.3%
- By 2040
- 7,007 · -13.6%
- By 2050
- 6,265 · -22.7%
- By 2075
- 4,926 · -39.2%
- By 2100
- 3,792 · -53.2%
Race, ethnicity, and origin ACS 2023
- Neighborhood character
- Predominantly White (95%)
- Race & ethnicity
- White 95% Two or more races 3% Hispanic / Latino 2% Asian 1%
- Common ancestry
- Iranian 3% Italian 2% Slovak 2%
- Foreign-born
- 2% · Canada
- Languages at home
- 95% English-only · German/W. Germanic 2% Spanish 2% Other Asian/Pacific 1%
Political lean MEDSL · Lucas
- 2024 margin
- Solid R (+48.1) · D 25.2% · R 73.3% · Other 1.5%
- 2008→2024 swing
- -41.4pp toward R · 2008: -6.7pp · 2024: -48.1pp
- All cycles
- 2024: R+48.1 2020: R+43.3 2016: R+38.1 2012: R+6.3 2008: R+6.7
Not yet ingested
- Civics
- —
Market trends
- HPI YoY
- ▼ -10.20%
- Current HPI
- 220.0223
- Rent YoY
- —
- Metro
- —
- State GDP YoY
- ▲ 2.48%
- F500 in state
- 4
Industry mix (Fortune 500 HQ in IA)
| Industry | F500 HQs | Revenue |
|---|---|---|
| Financial Services | 1 | $16B |
|
||
| Retail / Convenience | 1 | $15B |
|
||
Price history
-42.1% since first listed9 events — show timeline
- 2026-05-19 Price Changed $55,000 IAR
- 2026-04-30 Relisted — IAR
- 2026-04-30 Price Changed $59,900 IAR
- 2026-03-30 Pending — IAR
- 2025-11-05 Relisted — IAR
- 2025-11-05 Price Changed $74,900 IAR
- 2025-10-17 Price Changed $79,900 IAR
- 2025-06-02 Price Changed $89,900 IAR
- 2025-04-28 Listed $95,000 IAR
Property tax history
+3.6%/yrLatest (2025): $2,118 · +5.8% YoY. Source: county tax records.
Cash-flow waterfall
monthlySold comps — $/sqft
last 12 mo · ≤1 miLoading sold comps…