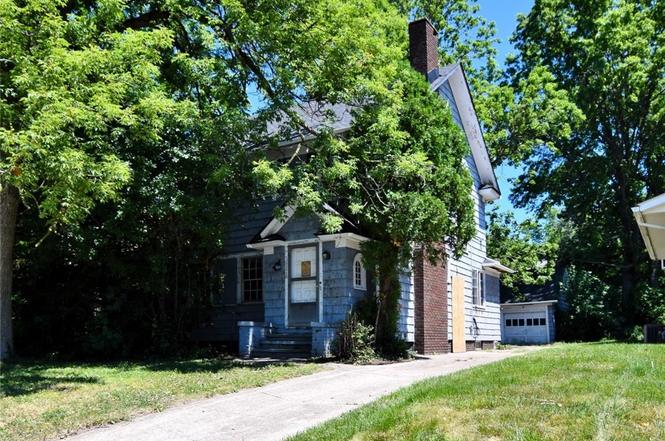
3097 Becket Rd · Cleveland, OH
Flood risk 1/10 · Minimal
- FEMA flood zone
- X (unshaded)
- Chance of flooding over 30 yrs
- 0.0%
- Est. flood insurance / yr
- $473 – $860
Fire risk 1/10 · Minimal
- Est. fire insurance / yr
- $713 – $1,323
Heat risk 3/10 · Minor
- Hot days now (above 95°F)
- 7 days/yr
- Hot days in 30 yrs
- 17 days/yr
Wind risk 1/10 · Minimal
- Chance of severe wind over 30 yrs
- —
Air-quality risk 3/10 · Minor
- Unhealthy air days now
- 3 days/yr
- Unhealthy air days in 30 yrs
- 5 days/yr
Risk factors via First Street. Map © Google.
Why this score? — see what drove the B grade
The composite is a weighted blend of 9 inputs, each scored 0–100. Each bar is that input's sub-score; the figure is the points it added to the 100-point composite (weight × sub-score).
- Cash flow +30.0/30.0
- 1% rule +10.0/10.0
- DSCR +10.0/10.0
- ARV discount +7.5/15.0
- Schools +5.0/10.0
- Livability +3.6/5.0
- Rent growth +3.3/5.0
- Condition / age +2.5/5.0
- Appreciation +0.0/10.0
$99,999
🖨 Deal sheet 📄 Offer letter ✓ Due diligence
Listing remarks
Opportunity knocks!! Cleveland taxes but Shaker Heights Schools! This classic brick colonial is packed with original character, generous space, and architectural details that are increasingly difficult to find. Investors searching for your next project OR handy owner-occupants looking to build equity, this property offers huge potential. A welcoming entry foyer showcases a beautiful original wood front door flanked by charming keyhole windows, setting the stage for the home's timeless appeal. Inside, you'll find a grand living room featuring a fireplace, crown molding, and abundant natural light. An adjoining sitting room provides additional living space, while the formal dining room impre
Key facts
- Grand living room
- Sitting room
- Keyhole windows
Tags
Property features AI
Finance
- Other: Below-grade finished area present
- Financial info: Annual taxes not included per instructions
- HOA & community: HOA information not specified
Exterior
- Parking: Garage (2 spaces)
- Security: Security details not specified
- Utilities: Public water; Public sewer
- Home design: 2-story house
- Construction: Brick, stone, vinyl siding, and wood siding exterior; Asphalt/fiberglass roof
- Exterior features: 0.15-acre lot; Property listed as fixer condition
Interior
- Kitchen: Appliances not specified
- Bedrooms: Not specified
- Flooring: Flooring details not specified
- Bathrooms: 1 full bathroom
- Heating & cooling: Forced air heating; Central air conditioning
- Interior features: Unfinished basement; Total of 6 rooms
- Laundry & utility: Laundry details not specified
Neighborhood map
What this means for you Summary
Snapshot
- This is a 3-bed/1.0-bath single-family listed at $100k.
Deal economics
- At list price, monthly cash flow is $580 ($7k/yr) — positive.
- The deal already cash-flows at list — no discount required.
- Meets the 1% rule at list price ($2k rent vs $100k).
- Cap rate 13.3% vs local median 3.6% in Cleveland — top-decile yield for the area; either an underpriced asset or a hidden risk that comps aren't pricing in. Stress-test before assuming the spread holds.
Location & tenants
- Location reads 71/100 on livability (#403 in OH) — a middle-class / working-renter tenant base. Strengths: amenities A+, cost of living A+, housing A+; Watch: schools D-, crime F, employment F.
- Shaker Heights City (suburban): math 50% / reading 63% proficiency, ranked #309 of 656 in OH (top 47%) — acceptable for families but not a draw, mixed tenant base, ~2y average lease.
- Market conditions: Rents rising (+3.3%/yr); 125 active listings in the ZIP; 22 comparable units currently listed for rent nearby; rentals at typical pace (median 24d on market — plan ~3-4 weeks tenant-placement turnaround); 41% of comp listings sitting > 30 days — soft ceiling on asking rent; 1,441 units permitted in Cuyahoga County in 2024 (700 in 5+ unit buildings).
- This rent runs 41% of the median local income ($47k/yr) — at the standard rent-burdened threshold; future hikes will face affordability resistance.
Forward outlook
- Local home prices are declining (-3.0%/yr); year-one equity from $691 of loan paydown is wiped out by about $3k of value loss. Plan a longer hold.
- Cuyahoga County population projected to shrink 8% by 2050 — rents likely to lag national; underwrite the cash flow, not the appreciation.
- At projected returns (-3.0% appreciation + 3.3% rent growth), your $28k cash investment doubles in ~5 years — after that, you're playing with house money.
Negotiation context
- Only 8 days on market — expect competitive offers; lowballing is unlikely to land.
Risks & watch-outs
- Watch-outs: built in 1920 — expect roof / HVAC / electrical / plumbing capex.
Questions for the listing agent
- Built in 1920 — when were the roof, HVAC, electrical panel, plumbing, and water heater last replaced?
- Is there a deadline driving the sale (1031 exchange, divorce, estate, relocation)? That informs how much negotiation room exists.
- Schools are D-rated, which usually means shorter tenancies and higher turnover. Who's the typical renter profile here, and what's been the actual vacancy rate?
- Crime grade is F in this area — have there been break-ins, vandalism, or insurance claims at this property in the last 3 years? What carrier currently insures it and at what premium?
- What's the average days-on-market for RENTAL listings here right now (not sales)? A rising rental-DOM trend means longer vacancies and softer asking-rent achievability than the comps imply.
- What's the recent tenant-quality profile in this submarket — average credit score on applications, eviction rate, late-payment / NSF rate, and stable-employment percentage? A property-management company in the area should have these aggregated.
- How much new for-sale + rental construction is in the pipeline within 1–3 miles? Heavy new supply typically softens prices + rents 12–24 months out; constrained supply supports both.
Investment metrics
- 1% rule
- 1.61% ✓
- Cap rate
- 13.25%
- Cash-on-cash
- 24.86%
- DSCR
- 2.11
- GRM
- 5.2
CMA / ARV
- ARV (on-the-fly)
- $217,192
- Comps found
- 7
Show comp detail 7 sales within ~0.75 mi
| Address | Dist | Beds/Ba | Sqft | Sold | Price | $/sf | Match |
|---|---|---|---|---|---|---|---|
| 3063 Ashwood Rd | 0.13mi | 3/1.5 | 1,572 (-2%) | 5mo | $190,000 | $121 | 86 |
| 3136 Becket Rd | 0.08mi | 3/1.5 | 1,598 (+0%) | 13mo | $218,000 | $136 | 84 |
| 3146 Ashwood Rd | 0.10mi | 3/1.5 | 1,587 (-1%) | 22mo | $97,000 | $61 | 73 |
| 3131 Ashwood Rd | 0.06mi | 4/1.5 (+1) | 1,722 (+8%) | 16mo | $220,000 | $128 | 64 |
| 14160 Onaway Rd | 0.19mi | 3/1.5 | 1,728 (+8%) | 23mo | $325,000 | $188 | 56 |
| 3075 Ludlow Rd | 0.19mi | 3/2.0 | 1,797 (+12%) | 23mo | $250,000 | $139 | 48 |
| 3191 Warrington Rd | 0.67mi | 4/2.5 (+1) | 1,744 (+9%) | 18mo | $300,000 | $172 | 27 |
Match score weights: distance 35% · size 25% · config 20% · recency 20%. Top-matched comps best support the ARV.
Projected returns pro-forma
-3.0% appreciation · 3.34% rent growth · sell at horizon
- IRR
- 18.7%
- Equity multiple
- 1.76×
- Total profit
- $21,323
- Equity at exit
- $14,910
- IRR
- 27.3%
- Equity multiple
- 3.45×
- Total profit
- $68,527
- Equity at exit
- $8,646
Cash invested: $28,000 (down + closing). Projections, not guarantees.
Landlord ↔ Tenant lean methodology
- Overall (STATE)
- 73 Landlord-Friendly
- State Ohio
- 73 Landlord-Friendly · R+6
- County
- — inherits STATE
- City
- — inherits STATE
ZIP-level market 44120
- Rents YoY
- 3.3%
- Active inventory
- 125
- Price-to-rent
- 5.2×
Monthly cashflow live
- Estimated rent
- $1,609 high interval (Pro) →
- Mortgage (P&I)
- −$524
- Tax est. 1.5%
- −$125 /mo · $1,500/yr
- Insurance
- −$42
- HOA
- −$0
- Vacancy / Maint / Mgmt
- −$338
- Net cashflow
- $580
Break-even live
UW: 25.0% down · 7.5% · 30yr · 1.5% tax · 5.0% vac · 8.0% maint · 8.0% mgmt
Financing live
Cash to close
- Down payment
- $25,000
- Closing costs
- $3,000
- Reserves months
- —
- Total cash needed
- —
Loan-product check · same deal, 3 products live
Conventional
25% down · 7.5% · 30yr
- Down + closing
- —
- Monthly P&I
- —
- Monthly cashflow
- —
- DSCR
- —
- Eligible?
- —
Personal DTI + credit; lowest rate.
DSCR
20% down · 8.5% · 30yr
- Down + closing
- —
- Monthly P&I
- —
- Monthly cashflow
- —
- DSCR
- —
- Eligible?
- —
No personal income docs; deal must DSCR.
Hard money
10% down · 12.0% · 12mo
- Down + closing
- —
- Monthly P&I
- —
- Monthly cashflow
- —
- DSCR
- —
- Eligible?
- —
Short-term bridge; refi at stabilization.
Rent comps 22 comps
| Address | Beds | Baths | Sqft | Rent | $/sqft | DOM | Units | Dist |
|---|---|---|---|---|---|---|---|---|
| 3012 Albion Rd Cleveland, OH | 3.0 | 1.5 | 1942 | $1,900 | $0.98 | 2d | 1 | 0.15mi |
| 14108 Becket Rd Cleveland, OH | 4.0 | 3.5 | 1660 | $2,206 | $1.33 | 44d | 1 | 0.19mi |
| 13419 S Woodland Rd #7 Cleveland, OH | 2.0 | 1.0 | 1328 | $1,150 | $0.87 | 44d | 1 | 0.33mi |
| 2828 S Moreland Blvd Cleveland, OH | 2.0 | 1.0 | 1156 | $1,325 | $1.15 | 16d | 1 | 0.52mi |
| 14014 Shaker Blvd Apt 305 Shaker Heights, OH | 3.0 | 2.0 | 1224 | $1,430 | $1.17 | 4d | 1 | 0.54mi |
| 3348 Colwyn Rd Cleveland, OH | 3.0 | 1.0 | 1330 | $1,199 | $0.90 | 24d | 1 | 0.71mi |
| 2666 N Moreland Blvd Cleveland, OH | 2.0 | 1.0 | 1250 | $1,250 | $1.00 | 44d | 1 | 0.76mi |
| 2590 N Moreland Blvd Unit SLAD22 Shaker Heights, OH | 2.0 | 1.0 | 1120 | $1,150 | $1.03 | 12d | 1 | 0.92mi |
| 2590 N Moreland Blvd Unit SLAE12 Shaker Heights, OH | 2.0 | 1.0 | 1210 | $1,200 | $0.99 | 44d | 1 | 0.92mi |
| 2590 N Moreland Blvd Unit SLAE22 Shaker Heights, OH | 2.0 | 1.0 | 1210 | $1,200 | $0.99 | 12d | 1 | 0.92mi |
| 2576 Kemper Rd Unit 211 Shaker Heights, OH | 2.0 | 1.0 | 1260 | $999 | $0.79 | 44d | 1 | 0.95mi |
| 2576 Kemper Rd Unit 2572 Shaker Heights, OH | 3.0 | 1.0 | 1260 | $1,275 | $1.01 | 44d | 1 | 0.95mi |
| 2576 Kemper Rd Unit 209 Shaker Heights, OH | 2.0 | 1.0 | 1103 | $999 | $0.91 | 24d | 1 | 0.95mi |
| 2638 E 126th St Unit 1496049P Cleveland, OH | 2.0 | 1.0 | 2238 | $4,055 | $1.81 | 8d | 1 | 0.96mi |
| 2560 N Moreland Blvd Cleveland, OH | 2.0–3.0 | 2.0–3.5 | 1800 | $4,100 | $2.28 | 2d | 1 | 0.96mi |
| 2538 Kemper Rd Unit 2534 Shaker Heights, OH | 2.0 | 1.0 | 1217 | $1,175 | $0.97 | 20d | 1 | 1.01mi |
| 16015 Van Aken Blvd Cleveland, OH | 2.0–4.0 | 2.0 | 1360 | $1,295 | $0.95 | 8d | 4 | 1.05mi |
| 13660 Fairhill Rd Cleveland, OH | 1.0–2.0 | 1.0 | 862 | $1,250 | $1.45 | 16d | 5 | 1.13mi |
| 2523 E 124th St Unit 1 Cleveland, OH | 2.0 | 1.0 | 1200 | $2,850 | $2.38 | 24d | 1 | 1.15mi |
| 3698 Menlo Rd Unit 3700 Shaker Heights, OH | 2.0 | 1.0 | 1079 | $1,360 | $1.26 | 44d | 1 | 1.31mi |
| 3656 Chelton Rd Cleveland, OH | 2.0 | 1.0 | 1200 | $1,300 | $1.08 | 44d | 1 | 1.41mi |
| 15602 Scottsdale Blvd Cleveland, OH | 3.0 | 1.5 | 1162 | $1,665 | $1.43 | 44d | 1 | 1.42mi |
Listing history 8 events
-
2026-06-18days on market $99,999 Active 8 DOM
-
2026-06-17days on market $99,999 Active 7 DOM
-
2026-06-16days on market $99,999 Active 6 DOM
-
2026-06-15price $99,999 Active 5 DOM
-
2026-06-15days on market $114,900 Active 5 DOM
-
2026-06-13days on market $114,900 Active 3 DOM
-
2026-06-13remarks 699-char remark
-
2026-06-13$114,900 Active 2 DOM
ⓘ Source: listings_history table (triggers on properties + properties_extension) + one-shot
backfill from property_details.listing_events for pre-trigger history.
Climate risk First Street
- Flood 1/10 Low FEMA zone X (unshaded) · 0% chance over 30 yrs
- Wildfire 1/10 Low
- Heat 3/10 Moderate 7 d/yr ≥95°F today · 17 d/yr by 30 yrs out
- Wind 1/10 Low
- Air quality 3/10 Moderate 3 unhealthy d/yr today · 5 by 30 yrs out
Nearby sold comps map
Loading sold comps map…
Walkable amenities ~0.75 mi
Loading nearby amenities…
Taxation est. · year 1
- Rental income
- $19,310
- − Mortgage interest
- −$5,601
- − Property taxes
- −$1,500
- − Insurance
- −$500
- − Repairs & maintenance
- −$1,545
- − Management
- −$1,545
- − Depreciation
- −$2,909
- Taxable income
- $5,710
- Est. tax owed @ 24.0%
- −$1,370
- After-tax cash flow
- $5,591/yr
For passive investors: Depreciation is non-cash, so a rental often shows a tax loss while cash-flowing — sheltering income. Rental losses are passive: they offset passive income freely, and up to $25,000/yr can offset ordinary (W-2) income if you actively participate and your MAGI is under $100k (phasing out to $0 by $150k); unused losses carry forward. On sale, claimed depreciation is recaptured at up to 25%, and gains may owe capital-gains tax (a 1031 exchange can defer both). Figures are a year-1 estimate at your 24.0% rate — not tax advice; consult a CPA.
Schools (NCES district)
- District
- Shaker Heights City
- NCES district ID
- 3904475
- Math proficiency
- 50% ▼ -16.00%
- Reading proficiency
- 63% ▼ -6.00%
- Median HH income
- $69,421
- Composite
- 49.98/100
- National rank
- #1928
- State rank
- #309 of 656 in OH
Livability — Cleveland
- Score
- 71/100
- State rank
- #403
- US rank
- #6673
Category grades
Schools grade is shown separately in the Schools card above.
Census & demographics
- Census place
- Cleveland, OH
- County
- Cuyahoga County · 1,090,369 people
- City population
- 326,883
- Metro
- Cleveland-Elyria, OH
- Population (ZIP)
- 33,202
- Household income
- $47,126
- Rent vs Own
- Severe rent burden
- 2289.0
Population outlook (Cuyahoga County) Hauer SSP2
- Today (2025)
- 1,244,621 people
- By 2030
- 1,230,093 · -1.2%
- By 2040
- 1,189,108 · -4.5%
- By 2050
- 1,145,706 · -7.9%
- By 2075
- 1,076,557 · -13.5%
- By 2100
- 978,987 · -21.3%
Race, ethnicity, and origin ACS 2023
- Neighborhood character
- Predominantly Black (68%)
- Race & ethnicity
- Black 68% White 21% Two or more races 6% Hispanic / Latino 3% Asian 2%
- Common ancestry
- Romanian 2% Italian 1% Slovak 1%
- Foreign-born
- 5% · China, Canada
- Languages at home
- 93% English-only · Spanish 2% Chinese 1% Other Indo-European 1%
Political lean MEDSL · Cuyahoga
- 2024 margin
- Solid D (+31.5) · D 65.4% · R 33.9%
- 2008→2024 swing
- -7.4pp toward R · 2008: 38.9pp · 2024: 31.5pp
- All cycles
- 2024: D+31.5 2020: D+34.1 2016: D+35.0 2012: D+38.7 2008: D+38.9
Not yet ingested
- Civics
- —
Market trends
- HPI YoY
- ▼ -201.50%
- Current HPI
- 108.2487
- Rent YoY
- ▲ 3.34%
- Metro
- Cleveland-Elyria, OH
- State GDP YoY
- ▲ 1.98%
- F500 in state
- 48
Industry mix (Fortune 500 HQ in OH)
| Industry | F500 HQs | Revenue |
|---|---|---|
| Insurance | 3 | $145B |
|
||
| Industrial Machinery | 3 | $49B |
|
||
| Financial Services | 3 | $24B |
|
||
| Consumer Goods | 2 | $93B |
|
||
| Aerospace / Defense | 2 | $47B |
|
||
| Utilities | 2 | $33B |
|
||
Price history
+20.9% since first listed2 events — show timeline
- 2026-06-10 Listed $114,900 MLSNOW
- 2025-10-31 Sold (Public Records) $95,000 Public Records
Property tax history
+4.6%/yrLatest (2025): $5,440 · +13.1% YoY. Source: county tax records.
Cash-flow waterfall
monthlySold comps — $/sqft
last 12 mo · ≤1 miLoading sold comps…