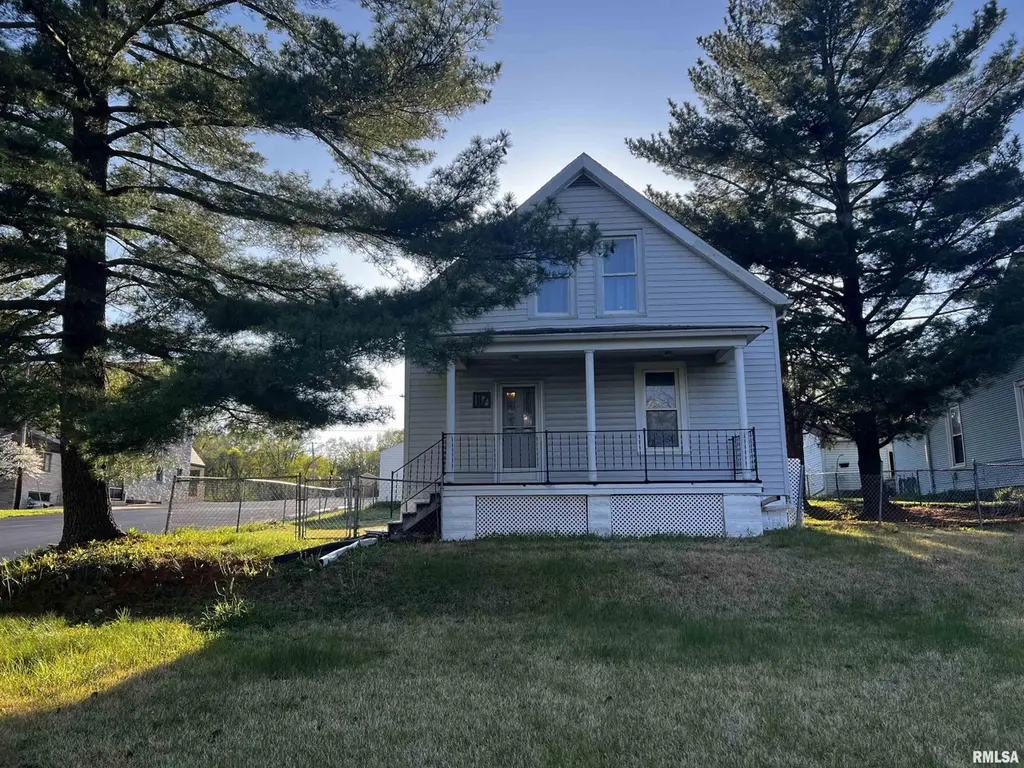
117 Hill St · Bartonville, IL
Flood risk 1/10 · Minimal
- FEMA flood zone
- X
- Chance of flooding over 30 yrs
- 0.0%
- Est. flood insurance / yr
- $473 – $860
Fire risk 1/10 · Minimal
- Est. fire insurance / yr
- $804 – $1,492
Heat risk 3/10 · Minor
- Hot days now (above 105°F)
- 7 days/yr
- Hot days in 30 yrs
- 18 days/yr
Wind risk 2/10 · Minimal
- Chance of severe wind over 30 yrs
- 1.0%
Air-quality risk 3/10 · Minor
- Unhealthy air days now
- 1 days/yr
- Unhealthy air days in 30 yrs
- 3 days/yr
Risk factors via First Street. Map © Google.
Why this score? — see what drove the C+ grade
The composite is a weighted blend of 9 inputs, each scored 0–100. Each bar is that input's sub-score; the figure is the points it added to the 100-point composite (weight × sub-score).
- Cash flow +17.6/30.0
- ARV discount +15.0/15.0
- DSCR +5.5/10.0
- Appreciation +5.0/10.0
- 1% rule +4.7/10.0
- Condition / age +3.8/5.0
- Livability +3.1/5.0
- Schools +2.9/10.0
- Rent growth +2.5/5.0
$100,000
🖨 Deal sheet (PDF) 📄 Offer letter ✓ Due diligence
Listing remarks
minutes from Bartonville grade school.
Key facts
- 8,276 sq ft lot
- Garage
- Built 1930
Property features AI
Exterior
- Parking: Detached garage (1 car); Parking pad
- Utilities: Public water; Public sewer
- Home design: Single family residence; Two levels
- Construction: Built in 1930
- Exterior features: Shingle roof; Sloped lot
Interior
- Kitchen: Kitchen with laminate flooring
- Bedrooms: 3 bedrooms (one on main level, others on upper level)
- Flooring: Luxury vinyl plank in living and family rooms and one bedroom; Carpet in two upper-level bedrooms; Laminate in kitchen
- Bathrooms: 1 full bathroom
- Heating & cooling: Central air
- Interior features: Dishwasher; Microwave; Full basement
- Laundry & utility: Main-level laundry room
Neighborhood map
What this means for you Summary
Snapshot
- This is a 3-bed/1.0-bath single-family listed at $100k. Condition is rated good.
Deal economics
- At list price, monthly cash flow is $78 ($942/yr) — positive.
- The deal already cash-flows at list — no discount required.
- To meet the 1% rule (rent ≥ 1% of price), the offer needs to be $97k (2.6% below list).
- Recommended offer: $97k (2.6% below list) — sets the bar for 1% rule.
- Cap rate 7.2% vs local median 3.5% in Bartonville — top-decile yield for the area; either an underpriced asset or a hidden risk that comps aren't pricing in. Stress-test before assuming the spread holds.
Location & tenants
- Location reads 62/100 on livability (#840 in IL) — a middle-class / working-renter tenant base. Strengths: cost of living A+, housing A+; Watch: crime D+, amenities F, commute F.
- Limestone Chsd 310 (rural): math 25% / reading 35% proficiency, ranked #486 of 919 in IL (top 53%) — families likely to look elsewhere, expect single-tenant / working-renter base with shorter leases.
- Zoned schools: Bartonville Elem School (math 8% / reading 12%, grade F, #1,517 of 2,056 statewide, top 78%, 230 students, 0% FRL); Limestone Community High School (math 17% / reading 22%, grade F, #397 of 693 statewide, top 61%, 924 students, 0% FRL).
- Zoned-school proficiency averages 15% at this address vs 30% district-wide (-15 pts) — the specific schools serving this property underperform the Limestone Chsd 310 average; the district grade overstates school quality for this exact location.
- Market conditions: 1 active listings in the ZIP; 3 comparable units currently listed for rent nearby; rentals at typical pace (median 16d on market — plan ~3-4 weeks tenant-placement turnaround); 73 units permitted in Peoria County in 2024 (0 in 5+ unit buildings).
Forward outlook
- In year one you build about $4k of equity ($691 loan paydown + $3k appreciation (3.0% local appreciation)).
- Peoria County population projected at -11% by 2050 — secular population decline; favor cash flow + early exit over multi-decade hold.
- At projected returns (3.0% appreciation + 3.0% rent growth), your $28k cash investment doubles in ~6 years — after that, you're playing with house money.
- By year 9, paydown + projected appreciation supports a ~$31k cash-out refi (75% LTV) — recoverable capital for the next deal without selling this one.
Negotiation context
- It's been on market 28 days — a 2% lower offer ($98k) is reasonable based on typical stale-listing flexibility.
Risks & watch-outs
- Watch-outs: built in 1930 — expect roof / HVAC / electrical / plumbing capex.
Questions for the listing agent
- Built in 1930 — when were the roof, HVAC, electrical panel, plumbing, and water heater last replaced?
- Is there a deadline driving the sale (1031 exchange, divorce, estate, relocation)? That informs how much negotiation room exists.
- Schools are D-rated, which usually means shorter tenancies and higher turnover. Who's the typical renter profile here, and what's been the actual vacancy rate?
- Crime grade is D in this area — have there been break-ins, vandalism, or insurance claims at this property in the last 3 years? What carrier currently insures it and at what premium?
- What's the average days-on-market for RENTAL listings here right now (not sales)? A rising rental-DOM trend means longer vacancies and softer asking-rent achievability than the comps imply.
- What's the recent tenant-quality profile in this submarket — average credit score on applications, eviction rate, late-payment / NSF rate, and stable-employment percentage? A property-management company in the area should have these aggregated.
- How much new for-sale + rental construction is in the pipeline within 1–3 miles? Heavy new supply typically softens prices + rents 12–24 months out; constrained supply supports both.
Investment metrics
- 1% rule
- 0.97% ✗
- Cap rate
- 7.23%
- Cash-on-cash
- 3.36%
- DSCR
- 1.15
- GRM
- 8.6
CMA / ARV
- ARV (on-the-fly)
- $123,656
- Comps found
- 10
Show comp detail 10 sales within ~0.75 mi
| Address | Dist | Beds/Ba | Sqft | Sold | Price | $/sf | Match |
|---|---|---|---|---|---|---|---|
| 100 Lewis Ct | 0.21mi | 4/2.0 (+1) | 1,212 (+2%) | 2mo | $130,000 | $107 | 76 |
| 320 Treasure St | 0.27mi | 4/1.0 (+1) | 1,227 (+3%) | 12mo | $85,000 | $69 | 67 |
| 123 Roosevelt St | 0.15mi | 3/2.0 | 1,132 (-5%) | 17mo | $55,000 | $49 | 67 |
| 107 Argentina Ave | 0.49mi | 3/1.0 | 1,130 (-5%) | 4mo | $118,000 | $104 | 66 |
| 114 Amsler St | 0.23mi | 3/1.0 | 1,235 (+4%) | 21mo | $128,750 | $104 | 65 |
| 106 Anna St | 0.54mi | 3/1.5 | 1,256 (+6%) | 8mo | $161,000 | $128 | 57 |
| 507 W Garfield Ave | 0.47mi | 3/1.0 | 1,220 (+3%) | 22mo | $125,000 | $102 | 55 |
| 6107 S Adams St | 0.27mi | 3/2.0 | 1,320 (+11%) | 21mo | $45,000 | $34 | 48 |
| 100 S Sanderson Ave | 0.71mi | 3/1.0 | 1,024 (-14%) | 5mo | $146,200 | $143 | 40 |
| 332 Harris Ln | 0.35mi | 2/1.0 (-1) | 1,016 (-15%) | 21mo | $105,000 | $103 | 37 |
Match score weights: distance 35% · size 25% · config 20% · recency 20%. Top-matched comps best support the ARV.
Projected returns pro-forma
3.0% appreciation · 3.0% rent growth · sell at horizon
- IRR
- 10.6%
- Equity multiple
- 1.61×
- Total profit
- $17,059
- Equity at exit
- $44,964
- IRR
- 12.9%
- Equity multiple
- 2.92×
- Total profit
- $53,760
- Equity at exit
- $69,295
Cash invested: $28,000 (down + closing). Projections, not guarantees.
Landlord ↔ Tenant lean methodology
- Overall (STATE)
- 43 Moderately Tenant-Leaning
- State Illinois
- 43 Moderately Tenant-Leaning · D+7
- County
- — inherits STATE
- City
- — inherits STATE
ZIP-level market 61607-1947
- Active inventory
- 1
- Price-to-rent
- 8.6×
Monthly cashflow live
- Estimated rent
- $974 medium interval (Pro) →
- Mortgage (P&I)
- −$524
- Tax est. 1.5%
- −$125 /mo · $1,500/yr
- Insurance
- −$42
- HOA
- −$0
- Vacancy / Maint / Mgmt
- −$205
- Net cashflow
- $78
Break-even live
Sensitivity live
| Price | -10% $148 | -5% $113 | +0% $78 | +5% $44 | +10% $9 |
|---|---|---|---|---|---|
| Rent | -10% $2 | -5% $40 | +0% $78 | +5% $117 | +10% $155 |
| Rate | -1.0pp $129 | -0.5pp $104 | base $78 | +0.5pp $53 | +1.0pp $26 |
UW: 25.0% down · 7.5% · 30yr · 1.5% tax · 5.0% vac · 8.0% maint · 8.0% mgmt
Financing live
Cash to close
- Down payment
- $25,000
- Closing costs
- $3,000
- Reserves months
- —
- Total cash needed
- —
Loan-product check · same deal, 3 products live
Conventional
25% down · 7.5% · 30yr
- Down + closing
- —
- Monthly P&I
- —
- Monthly cashflow
- —
- DSCR
- —
- Eligible?
- —
Personal DTI + credit; lowest rate.
DSCR
20% down · 8.5% · 30yr
- Down + closing
- —
- Monthly P&I
- —
- Monthly cashflow
- —
- DSCR
- —
- Eligible?
- —
No personal income docs; deal must DSCR.
Hard money
10% down · 12.0% · 12mo
- Down + closing
- —
- Monthly P&I
- —
- Monthly cashflow
- —
- DSCR
- —
- Eligible?
- —
Short-term bridge; refi at stabilization.
Rent comps 3 comps
| Address | Beds | Baths | Sqft | Rent | $/sqft | DOM | Units | Dist |
|---|---|---|---|---|---|---|---|---|
| 5817 S Adams St Bartonville, IL | 2.0 | 1.0 | 768 | $975 | $1.27 | 15d | 1 | 0.05mi |
| 2916 W Meidroth St Peoria, IL | 2.0 | 1.0 | 1125 | $1,049 | $0.93 | 23d | 1 | 1.08mi |
| 1825 S Kneer Ave Peoria, IL | 2.0 | 1.0 | 858 | $858 | $1.00 | 15d | 1 | 1.17mi |
Listing history 3 events
-
2026-05-20status Pending
-
2026-05-18price $100,000
-
2026-04-20$119,900 Active
ⓘ Source: listings_history table (triggers on properties + properties_extension) + one-shot
backfill from property_details.listing_events for pre-trigger history.
Climate risk First Street
- Flood 1/10 Low FEMA zone X · 0% chance over 30 yrs
- Wildfire 1/10 Low
- Heat 3/10 Moderate 7 d/yr ≥105°F today · 18 d/yr by 30 yrs out
- Wind 2/10 Low 100% chance of damaging wind over 30 yrs
- Air quality 3/10 Moderate 1 unhealthy d/yr today · 3 by 30 yrs out
Nearby sold comps map
Loading sold comps map…
Walkable amenities ~0.75 mi
Loading nearby amenities…
Taxation est. · year 1
- Rental income
- $11,689
- − Mortgage interest
- −$5,602
- − Property taxes
- −$1,500
- − Insurance
- −$500
- − Repairs & maintenance
- −$935
- − Management
- −$935
- − Depreciation
- −$2,909
- Taxable loss
- −$692
- Est. tax savings @ 24.0%
- +$166
- After-tax cash flow
- $1,108/yr
For passive investors: Depreciation is non-cash, so a rental often shows a tax loss while cash-flowing — sheltering income. Rental losses are passive: they offset passive income freely, and up to $25,000/yr can offset ordinary (W-2) income if you actively participate and your MAGI is under $100k (phasing out to $0 by $150k); unused losses carry forward. On sale, claimed depreciation is recaptured at up to 25%, and gains may owe capital-gains tax (a 1031 exchange can defer both). Figures are a year-1 estimate at your 24.0% rate — not tax advice; consult a CPA.
Condition & rehab AI · 12 photos
This home is in good condition with recent updates, making it move-in ready for both resale and rental.
Value-add opportunities
- Both paint exterior — enhances curb appeal and value
- Both landscaping — improves curb appeal and rental value
- Both install new window treatments — enhances curb appeal and rental value
Renovation cost estimate screening
Value-add ROI direction
- Both paint exterior — enhances curb appeal and value ↑
- Both landscaping — improves curb appeal and rental value ↑
- Both install new window treatments — enhances curb appeal and rental value ↑
ⓘ Cost ranges are severity-bucket heuristics (US national rule-of-thumb). Get contractor quotes + a written scope before underwriting a rehab budget.
Schools (NCES district)
- District
- Limestone Chsd 310
- NCES district ID
- 1722950
- Math proficiency
- 25% ▲ 5.00%
- Reading proficiency
- 35% ▲ 4.00%
- Median HH income
- $49,759
- Composite
- 28.99/100
- National rank
- #11932
- State rank
- #486 of 919 in IL
Livability — Bartonville
- Score
- 62/100
- State rank
- #840
- US rank
- #16553
Category grades
Schools grade is shown separately in the Schools card above.
Census & demographics
- Census place
- Bartonville, IL
Population outlook (Peoria County) Hauer SSP2
- Today (2025)
- 183,007 people
- By 2030
- 179,643 · -1.8%
- By 2040
- 171,782 · -6.1%
- By 2050
- 163,508 · -10.7%
- By 2075
- 140,178 · -23.4%
- By 2100
- 114,493 · -37.4%
Not yet ingested
- Political lean
- —
- Race & ethnicity
- —
- Common origin
- —
- Civics
- —
Market trends
- HPI YoY
- —
- Current HPI
- —
- Rent YoY
- —
- Metro
- —
- State GDP YoY
- ▲ 1.59%
- F500 in state
- 60
Industry mix (Fortune 500 HQ in IL)
| Industry | F500 HQs | Revenue |
|---|---|---|
| Insurance | 4 | $201B |
|
||
| Consumer Goods | 4 | $87B |
|
||
| Industrial Machinery | 3 | $64B |
|
||
| Healthcare | 2 | $55B |
|
||
| Retail / Pharmacy | 1 | $148B |
|
||
| Agriculture / Food | 1 | $86B |
|
||
Price history
-16.6% since first listed3 events — show timeline
- 2026-05-20 Pending — RMLSA as Distributed by MLS Grid
- 2026-05-18 Price Changed $100,000 RMLSA as Distributed by MLS Grid
- 2026-04-20 Listed $119,900 RMLSA as Distributed by MLS Grid
Cash-flow waterfall
monthlySold comps — $/sqft
last 12 mo · ≤1 miLoading sold comps…