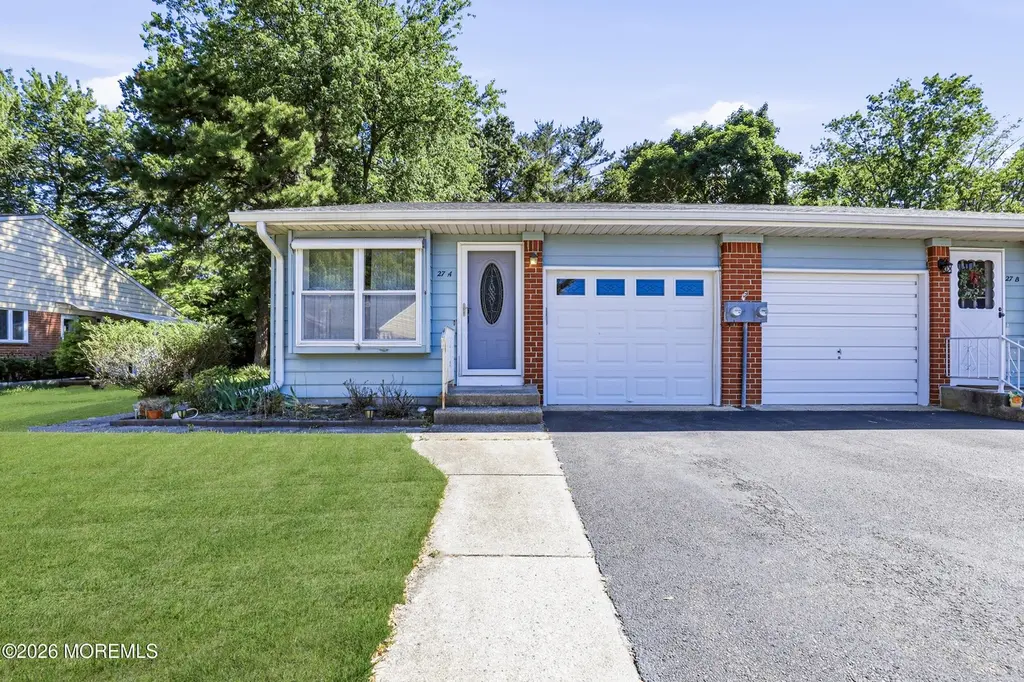
27 A Homestead Dr · Crestwood Village, NJ
Flood risk 1/10 · Minimal
- FEMA flood zone
- X (unshaded)
- Chance of flooding over 30 yrs
- 0.0%
- Est. flood insurance / yr
- $507 – $1,088
Fire risk 5/10 · Moderate
- Est. fire insurance / yr
- $526 – $976
Heat risk 6/10 · Moderate
- Hot days now (above 103°F)
- 7 days/yr
- Hot days in 30 yrs
- 14 days/yr
Wind risk 6/10 · Moderate
- Chance of severe wind over 30 yrs
- 65.0%
Air-quality risk 4/10 · Minor
- Unhealthy air days now
- 4 days/yr
- Unhealthy air days in 30 yrs
- 5 days/yr
Risk factors via First Street. Map © Google.
Why this score? — see what drove the B+ grade
The composite is a weighted blend of 9 inputs, each scored 0–100. Each bar is that input's sub-score; the figure is the points it added to the 100-point composite (weight × sub-score).
- Cash flow +30.0/30.0
- ARV discount +15.0/15.0
- 1% rule +10.0/10.0
- DSCR +10.0/10.0
- Livability +3.2/5.0
- Schools +2.9/10.0
- Rent growth +2.5/5.0
- Condition / age +2.2/5.0
- Appreciation +0.0/10.0
$107,000
🖨 Deal sheet 📄 Offer letter ✓ Due diligence
Listing remarks
Welcome to Crestwood Village III! This charming 2-bedroom, 1.5-bath co-op offers comfortable one-level living in a desirable 55+ community. Features include a spacious living and dining area, eat-in kitchen, attached garage, and abundant natural light throughout. Enjoy a low-maintenance lifestyle with community amenities and beautifully maintained grounds. Conveniently located near shopping, dining, and major roadways. Don't miss the opportunity to make this home your own in one of Whiting's sought-after adult communities.
Key facts
- Community amenities
- Eat in kitchen
- One level living
Tags
Property features AI
Finance
- HOA & community: Part of Crestwood Village III association; Monthly association fee of $385
Exterior
- Parking: 1-car garage
- Utilities: Public sewer
- Home design: Located in Crestwood 3 subdivision; Whiting / Manchester area
- Exterior features: Shingle roof; Property is attached
Interior
- Bedrooms: 2 bedrooms
- Bathrooms: 1 full bathroom and 1 half bathroom (1.5 total)
- Heating & cooling: Electric heating with baseboard; Electric cooling
- Interior features: No fireplaces; No basement
Neighborhood map
What this means for you Summary
Snapshot
- This is a 2-bed/1.5-bath single-family listed at $107k. Condition is rated fair.
Deal economics
- At list price, monthly cash flow is $501 ($6k/yr) — positive.
- The deal already cash-flows at list — no discount required.
- Meets the 1% rule at list price ($2k rent vs $107k).
- Cap rate 11.9% vs local median 5.6% in Crestwood Village — top-decile yield for the area; either an underpriced asset or a hidden risk that comps aren't pricing in. Stress-test before assuming the spread holds.
Location & tenants
- Location reads 63/100 on livability (#422 in NJ) — a middle-class / working-renter tenant base. Strengths: cost of living A, housing A, health & safety B+; Watch: schools F, amenities F, commute F.
- Manchester Township School District (suburban): math 25% / reading 44% proficiency, ranked #320 of 472 in NJ (top 68%) — families likely to look elsewhere, expect single-tenant / working-renter base with shorter leases.
- Market conditions: 648 active listings in the ZIP; 5 comparable units currently listed for rent nearby; rentals at typical pace (median 25d on market — plan ~3-4 weeks tenant-placement turnaround); 40% of comp listings sitting > 30 days — soft ceiling on asking rent; 4,434 units permitted in Ocean County in 2024 (868 in 5+ unit buildings).
Forward outlook
- Local home prices are declining (-3.0%/yr); year-one equity from $740 of loan paydown is wiped out by about $3k of value loss. Plan a longer hold.
- Ocean County population projected to shrink 8% by 2050 — rents likely to lag national; underwrite the cash flow, not the appreciation.
- At projected returns (-3.0% appreciation + 3.0% rent growth), your $30k cash investment doubles in ~6 years — after that, you're playing with house money.
Negotiation context
- Only 13 days on market — expect competitive offers; lowballing is unlikely to land.
Risks & watch-outs
- Climate carrying-cost: major wind risk, 65% chance of damaging wind over 30y; moderate wildfire risk; extreme-heat days projected 7→14/yr by 2055 (HVAC capex compounding) — expect insurance premiums to compound above CPI over the hold.
Questions for the listing agent
- Have any recent inspections been done? Can we get a copy of the seller's disclosures and any deferred-maintenance estimates?
- What does the HOA fee cover, when was the last increase, and are there any pending special assessments or reserve-fund shortfalls?
- Is there a deadline driving the sale (1031 exchange, divorce, estate, relocation)? That informs how much negotiation room exists.
- Schools are F-rated, which usually means shorter tenancies and higher turnover. Who's the typical renter profile here, and what's been the actual vacancy rate?
- What's the average days-on-market for RENTAL listings here right now (not sales)? A rising rental-DOM trend means longer vacancies and softer asking-rent achievability than the comps imply.
- What's the recent tenant-quality profile in this submarket — average credit score on applications, eviction rate, late-payment / NSF rate, and stable-employment percentage? A property-management company in the area should have these aggregated.
- How much new for-sale + rental construction is in the pipeline within 1–3 miles? Heavy new supply typically softens prices + rents 12–24 months out; constrained supply supports both.
Investment metrics
- 1% rule
- 1.92% ✓
- Cap rate
- 11.91%
- Cash-on-cash
- 20.08%
- DSCR
- 1.89
- GRM
- 4.3
CMA / ARV
- ARV (on-the-fly)
- $189,600
- Comps found
- 12
Show comp detail 12 sales within ~0.75 mi
| Address | Dist | Beds/Ba | Sqft | Sold | Price | $/sf | Match |
|---|---|---|---|---|---|---|---|
| 7 Valley Forge Dr Unit A | 0.29mi | 2/2.0 | 1,220 (+2%) | 7mo | $200,000 | $164 | 76 |
| 9 Greenleaf St | 0.41mi | 2/2.0 | 1,193 (-1%) | 4mo | $235,000 | $197 | 74 |
| 12 Birchwood Dr Unit A | 0.46mi | 2/2.0 | 1,184 (-1%) | 4mo | $250,000 | $211 | 71 |
| 16 Hudson Pkwy | 0.31mi | 2/1.5 | 1,318 (+10%) | 0mo | $140,000 | $106 | 69 |
| 12 Birchwood Dr Unit B | 0.46mi | 2/2.0 | 1,184 (-1%) | 7mo | $215,000 | $182 | 68 |
| 2 Cottage Ct Unit A | 0.53mi | 2/1.5 | 1,184 (-1%) | 7mo | $239,000 | $202 | 68 |
| 9 Potomac Ln Unit A | 0.42mi | 2/1.0 | 1,113 (-7%) | 2mo | $112,999 | $102 | 65 |
| 144 B Hudson Pkwy | 0.39mi | 1/1.0 (-1) | 1,235 (+3%) | 7mo | $120,000 | $97 | 64 |
| 2 Liberty Ct | 0.66mi | 2/2.0 | 1,285 (+7%) | 1mo | $165,000 | $128 | 54 |
| 1 Adams Ct | 0.44mi | 2/2.0 | 1,350 (+12%) | 6mo | $178,000 | $132 | 52 |
| 46 Franklin Ln Unit 46A | 0.53mi | 2/2.0 | 1,076 (-10%) | 7mo | $170,000 | $158 | 50 |
| 25 Sunset Rd | 0.74mi | 2/1.0 | 1,101 (-8%) | 3mo | $140,000 | $127 | 47 |
Match score weights: distance 35% · size 25% · config 20% · recency 20%. Top-matched comps best support the ARV.
Projected returns pro-forma
-3.0% appreciation · 3.0% rent growth · sell at horizon
- IRR
- 12.4%
- Equity multiple
- 1.50×
- Total profit
- $14,854
- Equity at exit
- $15,954
- IRR
- 21.5%
- Equity multiple
- 2.84×
- Total profit
- $55,130
- Equity at exit
- $9,251
Cash invested: $29,960 (down + closing). Projections, not guarantees.
Landlord ↔ Tenant lean methodology
- Overall (STATE)
- 21 Tenant-Leaning
- State New Jersey
- 21 Tenant-Leaning · D+6
- County
- — inherits STATE
- City
- — inherits STATE
ZIP-level market 08759
- Active inventory
- 648
- Price-to-rent
- 4.3×
Monthly cashflow live
- Estimated rent
- $2,058 high interval (Pro) →
- Mortgage (P&I)
- −$561
- Tax est. 1.5%
- −$134 /mo · $1,605/yr
- Insurance
- −$45
- HOA
- −$385
- Vacancy / Maint / Mgmt
- −$432
- Net cashflow
- $501
Break-even live
UW: 25.0% down · 7.5% · 30yr · 1.5% tax · 5.0% vac · 8.0% maint · 8.0% mgmt
Financing live
Cash to close
- Down payment
- $26,750
- Closing costs
- $3,210
- Reserves months
- —
- Total cash needed
- —
Loan-product check · same deal, 3 products live
Conventional
25% down · 7.5% · 30yr
- Down + closing
- —
- Monthly P&I
- —
- Monthly cashflow
- —
- DSCR
- —
- Eligible?
- —
Personal DTI + credit; lowest rate.
DSCR
20% down · 8.5% · 30yr
- Down + closing
- —
- Monthly P&I
- —
- Monthly cashflow
- —
- DSCR
- —
- Eligible?
- —
No personal income docs; deal must DSCR.
Hard money
10% down · 12.0% · 12mo
- Down + closing
- —
- Monthly P&I
- —
- Monthly cashflow
- —
- DSCR
- —
- Eligible?
- —
Short-term bridge; refi at stabilization.
Rent comps 5 comps
| Address | Beds | Baths | Sqft | Rent | $/sqft | DOM | Units | Dist |
|---|---|---|---|---|---|---|---|---|
| 9A Juniper Ln Unit 50 Whiting, NJ | 1.0 | 1.0 | 1009 | $1,950 | $1.93 | 43d | 1 | 0.64mi |
| 19B Maplewood Dr #52 Whiting, NJ | 2.0 | 1.5 | 1109 | $2,250 | $2.03 | 16d | 1 | 0.64mi |
| 49 Westport Dr #71 Whiting, NJ | 2.0 | 1.5 | 1192 | $1,995 | $1.67 | 43d | 1 | 0.81mi |
| 50 Westport Dr #71 Whiting, NJ | 2.0 | 1.0 | 1120 | $2,200 | $1.96 | 1d | 1 | 0.81mi |
| 57D Milford Ave Unit 53 Whiting, NJ | 2.0 | 1.0 | 880 | $1,800 | $2.05 | 24d | 1 | 0.85mi |
HOA detail
- Monthly dues
- $385 · $4,620/yr
- Likely covers
- landscaping
Listing history 9 events
-
2026-06-18days on market $107,000 Active 13 DOM
-
2026-06-17days on market $107,000 Active 12 DOM
-
2026-06-16days on market $107,000 Active 11 DOM
-
2026-06-15days on market $107,000 Active 10 DOM
-
2026-06-13days on market $107,000 Active 8 DOM
-
2026-06-09days on market $107,000 Active 4 DOM
-
2026-06-08days on market $107,000 Active 3 DOM
-
2026-06-07remarks 528-char remark
-
2026-06-07$107,000 Active 2 DOM
ⓘ Source: listings_history table (triggers on properties + properties_extension) + one-shot
backfill from property_details.listing_events for pre-trigger history.
Climate risk First Street
- Flood 1/10 Low FEMA zone X (unshaded) · 0% chance over 30 yrs
- Wildfire 5/10 Major
- Heat 6/10 Major 7 d/yr ≥103°F today · 14 d/yr by 30 yrs out
- Wind 6/10 Major 65% chance of damaging wind over 30 yrs
- Air quality 4/10 Moderate 4 unhealthy d/yr today · 5 by 30 yrs out
Nearby sold comps map
Loading sold comps map…
Walkable amenities ~0.75 mi
Loading nearby amenities…
Taxation est. · year 1
- Rental income
- $24,694
- − Mortgage interest
- −$5,994
- − Property taxes
- −$1,605
- − Insurance
- −$535
- − Repairs & maintenance
- −$1,976
- − Management
- −$1,976
- − HOA
- −$4,620
- − Depreciation
- −$3,113
- Taxable income
- $4,877
- Est. tax owed @ 24.0%
- −$1,170
- After-tax cash flow
- $4,845/yr
For passive investors: Depreciation is non-cash, so a rental often shows a tax loss while cash-flowing — sheltering income. Rental losses are passive: they offset passive income freely, and up to $25,000/yr can offset ordinary (W-2) income if you actively participate and your MAGI is under $100k (phasing out to $0 by $150k); unused losses carry forward. On sale, claimed depreciation is recaptured at up to 25%, and gains may owe capital-gains tax (a 1031 exchange can defer both). Figures are a year-1 estimate at your 24.0% rate — not tax advice; consult a CPA.
Condition & rehab AI · 13 photos
This home requires moderate renovations to modernize the kitchen and living areas, improve the exterior, and address some wear and tear. The property has good potential for increased value with these updates.
Repairs flagged
- Major kitchen cabinets — severely dated and worn
- Major kitchen appliances — outdated and worn
- Minor bathroom fixtures — basic and slightly worn
- Moderate exterior siding — moderate wear
Value-add opportunities
- Resale new kitchen cabinets and appliances — modernizing the kitchen would significantly increase appeal
- Resale new flooring — new carpet would improve the living areas
- Both exterior landscaping — enhanced curb appeal would attract both buyers and renters
Renovation cost estimate screening
| Repair item | Severity | Est. cost |
|---|---|---|
| kitchen cabinets · severely dated and worn | Major | $15,000–50,000 |
| kitchen appliances · outdated and worn | Major | $15,000–50,000 |
| bathroom fixtures · basic and slightly worn | Minor | $500–3,000 |
| exterior siding · moderate wear | Moderate | $3,000–15,000 |
| Total estimated repair cost · 4 items | $33,500–118,000 |
Value-add ROI direction
- Resale new kitchen cabinets and appliances — modernizing the kitchen would significantly increase appeal ↑
- Resale new flooring — new carpet would improve the living areas ↑
- Both exterior landscaping — enhanced curb appeal would attract both buyers and renters ↑
ⓘ Cost ranges are severity-bucket heuristics (US national rule-of-thumb). Get contractor quotes + a written scope before underwriting a rehab budget.
Schools (NCES district)
- District
- Manchester Township School District
- NCES district ID
- 3409450
- Math proficiency
- 25% ▼ -17.00%
- Reading proficiency
- 44% ▼ -5.00%
- Median HH income
- $38,905
- Composite
- 28.8/100
- National rank
- #6662
- State rank
- #320 of 472 in NJ
Livability — Crestwood Village
- Score
- 63/100
- State rank
- #422
- US rank
- #15006
Category grades
Schools grade is shown separately in the Schools card above.
Census & demographics
- Census place
- Crestwood Village, NJ
- City population
- 34,290
- Population (ZIP)
- 34,290
Population outlook (Ocean County) Hauer SSP2
- Today (2025)
- 586,991 people
- By 2030
- 581,403 · -1.0%
- By 2040
- 564,913 · -3.8%
- By 2050
- 538,149 · -8.3%
- By 2075
- 468,845 · -20.1%
- By 2100
- 350,297 · -40.3%
Race, ethnicity, and origin ACS 2023
- Neighborhood character
- Predominantly White (87%)
- Race & ethnicity
- White 87% Hispanic / Latino 5% Black 4% Two or more races 4% Asian 2%
- Hispanic origin (detail)
- Puerto Rican 2%
- Common ancestry
- Romanian 8% Scotch-Irish 2% Lithuanian 2%
- Foreign-born
- 11% · Canada, China
- Languages at home
- 88% English-only · Spanish 3% Russian/Polish/Slavic 2% Other Indo-European 2%
Political lean MEDSL · Ocean
- 2024 margin
- Solid R (+36.0) · D 31.4% · R 67.4% · Other 1.2%
- 2008→2024 swing
- -17.6pp toward R · 2008: -18.4pp · 2024: -36.0pp
- All cycles
- 2024: R+36.0 2020: R+28.7 2016: R+34.0 2012: R+17.7 2008: R+18.4
Not yet ingested
- Civics
- —
Market trends
- HPI YoY
- ▼ -347.85%
- Current HPI
- 274.4679
- Rent YoY
- —
- Metro
- —
- State GDP YoY
- ▲ 2.05%
- F500 in state
- 34
Industry mix (Fortune 500 HQ in NJ)
| Industry | F500 HQs | Revenue |
|---|---|---|
| Consumer Goods | 3 | $31B |
|
||
| Pharmaceuticals | 2 | $153B |
|
||
| Technology | 2 | $21B |
|
||
| Insurance | 2 | $20B |
|
||
| Healthcare | 2 | $19B |
|
||
| Financial Services | 1 | $70B |
|
||
Price history
1 event — show timeline
- 2026-06-05 Listed $107,000 MOMLS
Cash-flow waterfall
monthlySold comps — $/sqft
last 12 mo · ≤1 miLoading sold comps…