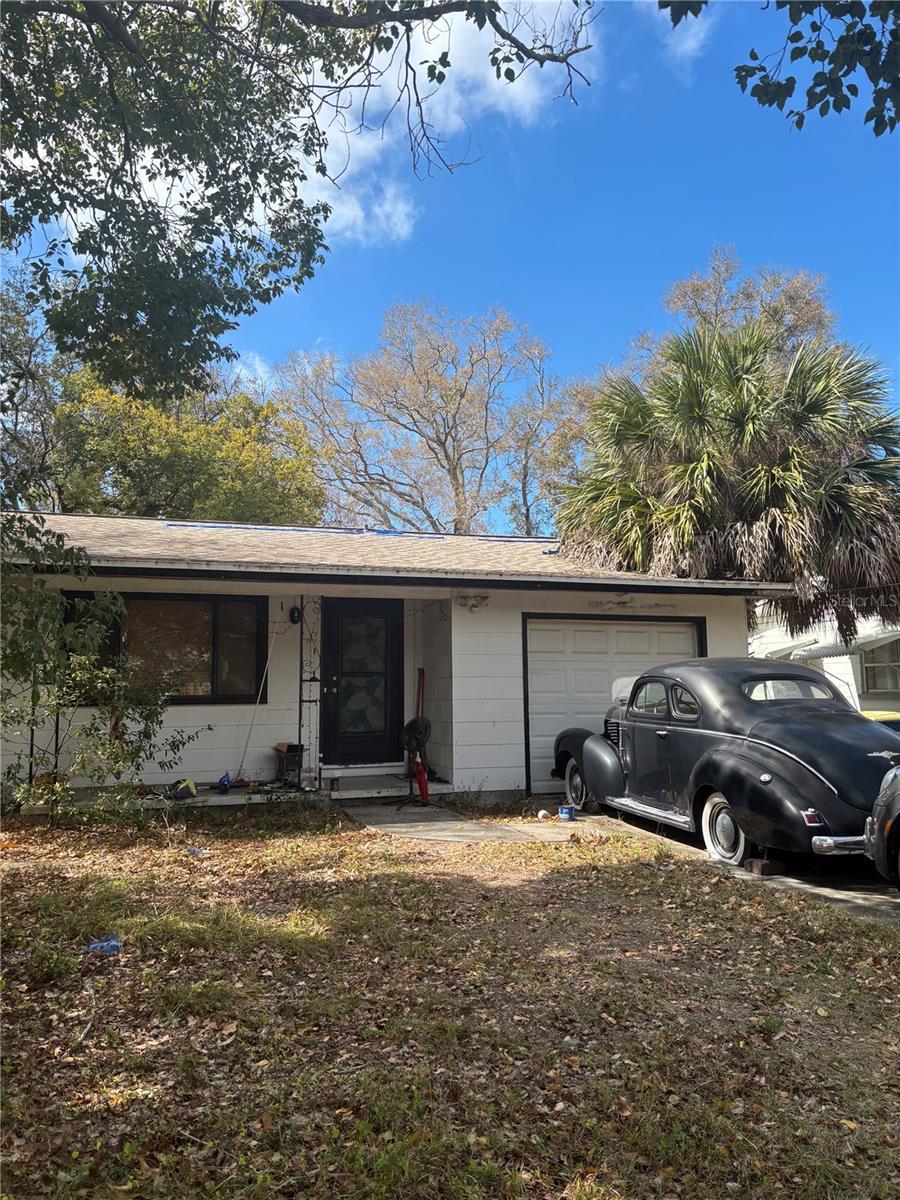
542 Plumosa Ave · Clearwater, FL
Flood risk 1/10 · Minimal
- FEMA flood zone
- X (unshaded)
- Chance of flooding over 30 yrs
- 0.0%
- Est. flood insurance / yr
- $507 – $1,088
Fire risk 1/10 · Minimal
- Est. fire insurance / yr
- $947 – $1,759
Heat risk 10/10 · Severe
- Hot days now (above 107°F)
- 7 days/yr
- Hot days in 30 yrs
- 26 days/yr
Wind risk 10/10 · Severe
- Chance of severe wind over 30 yrs
- 99.0%
Air-quality risk 3/10 · Minor
- Unhealthy air days now
- 2 days/yr
- Unhealthy air days in 30 yrs
- 3 days/yr
Risk factors via First Street. Map © Google.
Why this score? — see what drove the D+ grade
The composite is a weighted blend of 9 inputs, each scored 0–100. Each bar is that input's sub-score; the figure is the points it added to the 100-point composite (weight × sub-score).
- ARV discount +15.0/15.0
- Cash flow +13.2/30.0
- Schools +4.3/10.0
- Livability +4.1/5.0
- DSCR +4.0/10.0
- 1% rule +2.9/10.0
- Condition / age +2.5/5.0
- Rent growth +1.9/5.0
- Appreciation +0.0/10.0
$225,000
🖨 Deal sheet 📄 Offer letter ✓ Due diligence
Listing remarks
INVESTOR OPPORTUNITY – ideal for teardown or major rehab. Prime location approx. 10 minutes to Clearwater Beach. Estimated ~$317/sq ft with ARV around $399K (buyer to verify). Property is occupied by a month-to-month tenant; buyer will assume tenancy. Sold for land value and redevelopment potential. Cash or hard money only. No repairs or credits.
Key facts
- Prime location
- 7,336 sq ft lot
- Garage
Tags
Neighborhood map
What this means for you Summary
Snapshot
- This is a 2-bed/1.0-bath single-family listed at $225k.
Deal economics
- At list price, monthly cash flow is $-6 ($-68/yr) — negative.
- To cash-flow at today's rent, offer at most $224k (0.4% below list).
- To meet the 1% rule (rent ≥ 1% of price), the offer needs to be $177k (21.2% below list).
- Recommended offer: $177k (21.2% below list) — sets the bar for 1% rule.
- Cap rate 6.3% vs local median 2.9% in Clearwater — top-decile yield for the area; either an underpriced asset or a hidden risk that comps aren't pricing in. Stress-test before assuming the spread holds.
Location & tenants
- Location reads 82/100 on livability (#60 in FL, #988 nationally) — a professional / high-income tenant draw. Strengths: commute A+, housing A+, health & safety A+; Watch: schools C-, employment C-.
- Pinellas (suburban): math 51% / reading 51% proficiency, ranked #31 of 73 in FL (top 42%) — acceptable for families but not a draw, mixed tenant base, ~2y average lease.
- Market conditions: Rents soft (-2.2%/yr); 355 active listings in the ZIP; 40 comparable units currently listed for rent nearby; rentals at typical pace (median 18d on market — plan ~3-4 weeks tenant-placement turnaround); 2,676 units permitted in Pinellas County in 2024 (1,422 in 5+ unit buildings).
- This rent runs 34% of the median local income ($62k/yr) — at the standard rent-burdened threshold; future hikes will face affordability resistance.
Forward outlook
- Local home prices are declining (-3.0%/yr); year-one equity from $2k of loan paydown is wiped out by about $7k of value loss. Plan a longer hold.
- Pinellas County population projected at +14% by 2050 — modest demand growth; plan on rents tracking national, not racing it.
Negotiation context
- It's been on market 19 days — a 2% lower offer ($222k) is reasonable based on typical stale-listing flexibility.
- Current owner paid $83k; list at $225k implies a 171% gain — meaningful room to come down on a strong offer.
Risks & watch-outs
- Watch-outs: built in 1954 — expect roof / HVAC / electrical / plumbing capex.
- Climate carrying-cost: severe wind risk, 99% chance of damaging wind over 30y; extreme-heat days projected 7→26/yr by 2055 (HVAC capex compounding) — expect insurance premiums to compound above CPI over the hold.
Questions for the listing agent
- What do current leases actually rent for vs. the listed asking? Can we see a recent rent roll and the last 12 months of T-12 income?
- Built in 1954 — when were the roof, HVAC, electrical panel, plumbing, and water heater last replaced?
- Is there a deadline driving the sale (1031 exchange, divorce, estate, relocation)? That informs how much negotiation room exists.
- The area grade is low — what's the realistic commute time and amenity access for the typical tenant pool here? Any planned neighborhood developments (good or bad) we should know about?
- What's the average days-on-market for RENTAL listings here right now (not sales)? A rising rental-DOM trend means longer vacancies and softer asking-rent achievability than the comps imply.
- What's the recent tenant-quality profile in this submarket — average credit score on applications, eviction rate, late-payment / NSF rate, and stable-employment percentage? A property-management company in the area should have these aggregated.
- How much new for-sale + rental construction is in the pipeline within 1–3 miles? Heavy new supply typically softens prices + rents 12–24 months out; constrained supply supports both.
Investment metrics
- 1% rule
- 0.79% ✗
- Cap rate
- 6.26%
- Cash-on-cash
- -0.11%
- DSCR
- 1.00
- GRM
- 10.6
CMA / ARV
- ARV (on-the-fly)
- $275,706
- Comps found
- 8
Show comp detail 8 sales within ~0.75 mi
| Address | Dist | Beds/Ba | Sqft | Sold | Price | $/sf | Match |
|---|---|---|---|---|---|---|---|
| 1609 Turner St | 0.30mi | 2/1.0 | 899 (+4%) | 6mo | $276,000 | $307 | 75 |
| 711 S Highland Ave | 0.58mi | 2/1.0 | 864 (-0%) | 11mo | $155,000 | $179 | 63 |
| 618 Brookside Dr | 0.34mi | 2/1.5 | 912 (+5%) | 17mo | $290,000 | $318 | 59 |
| 1541 Illinois Rd | 0.69mi | 2/1.0 | 910 (+5%) | 2mo | $275,000 | $302 | 58 |
| 1527 Laura St | 0.70mi | 2/1.0 | 874 (+1%) | 23mo | $315,000 | $360 | 47 |
| 1574 Lotus Path | 0.48mi | 2/2.0 | 912 (+5%) | 22mo | $369,900 | $406 | 46 |
| 1466 Pine St | 0.64mi | 2/1.0 | 780 (-10%) | 17mo | $210,600 | $270 | 40 |
| 1433 Pine St | 0.74mi | 2/1.0 | 972 (+12%) | 16mo | $322,500 | $332 | 32 |
Match score weights: distance 35% · size 25% · config 20% · recency 20%. Top-matched comps best support the ARV.
Projected returns pro-forma
-3.0% appreciation · 0.0% rent growth · sell at horizon
- IRR
- -19.6%
- Equity multiple
- 0.33×
- Total profit
- $-42,077
- Equity at exit
- $33,548
- IRR
- -19.6%
- Equity multiple
- 0.09×
- Total profit
- $-57,435
- Equity at exit
- $19,454
Cash invested: $63,000 (down + closing). Projections, not guarantees.
Landlord ↔ Tenant lean methodology
- Overall (STATE)
- 87 Strongly Landlord-Friendly
- State Florida
- 87 Strongly Landlord-Friendly · R+3
- County
- — inherits STATE
- City
- — inherits STATE
ZIP-level market 33756
- Rents YoY
- -2.2%
- Active inventory
- 355
- Price-to-rent
- 10.6×
Monthly cashflow live
- Estimated rent
- $1,772 high interval (Pro) →
- Mortgage (P&I)
- −$1,180
- Tax from tax record
- −$132 /mo · $1,582/yr
- Insurance
- −$94
- HOA
- −$0
- Vacancy / Maint / Mgmt
- −$372
- Net cashflow
- $-6
Break-even live
UW: 25.0% down · 7.5% · 30yr · 1.5% tax · 5.0% vac · 8.0% maint · 8.0% mgmt
Financing live
Cash to close
- Down payment
- $56,250
- Closing costs
- $6,750
- Reserves months
- —
- Total cash needed
- —
Loan-product check · same deal, 3 products live
Conventional
25% down · 7.5% · 30yr
- Down + closing
- —
- Monthly P&I
- —
- Monthly cashflow
- —
- DSCR
- —
- Eligible?
- —
Personal DTI + credit; lowest rate.
DSCR
20% down · 8.5% · 30yr
- Down + closing
- —
- Monthly P&I
- —
- Monthly cashflow
- —
- DSCR
- —
- Eligible?
- —
No personal income docs; deal must DSCR.
Hard money
10% down · 12.0% · 12mo
- Down + closing
- —
- Monthly P&I
- —
- Monthly cashflow
- —
- DSCR
- —
- Eligible?
- —
Short-term bridge; refi at stabilization.
Rent comps 40 comps
| Address | Beds | Baths | Sqft | Rent | $/sqft | DOM | Units | Dist |
|---|---|---|---|---|---|---|---|---|
| 1719 Turner St Clearwater, FL | 2.0 | 2.0 | 900 | $2,200 | $2.44 | 20d | 1 | 0.03mi |
| 518 Florida Ave Clearwater, FL | 3.0 | 1.0 | 990 | $1,795 | $1.81 | 4d | 1 | 0.15mi |
| 533 Yelvington Ave Clearwater, FL | 1.0 | 1.0 | 812 | $1,550 | $1.91 | 24d | 1 | 0.23mi |
| 618 S Crest Ave Clearwater, FL | 3.0 | 1.0 | 997 | $2,500 | $2.51 | 4d | 1 | 0.39mi |
| 1903 Rainbow Dr Unit 10 Clearwater, FL | 2.0 | 1.0 | 850 | $1,500 | $1.76 | 24d | 1 | 0.46mi |
| 310 S Arcturas Ave Unit 3 Clearwater, FL | 2.0 | 1.0 | 840 | $1,599 | $1.90 | 24d | 1 | 0.48mi |
| 311 S Arcturas Ave Unit 3 Clearwater, FL | 1.0 | 1.0 | 775 | $1,200 | $1.55 | 10d | 1 | 0.52mi |
| 309 S Arcturas Ave #6 Clearwater, FL | 1.0 | 1.0 | 650 | $1,200 | $1.85 | 2d | 1 | 0.52mi |
| 1520 Jeffords St Clearwater, FL | 1.0–2.0 | 1.0 | 645 | $1,500 | $2.33 | 24d | 1 | 0.59mi |
| 1477 Pierce St Clearwater, FL | 2.0 | 1.0 | 650 | $1,575 | $2.42 | 24d | 1 | 0.71mi |
| 313 N Jupiter Ave Clearwater, FL | 2.0 | 1.0 | 700 | $1,495 | $2.14 | 7d | 1 | 0.73mi |
| 1485 Cleveland St Clearwater, FL | 3.0 | 1.0 | 978 | $2,200 | $2.25 | 4d | 1 | 0.75mi |
| 1524 Lakeview Rd Clearwater, FL | 2.0 | 2.0 | 1100 | $1,395 | $1.27 | 24d | 1 | 0.76mi |
| 1482 Cleveland St Clearwater, FL | 3.0 | 2.0 | 1110 | $2,750 | $2.48 | 4d | 1 | 0.77mi |
| 1416 Druid Rd E Clearwater, FL | 2.0 | 1.0 | 864 | $2,150 | $2.49 | 3d | 1 | 0.77mi |
| 2025 Rogers St Clearwater, FL | 1.0–3.0 | 1.0–2.0 | 985 | $1,874 | $1.90 | 10d | 10 | 0.81mi |
| 1458 Cleveland St Clearwater, FL | 1.0 | 1.0 | 750 | $1,300 | $1.73 | 4d | 1 | 0.81mi |
| 1458 Cleveland St Clearwater, FL | 1.0 | 1.0 | 750 | $1,300 | $1.73 | 2d | 1 | 0.81mi |
| 1432 Lotus Path Clearwater, FL | 2.0 | 1.0 | 900 | $1,750 | $1.94 | 10d | 1 | 0.82mi |
| 411 S Nimbus Ave Unit 3 Clearwater, FL | 1.0 | 1.0 | 700 | $1,395 | $1.99 | 17d | 1 | 0.85mi |
| 509 N Saturn Ave Clearwater, FL | 2.0 | 1.0 | 800 | $1,850 | $2.31 | 19d | 1 | 0.85mi |
| 27 N San Remo Ave Unit A Clearwater, FL | 2.0 | 1.0 | 625 | $1,297 | $2.08 | 2d | 1 | 0.87mi |
| 1458 Grove St Clearwater, FL | 1.0 | 1.0 | 625 | $1,295 | $2.07 | 21d | 1 | 0.88mi |
| 1009 Chester Dr Clearwater, FL | 3.0 | 2.0 | 1105 | $2,500 | $2.26 | 11d | 1 | 0.94mi |
| 625 N Keene Rd Unit A Clearwater, FL | 2.0 | 1.0 | 920 | $1,650 | $1.79 | 24d | 1 | 0.94mi |
| 631 N Keene Rd Unit S8 Clearwater, FL | 1.0 | 1.0 | 710 | $1,650 | $2.32 | 24d | 1 | 0.95mi |
| 308 Gunn Ave Unit 308 Clearwater, FL | 1.0 | 1.0 | 650 | $1,400 | $2.15 | 17d | 1 | 0.97mi |
| 300 Gunn Ave Unit 9 Clearwater, FL | 1.0 | 1.0 | 525 | $1,130 | $2.15 | 24d | 1 | 0.97mi |
| 300 Gunn Ave Unit 7 Clearwater, FL | 1.0 | 1.0 | 525 | $1,150 | $2.19 | 10d | 1 | 0.97mi |
| 117 N Evergreen Ave Clearwater, FL | 1.0 | 1.0 | 808 | $1,135 | $1.40 | 24d | 2 | 1.05mi |
| 117 N Evergreen Ave Clearwater, FL | 1.0 | 1.0 | 800 | $1,275 | $1.59 | 12d | 1 | 1.05mi |
| 1365 Drew St #102 Clearwater, FL | 2.0 | 1.0 | 850 | $1,400 | $1.65 | 24d | 1 | 1.07mi |
| 600 S Betty Ln Apt 7 Clearwater, FL | 1.0 | 1.0 | 680 | $1,225 | $1.80 | 24d | 1 | 1.10mi |
| 2168 Druid Rd E Clearwater, FL | 1.0–3.0 | 1.0–2.0 | 1049 | $2,532 | $2.41 | 3d | 20 | 1.10mi |
| 1345 Drew St #16 Clearwater, FL | 2.0 | 1.0 | 925 | $1,500 | $1.62 | 24d | 1 | 1.11mi |
| 106 S Fredrica Ave Clearwater, FL | 2.0 | 1.0 | 836 | $1,350 | $1.61 | 21d | 1 | 1.11mi |
| 1329 Drew St #6 Clearwater, FL | 2.0 | 1.0 | 850 | $1,495 | $1.76 | 4d | 1 | 1.14mi |
| 612 Sally Ln S Unit 14 Clearwater, FL | 1.0 | 1.0 | 750 | $1,500 | $2.00 | 24d | 1 | 1.15mi |
| 601 N Hercules Ave #508 Clearwater, FL | 2.0 | 2.0 | 945 | $1,650 | $1.75 | 24d | 1 | 1.15mi |
| 100 Waverly Way #403 Clearwater, FL | 2.0 | 2.0 | 900 | $1,600 | $1.78 | 17d | 1 | 1.16mi |
Listing history 5 events
-
2026-06-01days on market $225,000 Active 19 DOM
-
2026-05-31days on market $225,000 Active 18 DOM
-
2026-04-03status Pending
-
2026-03-19$225,000 Active
-
2003-11-03soldstatus $82,900
ⓘ Source: listings_history table (triggers on properties + properties_extension) + one-shot
backfill from property_details.listing_events for pre-trigger history.
Tax reassessment forecast FL · Resets to sale price
- Current annual tax
- $1,582 · $132/mo
- Projected year-2 tax
- $1,868 · $156/mo
- Expected delta
- +$286/yr (+$24/mo · 18.1%)
ⓘ Screening estimate from a state-policy table — verify with the county assessor before closing.
Climate risk First Street
- Flood 1/10 Low FEMA zone X (unshaded) · 0% chance over 30 yrs
- Wildfire 1/10 Low
- Heat 10/10 Extreme 7 d/yr ≥107°F today · 26 d/yr by 30 yrs out
- Wind 10/10 Extreme 99% chance of damaging wind over 30 yrs
- Air quality 3/10 Moderate 2 unhealthy d/yr today · 3 by 30 yrs out
Nearby sold comps map
Loading sold comps map…
Walkable amenities ~0.75 mi
Loading nearby amenities…
Taxation est. · year 1
- Rental income
- $21,263
- − Mortgage interest
- −$12,603
- − Property taxes
- −$1,582
- − Insurance
- −$1,125
- − Repairs & maintenance
- −$1,701
- − Management
- −$1,701
- − Depreciation
- −$6,545
- Taxable loss
- −$3,994
- Est. tax savings @ 24.0%
- +$959
- After-tax cash flow
- $891/yr
For passive investors: Depreciation is non-cash, so a rental often shows a tax loss while cash-flowing — sheltering income. Rental losses are passive: they offset passive income freely, and up to $25,000/yr can offset ordinary (W-2) income if you actively participate and your MAGI is under $100k (phasing out to $0 by $150k); unused losses carry forward. On sale, claimed depreciation is recaptured at up to 25%, and gains may owe capital-gains tax (a 1031 exchange can defer both). Figures are a year-1 estimate at your 24.0% rate — not tax advice; consult a CPA.
Schools (NCES district)
- District
- Pinellas
- NCES district ID
- 1201560
- Math proficiency
- 51% ▼ -5.00%
- Reading proficiency
- 51% ▼ -3.00%
- Median HH income
- $46,270
- Composite
- 43.27/100
- National rank
- #3046
- State rank
- #31 of 73 in FL
Livability — Clearwater
- Score
- 82/100
- State rank
- #60
- US rank
- #988
Category grades
Schools grade is shown separately in the Schools card above.
Census & demographics
- Census place
- Clearwater, FL
- County
- Pinellas County · 939,478 people
- City population
- 170,933
- Metro
- Tampa-St. Petersburg-Clearwater, FL
- Population (ZIP)
- 32,201
- Household income
- $61,872
- Rent vs Own
- Severe rent burden
- 1868.0
Population outlook (Pinellas County) Hauer SSP2
- Today (2025)
- 1,027,532 people
- By 2030
- 1,063,586 · +3.5%
- By 2040
- 1,125,020 · +9.5%
- By 2050
- 1,168,637 · +13.7%
- By 2075
- 1,265,188 · +23.1%
- By 2100
- 1,260,357 · +22.7%
Race, ethnicity, and origin ACS 2023
- Neighborhood character
- Majority White (64%)
- Race & ethnicity
- White 64% Hispanic / Latino 18% Black 11% Two or more races 9% Asian 3%
- Hispanic origin (detail)
- Mexican 8% Puerto Rican 5%
- Common ancestry
- Romanian 3% Lithuanian 2% Slovak 2%
- Foreign-born
- 16% · Canada
- Languages at home
- 79% English-only · Spanish 14% Other Indo-European 2% Russian/Polish/Slavic 2%
Political lean MEDSL · Pinellas
- 2024 margin
- Lean R (+5.2) · D 46.9% · R 52.1%
- 2008→2024 swing
- -13.5pp toward R · 2008: 8.3pp · 2024: -5.2pp
- All cycles
- 2024: R+5.2 2020: D+0.2 2016: R+1.1 2012: D+5.6 2008: D+8.3
Not yet ingested
- Civics
- —
Market trends
- HPI YoY
- ▼ -438.74%
- Current HPI
- 354.6792
- Rent YoY
- ▼ -2.22%
- Metro
- Tampa-St. Petersburg-Clearwater, FL
- State GDP YoY
- ▲ 3.28%
- F500 in state
- 36
Industry mix (Fortune 500 HQ in FL)
| Industry | F500 HQs | Revenue |
|---|---|---|
| Industrial Technology | 2 | $29B |
|
||
| Insurance | 2 | $17B |
|
||
| Retail | 1 | $60B |
|
||
| Technology Distribution | 1 | $58B |
|
||
| Homebuilding | 1 | $35B |
|
||
| Technology Manufacturing | 1 | $35B |
|
||
Price history
+171.4% since first listed3 events — show timeline
- 2026-04-03 Pending — Stellar MLS as Distributed by MLS Grid
- 2026-03-19 Listed $225,000 Stellar MLS as Distributed by MLS Grid
- 2003-11-03 Sold (Public Records) $82,900 Public Records
Property tax history
+4.5%/yrLatest (2025): $1,582 · +6.6% YoY. Source: county tax records.
Cash-flow waterfall
monthlySold comps — $/sqft
last 12 mo · ≤1 miLoading sold comps…