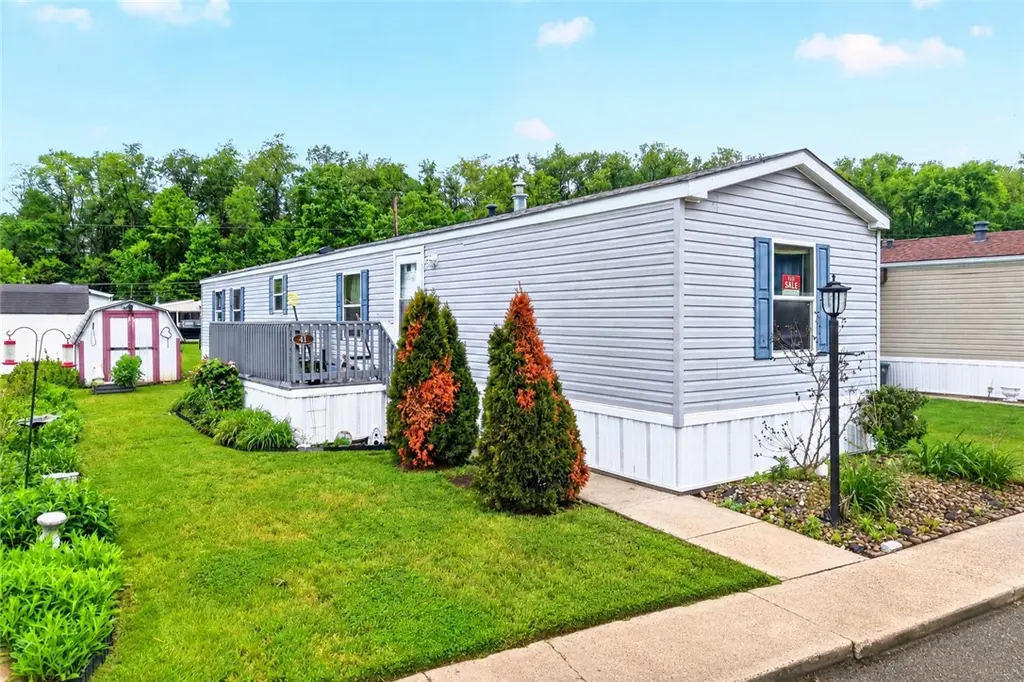
41 Hidden Valley Dr · Union, PA
Flood risk 4/10 · Minor
- FEMA flood zone
- X (unshaded)
- Chance of flooding over 30 yrs
- 0.22%
- Est. flood insurance / yr
- $507 – $1,088
Fire risk 1/10 · Minimal
- Est. fire insurance / yr
- $511 – $949
Heat risk 3/10 · Minor
- Hot days now (above 97°F)
- 7 days/yr
- Hot days in 30 yrs
- 18 days/yr
Wind risk 2/10 · Minimal
- Chance of severe wind over 30 yrs
- —
Air-quality risk 3/10 · Minor
- Unhealthy air days now
- 2 days/yr
- Unhealthy air days in 30 yrs
- 4 days/yr
Risk factors via First Street. Map © Google.
Why this score? — see what drove the D+ grade
The composite is a weighted blend of 9 inputs, each scored 0–100. Each bar is that input's sub-score; the figure is the points it added to the 100-point composite (weight × sub-score).
- Cash flow +15.0/30.0
- ARV discount +15.0/15.0
- 1% rule +5.0/10.0
- DSCR +5.0/10.0
- Rent growth +2.5/5.0
- Livability +2.5/5.0
- Condition / age +2.5/5.0
- Schools +2.4/10.0
- Appreciation +0.0/10.0
$30,000
🖨 Deal sheet 📄 Offer letter ✓ Due diligence
Listing remarks
Welcome home to 41 Hidden Valley Drive in Finleyville where you're just minutes away from so much. .. Trax Farm, South Park, and Rt 43 just to name a few!! And if that's not enough, the bus route stops at the entrance of the plan to get you everywhere you need to go!! Outside you'll love the table-flat yard, shed and side deck. Step inside to find a wide open floor plan with vaulted ceilings throughout. In the center of the home you have a large living room that is open to the dining area and kitchen. The kitchen features tons of counter and cabinet space and a peninsula which will be great when entertaining. Past the kitchen you have the laundry room and the primary bedroom. The primary be
Key facts
- Open floor plan
- Side deck
- Large living room
Tags
Property features AI
Finance
- HOA & community: Monthly association fee of $590; Community has public transportation access
Exterior
- Parking: On-street parking
- Utilities: Public water; Public sewer
- Home design: Single-story; Resale property
- Construction: Vinyl siding; Composition roof
- Exterior features: Public transportation access
Interior
- Kitchen: Dishwasher; Microwave; Stove; Some gas appliances
- Flooring: Laminate floors; Carpeted areas
- Bathrooms: 2 full bathrooms
- Heating & cooling: Forced air heating; Gas heating
- Interior features: Multi-pane windows
Neighborhood map
What this means for you Summary
Snapshot
- This is a 2-bed/2.0-bath manufactured listed at $30k.
Deal economics
- At list price, monthly cash flow is $479 ($6k/yr) — positive.
- The deal already cash-flows at list — no discount required.
- Meets the 1% rule at list price ($2k rent vs $30k).
- Recommended offer: $30k (1.5% below list) — sets the bar for market timing.
Location & tenants
- Location reads: area grade D — affects rentability + tenant quality, not the cash-flow math above.
- Ringgold SD (suburban): math 19% / reading 36% proficiency, ranked #452 of 539 in PA (top 84%) — low school quality limits family demand, transient renter base, plan for 1-2y turnover.
- Market conditions: 54 active listings in the ZIP; 5 comparable units currently listed for rent nearby; rentals leasing fast (median 2d on market — plan ~1-2 weeks tenant-placement turnaround); 489 units permitted in Washington County in 2024 (30 in 5+ unit buildings).
Forward outlook
- Local home prices are declining (-3.0%/yr); year-one equity from $207 of loan paydown is wiped out by about $900 of value loss. Plan a longer hold.
- Washington County population projected to shrink 6% by 2050 — rents likely to lag national; underwrite the cash flow, not the appreciation.
- At projected returns (-3.0% appreciation + 3.0% rent growth), your $8k cash investment doubles in ~2 years — after that, you're playing with house money.
Negotiation context
- It's been on market 22 days — a 2% lower offer ($30k) is reasonable based on typical stale-listing flexibility.
Risks & watch-outs
- Watch-outs: HOA is 37% of rent.
Questions for the listing agent
- What does the HOA fee cover, when was the last increase, and are there any pending special assessments or reserve-fund shortfalls?
- Is there a deadline driving the sale (1031 exchange, divorce, estate, relocation)? That informs how much negotiation room exists.
- The area grade is low — what's the realistic commute time and amenity access for the typical tenant pool here? Any planned neighborhood developments (good or bad) we should know about?
- What's the average days-on-market for RENTAL listings here right now (not sales)? A rising rental-DOM trend means longer vacancies and softer asking-rent achievability than the comps imply.
- What's the recent tenant-quality profile in this submarket — average credit score on applications, eviction rate, late-payment / NSF rate, and stable-employment percentage? A property-management company in the area should have these aggregated.
- How much new for-sale + rental construction is in the pipeline within 1–3 miles? Heavy new supply typically softens prices + rents 12–24 months out; constrained supply supports both.
Investment metrics
- 1% rule
- 5.36% ✓
- Cap rate
- 25.47%
- Cash-on-cash
- 68.48%
- DSCR
- 4.05
- GRM
- 1.6
CMA / ARV
- ARV (on-the-fly)
- $44,352
- Comps found
- 5
Show comp detail 5 sales within ~0.75 mi
| Address | Dist | Beds/Ba | Sqft | Sold | Price | $/sf | Match |
|---|---|---|---|---|---|---|---|
| 36 Hidden Valley Dr | 0.04mi | 3/2.0 (+1) | 1,008 (0%) | 19mo | $39,000 | $39 | 78 |
| 90 Hidden Valley Dr | 0.12mi | 3/2.0 (+1) | 1,056 (+5%) | 5mo | $60,000 | $57 | 77 |
| 28 Parkvue Dr | 0.12mi | 3/2.0 (+1) | 960 (-5%) | 12mo | $42,000 | $44 | 71 |
| 10 Roundtop Dr | 0.21mi | 2/2.0 | 1,095 (+9%) | 9mo | $121,000 | $111 | 68 |
| 42 Hilltop Dr | 0.23mi | 2/2.0 | 938 (-7%) | 17mo | $33,000 | $35 | 63 |
Match score weights: distance 35% · size 25% · config 20% · recency 20%. Top-matched comps best support the ARV.
Projected returns pro-forma
-3.0% appreciation · 3.0% rent growth · sell at horizon
- IRR
- 68.4%
- Equity multiple
- 4.10×
- Total profit
- $26,052
- Equity at exit
- $4,473
- IRR
- 72.6%
- Equity multiple
- 8.57×
- Total profit
- $63,553
- Equity at exit
- $2,594
Cash invested: $8,400 (down + closing). Projections, not guarantees.
Landlord ↔ Tenant lean methodology
- Overall (STATE)
- 62 Landlord-Friendly
- State Pennsylvania
- 62 Landlord-Friendly · EVEN
- County
- — inherits STATE
- City
- — inherits STATE
ZIP-level market 15332
- Home prices YoY
- -10.7%
- Active inventory
- 54
- Price-to-rent
- 1.6×
Monthly cashflow live
- Estimated rent
- $1,607 high interval (Pro) →
- Mortgage (P&I)
- −$157
- Tax from tax record
- −$30 /mo · $363/yr
- Insurance
- −$12
- HOA
- −$590
- Vacancy / Maint / Mgmt
- −$337
- Net cashflow
- $479
Break-even live
UW: 25.0% down · 7.5% · 30yr · 1.5% tax · 5.0% vac · 8.0% maint · 8.0% mgmt
Financing live
Cash to close
- Down payment
- $7,500
- Closing costs
- $900
- Reserves months
- —
- Total cash needed
- —
Loan-product check · same deal, 3 products live
Conventional
25% down · 7.5% · 30yr
- Down + closing
- —
- Monthly P&I
- —
- Monthly cashflow
- —
- DSCR
- —
- Eligible?
- —
Personal DTI + credit; lowest rate.
DSCR
20% down · 8.5% · 30yr
- Down + closing
- —
- Monthly P&I
- —
- Monthly cashflow
- —
- DSCR
- —
- Eligible?
- —
No personal income docs; deal must DSCR.
Hard money
10% down · 12.0% · 12mo
- Down + closing
- —
- Monthly P&I
- —
- Monthly cashflow
- —
- DSCR
- —
- Eligible?
- —
Short-term bridge; refi at stabilization.
Rent comps 5 comps
| Address | Beds | Baths | Sqft | Rent | $/sqft | DOM | Units | Dist |
|---|---|---|---|---|---|---|---|---|
| 6129 State Route 88 Finleyville, PA | 2.0 | 2.0 | 1277 | $1,475 | $1.16 | 1d | 1 | 0.27mi |
| 201 Woods Edge Finleyville, PA | 3.0 | 1.5 | 1500 | $1,600 | $1.07 | 7d | 1 | 0.48mi |
| 3001 Perimeter Blvd South Park, PA | 1.0–2.0 | 1.0–2.0 | 926 | $2,105 | $2.27 | 1d | 20 | 1.25mi |
| 6478 2nd Ave South Park, PA | 3.0 | 2.0 | 1326 | $1,795 | $1.35 | 43d | 1 | 1.40mi |
| 6450 Pleasant St South Park, PA | 1.0–2.0 | 1.0 | 815 | $1,499 | $1.84 | 1d | 3 | 1.44mi |
HOA detail
- Monthly dues
- $590 · $7,080/yr
Listing history 15 events
-
2026-06-18days on market $30,000 Active 22 DOM
-
2026-06-17days on market $30,000 Active 21 DOM
-
2026-06-16days on market $30,000 Active 20 DOM
-
2026-06-15days on market $30,000 Active 19 DOM
-
2026-06-13days on market $30,000 Active 17 DOM
-
2026-06-13days on market $30,000 Active 16 DOM
-
2026-06-09days on market $30,000 Active 13 DOM
-
2026-06-08days on market $30,000 Active 12 DOM
-
2026-06-07days on market $30,000 Active 11 DOM
-
2026-06-05days on market $30,000 Active 8 DOM
-
2026-06-03days on market $30,000 Active 7 DOM
-
2026-06-02days on market $30,000 Active 6 DOM
-
2026-06-01days on market $30,000 Active 5 DOM
-
2026-05-31days on market $30,000 Active 4 DOM
-
2026-05-27$30,000 Active
ⓘ Source: listings_history table (triggers on properties + properties_extension) + one-shot
backfill from property_details.listing_events for pre-trigger history.
Tax reassessment forecast PA · Partial reset (capped growth)
- Current annual tax
- $363 · $30/mo
- Projected year-2 tax
- $418 · $35/mo
- Expected delta
- +$56/yr (+$5/mo · 15.4%)
ⓘ Screening estimate from a state-policy table — verify with the county assessor before closing.
Climate risk First Street
- Flood 4/10 Moderate FEMA zone X (unshaded) · 22% chance over 30 yrs
- Wildfire 1/10 Low
- Heat 3/10 Moderate 7 d/yr ≥97°F today · 18 d/yr by 30 yrs out
- Wind 2/10 Low
- Air quality 3/10 Moderate 2 unhealthy d/yr today · 4 by 30 yrs out
Nearby sold comps map
Loading sold comps map…
Walkable amenities ~0.75 mi
Loading nearby amenities…
Taxation est. · year 1
- Rental income
- $19,282
- − Mortgage interest
- −$1,680
- − Property taxes
- −$363
- − Insurance
- −$150
- − Repairs & maintenance
- −$1,543
- − Management
- −$1,543
- − HOA
- −$7,080
- − Depreciation
- −$873
- Taxable income
- $6,051
- Est. tax owed @ 24.0%
- −$1,452
- After-tax cash flow
- $4,300/yr
For passive investors: Depreciation is non-cash, so a rental often shows a tax loss while cash-flowing — sheltering income. Rental losses are passive: they offset passive income freely, and up to $25,000/yr can offset ordinary (W-2) income if you actively participate and your MAGI is under $100k (phasing out to $0 by $150k); unused losses carry forward. On sale, claimed depreciation is recaptured at up to 25%, and gains may owe capital-gains tax (a 1031 exchange can defer both). Figures are a year-1 estimate at your 24.0% rate — not tax advice; consult a CPA.
Schools (NCES district)
- District
- Ringgold SD
- NCES district ID
- 4220400
- Math proficiency
- 19% ▼ -20.00%
- Reading proficiency
- 36% ▼ -18.00%
- Median HH income
- $46,754
- Composite
- 23.75/100
- National rank
- #7819
- State rank
- #452 of 539 in PA
Livability — Union
No livability data for this city. (Only ~50 U.S. cities are tracked.)
Census & demographics
- Census place
- Gastonville, PA
- County
- Washington County · 106,469 people
- Metro
- Pittsburgh, PA
- Population (ZIP)
- 7,678
- Household income
- $66,578
- Rent vs Own
- Severe rent burden
- 145.0
Population outlook (Washington County) Hauer SSP2
- Today (2025)
- 208,060 people
- By 2030
- 207,168 · -0.4%
- By 2040
- 202,738 · -2.6%
- By 2050
- 195,269 · -6.1%
- By 2075
- 175,588 · -15.6%
- By 2100
- 145,827 · -29.9%
Race, ethnicity, and origin ACS 2023
- Neighborhood character
- Predominantly White (94%)
- Race & ethnicity
- White 94% Two or more races 3% Hispanic / Latino 3%
- Common ancestry
- Romanian 11% Serbian 2% Iranian 1%
- Foreign-born
- 2% · Canada
- Languages at home
- 98% English-only · Spanish 2%
Political lean MEDSL · Washington
- 2024 margin
- Strong R (+25.5) · D 36.9% · R 62.4%
- 2008→2024 swing
- -20.8pp toward R · 2008: -4.7pp · 2024: -25.5pp
- All cycles
- 2024: R+25.5 2020: R+22.8 2016: R+25.3 2012: R+13.3 2008: R+4.7
Not yet ingested
- Civics
- —
Market trends
- HPI YoY
- ▼ -28.78%
- Current HPI
- 239.7401
- Rent YoY
- —
- Metro
- Pittsburgh, PA
- State GDP YoY
- ▲ 1.68%
- F500 in state
- 34
Industry mix (Fortune 500 HQ in PA)
| Industry | F500 HQs | Revenue |
|---|---|---|
| Healthcare | 2 | $309B |
|
||
| Insurance | 2 | $27B |
|
||
| Telecommunications / Media | 1 | $124B |
|
||
| Industrial Distribution | 1 | $22B |
|
||
| Financial Services | 1 | $20B |
|
||
| Chemicals / Materials | 1 | $18B |
|
||
Price history
1 event — show timeline
- 2026-05-27 Listed $30,000 West Penn MLS
Property tax history
-6.4%/yrLatest (2026): $363 · +3.9% YoY. Source: county tax records.
Cash-flow waterfall
monthlySold comps — $/sqft
last 12 mo · ≤1 miLoading sold comps…