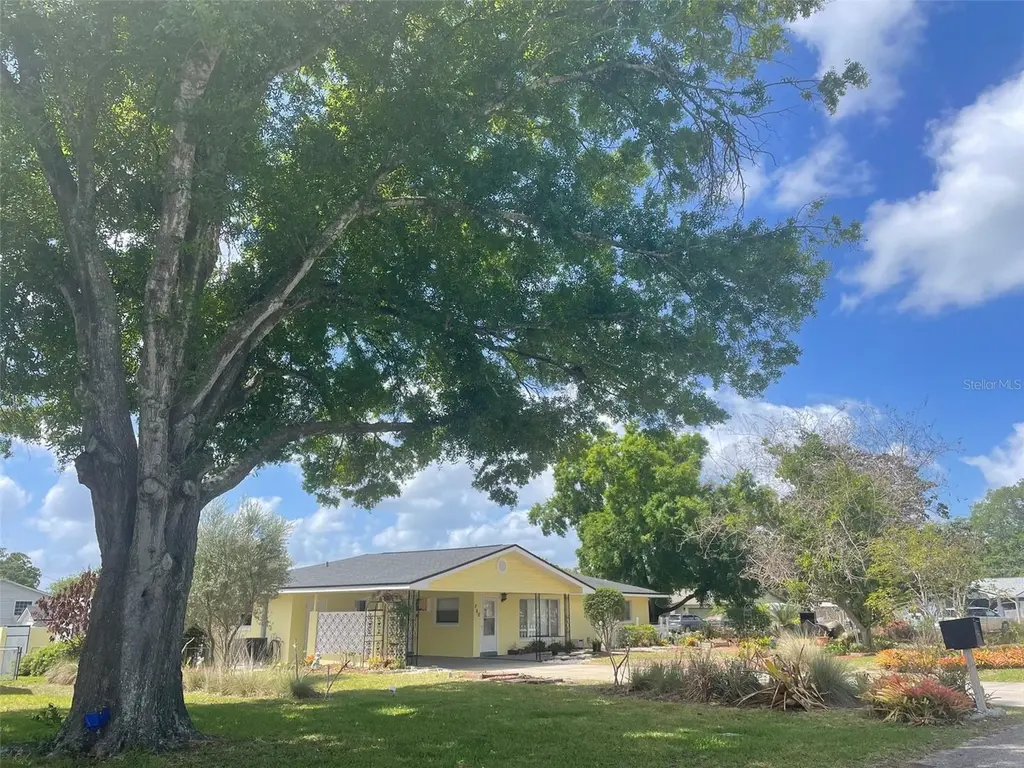
260 W Harbord St · Lake Alfred, FL
Flood risk 1/10 · Minimal
- FEMA flood zone
- X (unshaded)
- Chance of flooding over 30 yrs
- 0.0%
- Est. flood insurance / yr
- $507 – $1,088
Fire risk 5/10 · Moderate
- Est. fire insurance / yr
- $947 – $1,759
Heat risk 8/10 · Major
- Hot days now (above 107°F)
- 7 days/yr
- Hot days in 30 yrs
- 23 days/yr
Wind risk 9/10 · Severe
- Chance of severe wind over 30 yrs
- 99.0%
Air-quality risk 1/10 · Minimal
- Unhealthy air days now
- 0 days/yr
- Unhealthy air days in 30 yrs
- 0 days/yr
Risk factors via First Street. Map © Google.
Why this score? — see what drove the D grade
The composite is a weighted blend of 9 inputs, each scored 0–100. Each bar is that input's sub-score; the figure is the points it added to the 100-point composite (weight × sub-score).
- Cash flow +14.1/30.0
- ARV discount +7.5/15.0
- DSCR +4.3/10.0
- 1% rule +3.9/10.0
- Livability +3.6/5.0
- Schools +3.5/10.0
- Rent growth +2.5/5.0
- Condition / age +2.5/5.0
- Appreciation +0.0/10.0
$245,000
🖨 Deal sheet 📄 Offer letter ✓ Due diligence
Listing remarks MLS
Well maintained home with all the bells and whistles.
Key facts
- Fenced yard
- Detached workshop
- Glass-enclosed porch
Tags
Property features AI
Finance
- Other: Zoning: R-1A
- Financial info: No lease restrictions indicated
- HOA & community: No homeowners association indicated
Exterior
- Parking: Driveway; Carport (2 spaces); Attached garage
- Utilities: Public water; Public sewer; Electricity connected; Cable available
- Home design: Single-family residence; One level; Northeast facing
- Construction: Block construction; Shingle roof; Slab foundation; Built area: 1,560 living area (public records); total building area 2,382 (owner)
- Exterior features: Enclosed patio; Front porch; Rear porch; Private mailbox; Storage; Shed(s); Workshop; Mature landscaping with fruit trees and oak trees; Irrigation equipment
Interior
- Kitchen: Dishwasher; Range; Microwave; Refrigerator; Electric water heater
- Bedrooms: 3 bedrooms
- Flooring: Carpet; Ceramic tile
- Bathrooms: 2 full bathrooms
- Heating & cooling: Central heating; Central air conditioning
- Interior features: Ceiling fans; Open floorplan; Living room and dining room combo; Split-bedroom layout; Walk-in closet(s); Window treatments
- Laundry & utility: Washer and dryer included; Laundry located in the kitchen
Neighborhood map
What this means for you Summary
Snapshot
- This is a 3-bed/2.0-bath single-family listed at $245k.
Deal economics
- At list price, monthly cash flow is $34 ($414/yr) — positive.
- The deal already cash-flows at list — no discount required.
- To meet the 1% rule (rent ≥ 1% of price), the offer needs to be $217k (11.4% below list).
- Recommended offer: $217k (11.4% below list) — sets the bar for 1% rule.
Location & tenants
- Location reads 72/100 on livability (#363 in FL) — a middle-class / working-renter tenant base. Strengths: crime A+, cost of living A+, housing A+; Watch: employment D, amenities F, commute F.
- Polk (suburban): math 39% / reading 43% proficiency, ranked #62 of 73 in FL (top 85%) — families likely to look elsewhere, expect single-tenant / working-renter base with shorter leases.
- Zoned schools: Lake Alfred Elementary School (math 43% / reading 41%, grade F, #1,403 of 2,144 statewide, top 67%, 821 students, 49% FRL); Auburndale Senior High School (math 25% / reading 31%, grade F, #464 of 667 statewide, top 70%, 1,716 students, 53% FRL).
- Market conditions: 279 active listings in the ZIP; 3 comparable units currently listed for rent nearby; rentals leasing fast (median 10d on market — plan ~1-2 weeks tenant-placement turnaround); 10,384 units permitted in Polk County in 2024 (1,716 in 5+ unit buildings).
- This rent runs 42% of the median local income ($62k/yr) — at the standard rent-burdened threshold; future hikes will face affordability resistance.
Forward outlook
- Local home prices are declining (-3.0%/yr); year-one equity from $2k of loan paydown is wiped out by about $7k of value loss. Plan a longer hold.
- Polk County population projected at +33% by 2050 — long-run rental-demand tailwind backs the buy-and-hold thesis.
Negotiation context
- It's been on market 20 days — a 2% lower offer ($241k) is reasonable based on typical stale-listing flexibility.
- 3 sale attempts since 13y ago with the ask held roughly flat each time — persistent listings suggest the price (not the market) is what's stuck; bring a comps-based counter.
- Current owner paid $110k; list at $245k implies a 122% gain — meaningful room to come down on a strong offer.
Risks & watch-outs
- Climate carrying-cost: severe wind risk, 99% chance of damaging wind over 30y; moderate wildfire risk; extreme-heat days projected 7→23/yr by 2055 (HVAC capex compounding) — expect insurance premiums to compound above CPI over the hold.
Questions for the listing agent
- Built in 1962 — when were the roof, HVAC, electrical panel, plumbing, and water heater last replaced?
- Is there a deadline driving the sale (1031 exchange, divorce, estate, relocation)? That informs how much negotiation room exists.
- The area grade is low — what's the realistic commute time and amenity access for the typical tenant pool here? Any planned neighborhood developments (good or bad) we should know about?
- What's the average days-on-market for RENTAL listings here right now (not sales)? A rising rental-DOM trend means longer vacancies and softer asking-rent achievability than the comps imply.
- What's the recent tenant-quality profile in this submarket — average credit score on applications, eviction rate, late-payment / NSF rate, and stable-employment percentage? A property-management company in the area should have these aggregated.
- How much new for-sale + rental construction is in the pipeline within 1–3 miles? Heavy new supply typically softens prices + rents 12–24 months out; constrained supply supports both.
Investment metrics
- 1% rule
- 0.89% ✗
- Cap rate
- 6.46%
- Cash-on-cash
- 0.60%
- DSCR
- 1.03
- GRM
- 9.4
CMA / ARV
No comps found within radius.
Projected returns pro-forma
-3.0% appreciation · 3.0% rent growth · sell at horizon
- IRR
- -15.3%
- Equity multiple
- 0.45×
- Total profit
- $-37,479
- Equity at exit
- $36,530
- IRR
- -6.8%
- Equity multiple
- 0.57×
- Total profit
- $-29,707
- Equity at exit
- $21,183
Cash invested: $68,600 (down + closing). Projections, not guarantees.
Landlord ↔ Tenant lean methodology
- Overall (STATE)
- 87 Strongly Landlord-Friendly
- State Florida
- 87 Strongly Landlord-Friendly · R+3
- County
- — inherits STATE
- City
- — inherits STATE
ZIP-level market 33850
- Home prices YoY
- -8.5%
- Active inventory
- 279
- Price-to-rent
- 9.4×
Monthly cashflow live
- Estimated rent
- $2,170 medium interval (Pro) →
- Mortgage (P&I)
- −$1,285
- Tax from tax record
- −$293 /mo · $3,519/yr
- Insurance
- −$102
- HOA
- −$0
- Vacancy / Maint / Mgmt
- −$456
- Net cashflow
- $34
Break-even live
UW: 25.0% down · 7.5% · 30yr · 1.5% tax · 5.0% vac · 8.0% maint · 8.0% mgmt
Financing live
Cash to close
- Down payment
- $61,250
- Closing costs
- $7,350
- Reserves months
- —
- Total cash needed
- —
Loan-product check · same deal, 3 products live
Conventional
25% down · 7.5% · 30yr
- Down + closing
- —
- Monthly P&I
- —
- Monthly cashflow
- —
- DSCR
- —
- Eligible?
- —
Personal DTI + credit; lowest rate.
DSCR
20% down · 8.5% · 30yr
- Down + closing
- —
- Monthly P&I
- —
- Monthly cashflow
- —
- DSCR
- —
- Eligible?
- —
No personal income docs; deal must DSCR.
Hard money
10% down · 12.0% · 12mo
- Down + closing
- —
- Monthly P&I
- —
- Monthly cashflow
- —
- DSCR
- —
- Eligible?
- —
Short-term bridge; refi at stabilization.
Rent comps 3 comps
| Address | Beds | Baths | Sqft | Rent | $/sqft | DOM | Units | Dist |
|---|---|---|---|---|---|---|---|---|
| 515 S Nekoma Ave Lake Alfred, FL | 3.0 | 2.0 | 2029 | $2,095 | $1.03 | 10d | 1 | 0.09mi |
| 505 Interlock St Lake Alfred, FL | 3.0 | 2.0 | 1443 | $1,919 | $1.33 | 2d | 1 | 0.74mi |
| 234 Cattail Way Lake Alfred, FL | 4.0 | 2.0 | 1689 | $1,911 | $1.13 | 14d | 1 | 1.32mi |
Listing history 9 events
-
2026-05-06status Pending
-
2026-04-30price $245,000
-
2026-04-16$250,000 Active
-
2021-06-06$219,500 Active
-
2013-05-16soldstatus $110,500
-
2013-05-09soldstatus $110,500 53-char remark
Show marketing remark (53 chars)
Well maintained home with all the bells and whistles.
-
2013-03-19$112,000 53-char remark
Show marketing remark (53 chars)
Well maintained home with all the bells and whistles.
-
2002-03-19soldstatus $79,900
-
1993-11-08soldstatus $57,000
ⓘ Source: listings_history table (triggers on properties + properties_extension) + one-shot
backfill from property_details.listing_events for pre-trigger history.
Tax reassessment forecast FL · Resets to sale price
- Current annual tax
- $3,519 · $293/mo
- Projected year-2 tax
- $3,519 · $293/mo
- Expected delta
- $0/yr ($0/mo · 0.0%)
ⓘ Screening estimate from a state-policy table — verify with the county assessor before closing.
Climate risk First Street
- Flood 1/10 Low FEMA zone X (unshaded) · 0% chance over 30 yrs
- Wildfire 5/10 Major
- Heat 8/10 Severe 7 d/yr ≥107°F today · 23 d/yr by 30 yrs out
- Wind 9/10 Extreme 99% chance of damaging wind over 30 yrs
- Air quality 1/10 Low 0 unhealthy d/yr today · 0 by 30 yrs out
Nearby sold comps map
Loading sold comps map…
Walkable amenities ~0.75 mi
Loading nearby amenities…
Taxation est. · year 1
- Rental income
- $26,045
- − Mortgage interest
- −$13,724
- − Property taxes
- −$3,519
- − Insurance
- −$1,225
- − Repairs & maintenance
- −$2,084
- − Management
- −$2,084
- − Depreciation
- −$7,127
- Taxable loss
- −$3,717
- Est. tax savings @ 24.0%
- +$892
- After-tax cash flow
- $1,306/yr
For passive investors: Depreciation is non-cash, so a rental often shows a tax loss while cash-flowing — sheltering income. Rental losses are passive: they offset passive income freely, and up to $25,000/yr can offset ordinary (W-2) income if you actively participate and your MAGI is under $100k (phasing out to $0 by $150k); unused losses carry forward. On sale, claimed depreciation is recaptured at up to 25%, and gains may owe capital-gains tax (a 1031 exchange can defer both). Figures are a year-1 estimate at your 24.0% rate — not tax advice; consult a CPA.
Schools (NCES district)
- District
- Polk
- NCES district ID
- 1201590
- Math proficiency
- 39% ▼ -11.00%
- Reading proficiency
- 43% ▼ -4.00%
- Median HH income
- $43,979
- Composite
- 34.74/100
- National rank
- #5132
- State rank
- #62 of 73 in FL
Livability — Lake Alfred
- Score
- 72/100
- State rank
- #363
- US rank
- #6406
Category grades
Schools grade is shown separately in the Schools card above.
Census & demographics
- Census place
- Lake Alfred, FL
- County
- Polk County · 740,051 people
- City population
- 9,757
- Metro
- Lakeland-Winter Haven, FL
- Population (ZIP)
- 9,757
- Household income
- $61,622
- Rent vs Own
- Severe rent burden
- 431.0
Population outlook (Polk County) Hauer SSP2
- Today (2025)
- 752,975 people
- By 2030
- 804,621 · +6.9%
- By 2040
- 906,117 · +20.3%
- By 2050
- 1,000,476 · +32.9%
- By 2075
- 1,197,520 · +59.0%
- By 2100
- 1,271,518 · +68.9%
Race, ethnicity, and origin ACS 2023
- Neighborhood character
- Diverse neighborhood (Simpson 0.63)
- Race & ethnicity
- White 54% Hispanic / Latino 24% Black 11% Asian 9% Two or more races 8%
- Hispanic origin (detail)
- Mexican 3% Puerto Rican 15% Dominican 2%
- Common ancestry
- Lithuanian 2% Italian 2% Romanian 1%
- Foreign-born
- 15% · Canada, China
- Languages at home
- 72% English-only · Spanish 21% Other Asian/Pacific 2% Other Indo-European 2%
Political lean MEDSL · Polk
- 2024 margin
- Strong R (+20.7) · D 39.2% · R 59.9%
- 2008→2024 swing
- -14.6pp toward R · 2008: -6.1pp · 2024: -20.7pp
- All cycles
- 2024: R+20.7 2020: R+14.4 2016: R+14.1 2012: R+6.8 2008: R+6.1
Not yet ingested
- Civics
- —
Market trends
- HPI YoY
- ▼ -32.91%
- Current HPI
- 353.941
- Rent YoY
- —
- Metro
- Lakeland-Winter Haven, FL
- State GDP YoY
- ▲ 3.28%
- F500 in state
- 36
Industry mix (Fortune 500 HQ in FL)
| Industry | F500 HQs | Revenue |
|---|---|---|
| Industrial Technology | 2 | $29B |
|
||
| Insurance | 2 | $17B |
|
||
| Retail | 1 | $60B |
|
||
| Technology Distribution | 1 | $58B |
|
||
| Homebuilding | 1 | $35B |
|
||
| Technology Manufacturing | 1 | $35B |
|
||
Price history
+329.8% since first listed9 events — show timeline
- 2026-05-06 Pending — Stellar MLS as Distributed by MLS Grid
- 2026-04-30 Price Changed $245,000 Stellar MLS as Distributed by MLS Grid
- 2026-04-16 Listed $250,000 Stellar MLS as Distributed by MLS Grid
- 2021-06-06 Listed $219,500 Stellar MLS as Distributed by MLS Grid
- 2013-05-16 Sold (Public Records) $110,500 Public Records
- 2013-05-09 Sold (MLS) $110,500 Stellar MLS as Distributed by MLS Grid
- 2013-03-19 Listed $112,000 Stellar MLS as Distributed by MLS Grid
- 2002-03-19 Sold (Public Records) $79,900 Public Records
- 1993-11-08 Sold (Public Records) $57,000 Public Records
Property tax history
+15.0%/yrLatest (2025): $3,519 · +5.7% YoY. Source: county tax records.
Cash-flow waterfall
monthlySold comps — $/sqft
last 12 mo · ≤1 miLoading sold comps…