228 Forsythe St · Norfolk, VA
Flood risk 6/10 · Moderate
- FEMA flood zone
- X (shaded)
- Chance of flooding over 30 yrs
- 0.54%
- Est. flood insurance / yr
- $507 – $1,088
Fire risk 1/10 · Minimal
- Est. fire insurance / yr
- $666 – $1,236
Heat risk 9/10 · Severe
- Hot days now (above 104°F)
- 7 days/yr
- Hot days in 30 yrs
- 16 days/yr
Wind risk 8/10 · Major
- Chance of severe wind over 30 yrs
- 80.0%
Air-quality risk 3/10 · Minor
- Unhealthy air days now
- 2 days/yr
- Unhealthy air days in 30 yrs
- 5 days/yr
Risk factors via First Street. Map © Google.
Why this score? — see what drove the C grade
The composite is a weighted blend of 9 inputs, each scored 0–100. Each bar is that input's sub-score; the figure is the points it added to the 100-point composite (weight × sub-score).
- Cash flow +17.5/30.0
- ARV discount +15.0/15.0
- DSCR +5.5/10.0
- Rent growth +5.0/5.0
- 1% rule +4.7/10.0
- Livability +4.2/5.0
- Schools +3.5/10.0
- Condition / age +2.5/5.0
- Appreciation +0.0/10.0
$165,000
🖨 Deal sheet (PDF) 📄 Offer letter ✓ Due diligence
Listing remarks
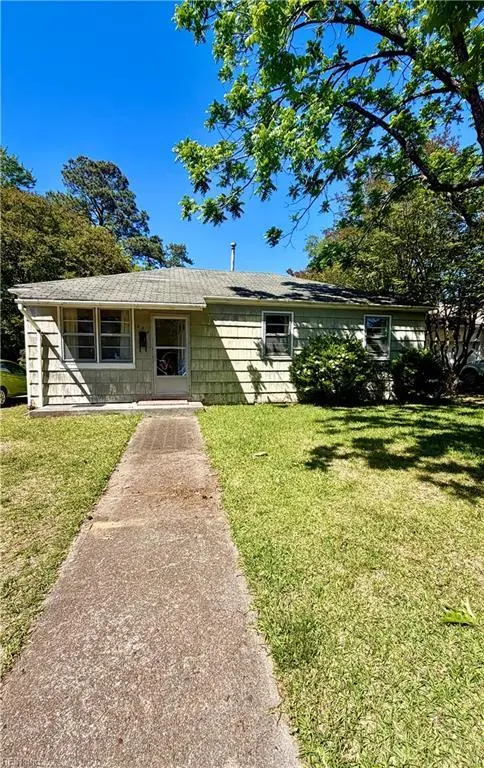
Investor Special in Norfolk, VA. This 3-bedroom, 1-bath home is located on a tree-lined street and features a generous front yard, extended driveway, and additional parking behind the home. A separate workshop and a detached 2-car garage provide excellent functional space for storage or projects. Hardwood floors are believed to be under the carpet, and the home includes a separate utility room. The property offers low-maintenance outdoor space, with most of the usable yard in the front and side. The rear of the property backs to tidal wetlands, offering additional privacy. This is a strong value-add opportunity in an established Norfolk neighborhood with ongoing renovations and solid invest
Key facts
- Additional parking
- Generous front yard
- Extended driveway
Tags
Property features AI
Finance
- Other: Fixer upper
- HOA & community: No HOA
Exterior
- Parking: Detached 2-car garage; Driveway parking; Street parking
- Utilities: City/County water; City/County sewer; Electric water heater
- Home design: Detached ranch-style home; Single-story
- Construction: Asphalt shingle roof; Crawl foundation
- Exterior features: Shingle siding; Detached workshop
Interior
- Kitchen: Kitchen
- Bedrooms: Master bedroom on the first floor; Additional bedroom; First-floor bedroom with full bathroom
- Flooring: Carpet; Ceramic; Wood
- Bathrooms: 1 full bathroom
- Heating & cooling: Natural gas heating; Central air conditioning
- Interior features: Pull-down attic stairs; Attic
- Laundry & utility: Washer hookup; Dryer hookup; Utility room
Neighborhood map
What this means for you Summary
Snapshot
- This is a 3-bed/1.0-bath single-family listed at $165k.
Deal economics
- At list price, monthly cash flow is $126 ($2k/yr) — positive.
- The deal already cash-flows at list — no discount required.
- To meet the 1% rule (rent ≥ 1% of price), the offer needs to be $160k (2.7% below list).
- Recommended offer: $160k (2.7% below list) — sets the bar for 1% rule.
- Cap rate 7.2% vs local median 4.0% in Norfolk — top-decile yield for the area; either an underpriced asset or a hidden risk that comps aren't pricing in. Stress-test before assuming the spread holds.
Location & tenants
- Location reads 83/100 on livability (#43 in VA, #1,026 nationally) — a professional / high-income tenant draw. Strengths: amenities A+, commute A+, health & safety A+; Watch: employment C-, crime F.
- Norfolk City Public School District (urban): math 27% / reading 56% proficiency, ranked #118 of 131 in VA (top 90%) — families likely to look elsewhere, expect single-tenant / working-renter base with shorter leases.
- Zoned schools: Suburban Park Elementary (math 22% / reading 37%, grade F, #1,011 of 1,108 statewide, top 92%, 452 students, 98% FRL); Northside Middle (math 25% / reading 58%, grade F, #299 of 342 statewide, top 88%, 763 students, 92% FRL); Granby High (math 33% / reading 80%, grade C, #270 of 319 statewide, top 86%, 1,837 students, 94% FRL) — zoned schools average 95% FRL vs 59% district-wide (36 pts higher); higher-poverty schools than district average — tighter screening recommended.
- Market conditions: Rents rising fast (+12.1%/yr); 108 active listings in the ZIP; 28 comparable units currently listed for rent nearby; rentals at typical pace (median 25d on market — plan ~3-4 weeks tenant-placement turnaround); 438 units permitted in Norfolk city in 2024 (273 in 5+ unit buildings).
- This rent runs 33% of the median local income ($59k/yr) — at the standard rent-burdened threshold; future hikes will face affordability resistance.
Forward outlook
- Local home prices are declining (-3.0%/yr); year-one equity from $1k of loan paydown is wiped out by about $5k of value loss. Plan a longer hold.
- At projected returns (-3.0% appreciation + 8.0% rent growth), your $46k cash investment doubles in ~10 years — after that, you're playing with house money.
Negotiation context
- Only 5 days on market — expect competitive offers; lowballing is unlikely to land.
Risks & watch-outs
- Watch-outs: built in 1953 — expect roof / HVAC / electrical / plumbing capex.
- Climate carrying-cost: major flood risk; severe wind risk, 80% chance of damaging wind over 30y; extreme-heat days projected 7→16/yr by 2055 (HVAC capex compounding) — expect insurance premiums to compound above CPI over the hold.
Questions for the listing agent
- Built in 1953 — when were the roof, HVAC, electrical panel, plumbing, and water heater last replaced?
- Is there a deadline driving the sale (1031 exchange, divorce, estate, relocation)? That informs how much negotiation room exists.
- Schools are A-rated — typically a magnet for longer-tenancy family renters. What's the average tenant stay here, and is there a school-zone premium baked into asking?
- Crime grade is F in this area — have there been break-ins, vandalism, or insurance claims at this property in the last 3 years? What carrier currently insures it and at what premium?
- What's the average days-on-market for RENTAL listings here right now (not sales)? A rising rental-DOM trend means longer vacancies and softer asking-rent achievability than the comps imply.
- What's the recent tenant-quality profile in this submarket — average credit score on applications, eviction rate, late-payment / NSF rate, and stable-employment percentage? A property-management company in the area should have these aggregated.
- How much new for-sale + rental construction is in the pipeline within 1–3 miles? Heavy new supply typically softens prices + rents 12–24 months out; constrained supply supports both.
Investment metrics
- 1% rule
- 0.97% ✗
- Cap rate
- 7.21%
- Cash-on-cash
- 3.28%
- DSCR
- 1.15
- GRM
- 8.6
CMA / ARV
- ARV (on-the-fly)
- $250,312
- Comps found
- 12
Show comp detail 12 sales within ~0.75 mi
| Address | Dist | Beds/Ba | Sqft | Sold | Price | $/sf | Match |
|---|---|---|---|---|---|---|---|
| 228 Forsythe St | 0.00mi | 3/1.0 | 934 (0%) | 1mo | $175,000 | $187 | 100 |
| 6428 Garland Cir | 0.58mi | 3/1.0 | 967 (+4%) | 3mo | $260,000 | $269 | 65 |
| 7524 Virginian Dr | 0.48mi | 2/1.0 (-1) | 909 (-3%) | 10mo | $256,000 | $282 | 59 |
| 6424 Tappahannock Dr | 0.75mi | 3/1.0 | 967 (+4%) | 0mo | $251,200 | $260 | 59 |
| 549 Summers Dr | 0.59mi | 3/1.0 | 967 (+4%) | 10mo | $217,500 | $225 | 59 |
| 215 Burleigh Ave | 0.63mi | 2/1.0 (-1) | 923 (-1%) | 6mo | $259,900 | $282 | 58 |
| 6424 Garland Cir | 0.59mi | 3/1.0 | 967 (+4%) | 10mo | $250,000 | $259 | 58 |
| 7526 Yorktown Dr | 0.53mi | 2/1.0 (-1) | 868 (-7%) | 6mo | $219,000 | $252 | 54 |
| 410 N Shore Rd | 0.72mi | 3/1.0 | 1,000 (+7%) | 2mo | $273,000 | $273 | 53 |
| 561 Garren Ave | 0.69mi | 3/1.0 | 987 (+6%) | 8mo | $265,000 | $268 | 51 |
| 6449 Tappahannock Dr | 0.68mi | 3/2.0 | 967 (+4%) | 9mo | $260,000 | $269 | 51 |
| 401 Biltmore Rd | 0.73mi | 2/1.0 (-1) | 855 (-8%) | 5mo | $151,000 | $177 | 43 |
Match score weights: distance 35% · size 25% · config 20% · recency 20%. Top-matched comps best support the ARV.
Projected returns pro-forma
-3.0% appreciation · 8.0% rent growth · sell at horizon
- IRR
- -5.6%
- Equity multiple
- 0.78×
- Total profit
- $-10,191
- Equity at exit
- $24,602
- IRR
- 9.2%
- Equity multiple
- 1.87×
- Total profit
- $40,178
- Equity at exit
- $14,266
Cash invested: $46,200 (down + closing). Projections, not guarantees.
Landlord ↔ Tenant lean methodology
- Overall (STATE)
- 55 Moderately Landlord-Leaning
- State Virginia
- 55 Moderately Landlord-Leaning · D+2
- County
- — inherits STATE
- City
- — inherits STATE
ZIP-level market 23505
- Home prices YoY
- -19.6%
- Rents YoY
- 12.1%
- Active inventory
- 108
- Price-to-rent
- 8.6×
Monthly cashflow live
- Estimated rent
- $1,605 high interval (Pro) →
- Mortgage (P&I)
- −$865
- Tax from tax record
- −$207 /mo · $2,490/yr
- Insurance
- −$69
- HOA
- −$0
- Vacancy / Maint / Mgmt
- −$337
- Net cashflow
- $126
Break-even live
Sensitivity live
| Price | -10% $220 | -5% $173 | +0% $126 | +5% $80 | +10% $33 |
|---|---|---|---|---|---|
| Rent | -10% $-1 | -5% $63 | +0% $126 | +5% $190 | +10% $253 |
| Rate | -1.0pp $209 | -0.5pp $168 | base $126 | +0.5pp $83 | +1.0pp $40 |
UW: 25.0% down · 7.5% · 30yr · 1.5% tax · 5.0% vac · 8.0% maint · 8.0% mgmt
Financing live
Cash to close
- Down payment
- $41,250
- Closing costs
- $4,950
- Reserves months
- —
- Total cash needed
- —
Loan-product check · same deal, 3 products live
Conventional
25% down · 7.5% · 30yr
- Down + closing
- —
- Monthly P&I
- —
- Monthly cashflow
- —
- DSCR
- —
- Eligible?
- —
Personal DTI + credit; lowest rate.
DSCR
20% down · 8.5% · 30yr
- Down + closing
- —
- Monthly P&I
- —
- Monthly cashflow
- —
- DSCR
- —
- Eligible?
- —
No personal income docs; deal must DSCR.
Hard money
10% down · 12.0% · 12mo
- Down + closing
- —
- Monthly P&I
- —
- Monthly cashflow
- —
- DSCR
- —
- Eligible?
- —
Short-term bridge; refi at stabilization.
Rent comps 28 comps
| Address | Beds | Baths | Sqft | Rent | $/sqft | DOM | Units | Dist |
|---|---|---|---|---|---|---|---|---|
| 310 Naval Base Rd Norfolk, VA | 3.0 | 1.0 | 1000 | $1,850 | $1.85 | 25d | 1 | 0.64mi |
| 307 W Little Creek Rd Unit C Norfolk, VA | 2.0 | 1.0 | 830 | $1,395 | $1.68 | 12d | 1 | 0.70mi |
| 609 Summers Dr Norfolk, VA | 3.0 | 1.0 | 998 | $1,995 | $2.00 | 5d | 1 | 0.74mi |
| 351 San Antonio Blvd Unit 8 Norfolk, VA | 2.0 | 1.0 | 675 | $1,250 | $1.85 | 14d | 1 | 0.77mi |
| 7474 Pennington Rd Unit 7474 Norfolk, VA | 2.0 | 1.0 | 1000 | $1,525 | $1.52 | 3d | 1 | 0.91mi |
| 440 San Antonio Blvd Norfolk, VA | 2.0 | 1.0 | 800 | $1,535 | $1.92 | 25d | 1 | 0.93mi |
| 502 Grantham Rd Norfolk, VA | 1.0–2.0 | 1.0 | 740 | $1,128 | $1.52 | 45d | 3 | 0.93mi |
| 715 Easy St Unit 2 Norfolk, VA | 2.0 | 1.0 | 750 | $1,200 | $1.60 | 16d | 1 | 0.94mi |
| 7433 Fenner St Norfolk, VA | 1.0–2.0 | 1.0 | 715 | $1,399 | $1.96 | 16d | 7 | 0.97mi |
| 311 Ashlawn Dr Unit 3 Norfolk, VA | 2.0 | 1.0 | 800 | $1,195 | $1.49 | 46d | 1 | 0.98mi |
| 312 Ashlawn Dr Norfolk, VA | 2.0 | 1.0 | 720 | $1,200 | $1.67 | 45d | 1 | 1.00mi |
| 7427 Tyndale Ct Unit 1 Norfolk, VA | 2.0 | 1.0 | 786 | $995 | $1.27 | 45d | 1 | 1.01mi |
| 417 E Little Creek Rd Apt 4 Norfolk, VA | 2.0 | 1.0 | 700 | $1,050 | $1.50 | 9d | 1 | 1.03mi |
| 7465 Fenner St Unit 7468-2-A8 Norfolk, VA | 2.0 | 1.0 | 900 | $1,399 | $1.55 | 22d | 1 | 1.04mi |
| 837 Tifton St Norfolk, VA | 3.0 | 2.0 | 1072 | $2,300 | $2.15 | 25d | 1 | 1.08mi |
| 739 Waukesha Ave Norfolk, VA | 2.0 | 1.0 | 860 | $1,800 | $2.09 | 25d | 1 | 1.11mi |
| 507 Ashlawn Dr Norfolk, VA | 2.0 | 1.0 | 750 | $1,395 | $1.86 | 45d | 1 | 1.13mi |
| 7730 Ruthven Rd Norfolk, VA | 3.0 | 1.0 | 1056 | $1,750 | $1.66 | 25d | 1 | 1.15mi |
| 504 Ashlawn Dr Norfolk, VA | 2.0 | 1.0 | 725 | $1,250 | $1.72 | 23d | 1 | 1.15mi |
| 504 Ashlawn Dr Unit 2 Norfolk, VA | 2.0 | 1.0 | 725 | $1,250 | $1.72 | 25d | 1 | 1.15mi |
| 508 Ashlawn Dr Unit 2 Norfolk, VA | 2.0 | 1.0 | 725 | $1,250 | $1.72 | 23d | 1 | 1.16mi |
| 6115 Tidewater Dr Norfolk, VA | 1.0–2.0 | 1.0–2.0 | 956 | $2,274 | $2.38 | 3d | 8 | 1.17mi |
| 7872 Ogden Ave Norfolk, VA | 1.0–3.0 | 1.0–2.0 | 963 | $1,515 | $1.57 | 45d | 1 | 1.27mi |
| 7996 Diggs Rd Unit D Norfolk, VA | 3.0 | 2.0 | 950 | $1,375 | $1.45 | 45d | 1 | 1.28mi |
| 1111 Charleston St Norfolk, VA | 2.0 | 1.0 | 822 | $1,425 | $1.73 | 45d | 1 | 1.35mi |
| 7922 Old Ocean View Rd Norfolk, VA | 1.0–3.0 | 1.0–1.5 | 890 | $1,300 | $1.46 | 3d | 3 | 1.37mi |
| 7128 Gregory Dr Norfolk, VA | 2.0 | 1.0 | 720 | $1,800 | $2.50 | 45d | 1 | 1.46mi |
| 7108 Gregory Dr Norfolk, VA | 2.0 | 1.0 | 720 | $1,400 | $1.94 | 45d | 1 | 1.48mi |
Listing history 1 events
-
2026-05-21$165,000 Active
ⓘ Source: listings_history table (triggers on properties + properties_extension) + one-shot
backfill from property_details.listing_events for pre-trigger history.
Tax reassessment forecast VA · Resets to sale price
- Current annual tax
- $2,490 · $207/mo
- Projected year-2 tax
- $2,490 · $207/mo
- Expected delta
- $0/yr ($0/mo · 0.0%)
ⓘ Screening estimate from a state-policy table — verify with the county assessor before closing.
Climate risk First Street
- Flood 6/10 Major FEMA zone X (shaded) · 54% chance over 30 yrs
- Wildfire 1/10 Low
- Heat 9/10 Extreme 7 d/yr ≥104°F today · 16 d/yr by 30 yrs out
- Wind 8/10 Severe 80% chance of damaging wind over 30 yrs
- Air quality 3/10 Moderate 2 unhealthy d/yr today · 5 by 30 yrs out
Nearby sold comps map
Loading sold comps map…
Walkable amenities ~0.75 mi
Loading nearby amenities…
Taxation est. · year 1
- Rental income
- $19,257
- − Mortgage interest
- −$9,243
- − Property taxes
- −$2,490
- − Insurance
- −$825
- − Repairs & maintenance
- −$1,541
- − Management
- −$1,541
- − Depreciation
- −$4,800
- Taxable loss
- −$1,182
- Est. tax savings @ 24.0%
- +$284
- After-tax cash flow
- $1,798/yr
For passive investors: Depreciation is non-cash, so a rental often shows a tax loss while cash-flowing — sheltering income. Rental losses are passive: they offset passive income freely, and up to $25,000/yr can offset ordinary (W-2) income if you actively participate and your MAGI is under $100k (phasing out to $0 by $150k); unused losses carry forward. On sale, claimed depreciation is recaptured at up to 25%, and gains may owe capital-gains tax (a 1031 exchange can defer both). Figures are a year-1 estimate at your 24.0% rate — not tax advice; consult a CPA.
Schools (NCES district)
- District
- Norfolk City Public School District
- NCES district ID
- 5102670
- Math proficiency
- 27% ▼ -44.00%
- Reading proficiency
- 56% ▼ -10.00%
- Median HH income
- $44,358
- Composite
- 35.08/100
- National rank
- #5026
- State rank
- #118 of 131 in VA
Livability — Norfolk
- Score
- 83/100
- State rank
- #43
- US rank
- #1026
Category grades
Schools grade is shown separately in the Schools card above.
Census & demographics
- Census place
- Norfolk, VA
- County
- Norfolk City · 214,042 people
- City population
- 214,042
- Metro
- Virginia Beach-Norfolk-Newport News, VA-NC
- Population (ZIP)
- 28,247
- Household income
- $58,579
- Rent vs Own
- Severe rent burden
- 2299.0
Population outlook (Norfolk County) Hauer SSP2
- Today (2025)
- 249,032 people
- By 2030
- 252,347 · +1.3%
- By 2040
- 253,644 · +1.9%
- By 2050
- 251,913 · +1.2%
- By 2075
- 245,281 · -1.5%
- By 2100
- 219,548 · -11.8%
Race, ethnicity, and origin ACS 2023
- Neighborhood character
- Diverse neighborhood (Simpson 0.67)
- Race & ethnicity
- White 44% Black 34% Hispanic / Latino 12% Two or more races 8% Asian 4%
- Hispanic origin (detail)
- Mexican 4% Puerto Rican 3%
- Common ancestry
- Romanian 2% Slovak 2% Italian 2%
- Foreign-born
- 9% · Canada, United Kingdom, South Korea
- Languages at home
- 87% English-only · Spanish 6% Tagalog/Filipino 1% French/Haitian/Cajun 1%
Political lean MEDSL · Norfolk
- 2024 margin
- Solid D (+41.5) · D 70.0% · R 28.5% · Other 1.6%
- 2008→2024 swing
- -1.4pp toward R · 2008: 43.0pp · 2024: 41.5pp
- All cycles
- 2024: D+41.5 2020: D+45.6 2016: D+42.0 2012: D+44.0 2008: D+43.0
Not yet ingested
- Civics
- —
Market trends
- HPI YoY
- ▼ -71.86%
- Current HPI
- 294.9807
- Rent YoY
- ▲ 12.08%
- Metro
- Virginia Beach-Norfolk-Newport News, VA-NC
- State GDP YoY
- ▲ 2.40%
- F500 in state
- 50
Industry mix (Fortune 500 HQ in VA)
| Industry | F500 HQs | Revenue |
|---|---|---|
| Aerospace / Defense | 4 | $236B |
|
||
| Technology / Defense | 3 | $32B |
|
||
| Financial Services | 2 | $176B |
|
||
| Utilities | 2 | $27B |
|
||
| Insurance | 2 | $25B |
|
||
| Technology | 2 | $15B |
|
||
Price history
1 event — show timeline
- 2026-05-21 Listed $165,000 REINMLS
Property tax history
+16.7%/yrLatest (2025): $2,490 · +16.3% YoY. Source: county tax records.
Cash-flow waterfall
monthlySold comps — $/sqft
last 12 mo · ≤1 miLoading sold comps…