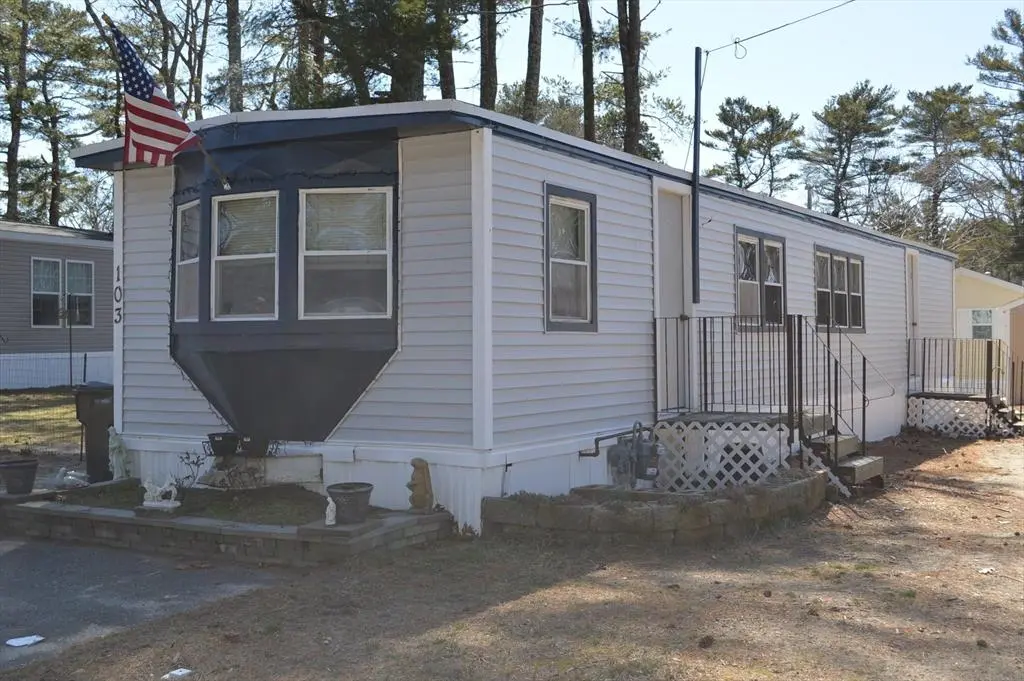
103 Kimberly Ct · Wareham, MA
Flood risk 6/10 · Moderate
- FEMA flood zone
- X (unshaded)
- Chance of flooding over 30 yrs
- 0.73%
- Est. flood insurance / yr
- $507 – $1,088
Fire risk 1/10 · Minimal
- Est. fire insurance / yr
- $915 – $1,699
Heat risk 5/10 · Moderate
- Hot days now (above 93°F)
- 7 days/yr
- Hot days in 30 yrs
- 16 days/yr
Wind risk 8/10 · Major
- Chance of severe wind over 30 yrs
- 80.0%
Air-quality risk 2/10 · Minimal
- Unhealthy air days now
- 1 days/yr
- Unhealthy air days in 30 yrs
- 1 days/yr
Risk factors via First Street. Map © Google.
Why this score? — see what drove the B grade
The composite is a weighted blend of 9 inputs, each scored 0–100. Each bar is that input's sub-score; the figure is the points it added to the 100-point composite (weight × sub-score).
- Cash flow +30.0/30.0
- ARV discount +15.0/15.0
- 1% rule +10.0/10.0
- DSCR +10.0/10.0
- Rent growth +2.5/5.0
- Livability +2.5/5.0
- Condition / age +2.5/5.0
- Schools +2.3/10.0
- Appreciation +0.0/10.0
$149,900
🖨 Deal sheet 📄 Offer letter ✓ Due diligence
Listing remarks MLS
Nicely maintained three-bedroom two bath home in Garden Homes North, a family park. Primary bedroom has its own bathroom, newer rubber roof, replacement windows, new furnace in 2026 and much more. Conveniently located close to highways, beaches, and shopping. Move-in ready Call today for your private viewing.
Key facts
- 2 parking spots
- Built 1971
- Listed 72 days
Neighborhood map
What this means for you Summary
Snapshot
- This is a 3-bed/2.0-bath manufactured listed at $150k.
Deal economics
- At list price, monthly cash flow is $966 ($12k/yr) — positive.
- The deal already cash-flows at list — no discount required.
- Meets the 1% rule at list price ($3k rent vs $150k).
- Recommended offer: $141k (6.0% below list) — sets the bar for market timing.
Location & tenants
- Location reads: area grade B — affects rentability + tenant quality, not the cash-flow math above.
- Wareham (suburban): math 17% / reading 33% proficiency, ranked #271 of 302 in MA (top 90%) — low school quality limits family demand, transient renter base, plan for 1-2y turnover.
- Market conditions: 47 active listings in the ZIP; 1 comparable units currently listed for rent nearby; 1,255 units permitted in Plymouth County in 2024 (411 in 5+ unit buildings).
Forward outlook
- Local home prices are declining (-3.0%/yr); year-one equity from $1k of loan paydown is wiped out by about $4k of value loss. Plan a longer hold.
- At projected returns (-3.0% appreciation + 3.0% rent growth), your $42k cash investment doubles in ~5 years — after that, you're playing with house money.
Negotiation context
- It's been on market 72 days — a 6% lower offer ($141k) is reasonable based on typical stale-listing flexibility.
- 5 sale attempts since 27y ago; this cycle's ask has dropped $10k (6%) from the opening price — seller is motivated, your offer sets the floor, not the list.
- Current owner paid $23k; list at $150k implies a 552% gain — meaningful room to come down on a strong offer.
Risks & watch-outs
- Climate carrying-cost: major flood risk; severe wind risk, 80% chance of damaging wind over 30y; extreme-heat days projected 7→16/yr by 2055 (HVAC capex compounding) — expect insurance premiums to compound above CPI over the hold.
Questions for the listing agent
- It's been on market 72 days. Have you received any prior offers? Is the seller open to a 6% concession, seller financing, or rate buy-down credit?
- Built in 1971 — when were the roof, HVAC, electrical panel, plumbing, and water heater last replaced?
- Why hasn't it sold? Are there any deal-killer items the seller is aware of (foundation, flood, title, zoning, code violations)?
- Is there a deadline driving the sale (1031 exchange, divorce, estate, relocation)? That informs how much negotiation room exists.
- What's the average days-on-market for RENTAL listings here right now (not sales)? A rising rental-DOM trend means longer vacancies and softer asking-rent achievability than the comps imply.
- What's the recent tenant-quality profile in this submarket — average credit score on applications, eviction rate, late-payment / NSF rate, and stable-employment percentage? A property-management company in the area should have these aggregated.
- How much new for-sale + rental construction is in the pipeline within 1–3 miles? Heavy new supply typically softens prices + rents 12–24 months out; constrained supply supports both.
Investment metrics
- 1% rule
- 1.69% ✓
- Cap rate
- 14.03%
- Cash-on-cash
- 27.62%
- DSCR
- 2.23
- GRM
- 4.9
CMA / ARV
- ARV (median comp)
- $222,576
- List price
- $149,900
- Delta
- -32.65%
- Verdict
- UNDERPRICED
- Comps
- 3 within 1.0 mi
Show comp detail 1 sale within ~0.75 mi
| Address | Dist | Beds/Ba | Sqft | Sold | Price | $/sf | Match |
|---|---|---|---|---|---|---|---|
| 83 Kristen Ln | 0.06mi | 2/2.0 (-1) | 924 (+10%) | 11mo | $250,000 | $271 | 67 |
Match score weights: distance 35% · size 25% · config 20% · recency 20%. Top-matched comps best support the ARV.
Projected returns pro-forma
-3.0% appreciation · 3.0% rent growth · sell at horizon
- IRR
- 21.7%
- Equity multiple
- 1.89×
- Total profit
- $37,269
- Equity at exit
- $22,351
- IRR
- 29.8%
- Equity multiple
- 3.66×
- Total profit
- $111,826
- Equity at exit
- $12,961
Cash invested: $41,972 (down + closing). Projections, not guarantees.
Landlord ↔ Tenant lean methodology
- Overall (STATE)
- 20 Strongly Tenant-Friendly
- State Massachusetts
- 20 Strongly Tenant-Friendly · D+15
- County
- — inherits STATE
- City
- — inherits STATE
ZIP-level market 02571
- Home prices YoY
- -33.7%
- Active inventory
- 47
- Price-to-rent
- 4.9×
Monthly cashflow live
- Estimated rent
- $2,534 medium interval (Pro) →
- Mortgage (P&I)
- −$786
- Tax est. 1.5%
- −$187 /mo · $2,248/yr
- Insurance
- −$62
- HOA
- −$0
- Vacancy / Maint / Mgmt
- −$532
- Net cashflow
- $966
Break-even live
UW: 25.0% down · 7.5% · 30yr · 1.5% tax · 5.0% vac · 8.0% maint · 8.0% mgmt
Financing live
Cash to close
- Down payment
- $37,475
- Closing costs
- $4,497
- Reserves months
- —
- Total cash needed
- —
Loan-product check · same deal, 3 products live
Conventional
25% down · 7.5% · 30yr
- Down + closing
- —
- Monthly P&I
- —
- Monthly cashflow
- —
- DSCR
- —
- Eligible?
- —
Personal DTI + credit; lowest rate.
DSCR
20% down · 8.5% · 30yr
- Down + closing
- —
- Monthly P&I
- —
- Monthly cashflow
- —
- DSCR
- —
- Eligible?
- —
No personal income docs; deal must DSCR.
Hard money
10% down · 12.0% · 12mo
- Down + closing
- —
- Monthly P&I
- —
- Monthly cashflow
- —
- DSCR
- —
- Eligible?
- —
Short-term bridge; refi at stabilization.
Rent comps 1 comps
| Address | Beds | Baths | Sqft | Rent | $/sqft | DOM | Units | Dist |
|---|---|---|---|---|---|---|---|---|
| 1 Gatehouse Dr East Wareham, MA | 2.0–3.0 | 2.0 | 1070 | $2,534 | $2.37 | 1d | 3 | 1.03mi |
Listing history 21 events
-
2026-06-09days on market $149,900 Active 72 DOM
-
2026-06-08days on market $149,900 Active 71 DOM
-
2026-06-07days on market $149,900 Active 70 DOM
-
2026-06-04days on market $149,900 Active 67 DOM
-
2026-06-03days on market $149,900 Active 66 DOM
-
2026-06-02days on market $149,900 Active 65 DOM
-
2026-06-01days on market $149,900 Active 64 DOM
-
2026-05-31days on market $149,900 Active 63 DOM
-
2026-05-11price $149,900 311-char remark
Show marketing remark (311 chars)
Nicely maintained three-bedroom two bath home in Garden Homes North, a family park. Primary bedroom has its own bathroom, newer rubber roof, replacement windows, new furnace in 2026 and much more. Conveniently located close to highways, beaches, and shopping. Move-in ready Call today for your private viewing.
-
2026-03-29$159,900 New 311-char remark
Show marketing remark (311 chars)
Nicely maintained three-bedroom two bath home in Garden Homes North, a family park. Primary bedroom has its own bathroom, newer rubber roof, replacement windows, new furnace in 2026 and much more. Conveniently located close to highways, beaches, and shopping. Move-in ready Call today for your private viewing.
-
2008-01-26historical 313-char remark
Show marketing remark (313 chars)
Newly Vinyl sided mobile home in family park. Good condition needs minor work nothing major. Brand new fridge 2 full baths and 3 bedrooms. New blower in furnace as well. Park fee includes sewer water taxes snow and trash removal. Purchase as an investment or live there, had tenants who were paying $975/month.
-
2008-01-26soldstatus $23,000 313-char remark
Show marketing remark (313 chars)
Newly Vinyl sided mobile home in family park. Good condition needs minor work nothing major. Brand new fridge 2 full baths and 3 bedrooms. New blower in furnace as well. Park fee includes sewer water taxes snow and trash removal. Purchase as an investment or live there, had tenants who were paying $975/month.
-
2007-03-26$35,000 313-char remark
Show marketing remark (313 chars)
Newly Vinyl sided mobile home in family park. Good condition needs minor work nothing major. Brand new fridge 2 full baths and 3 bedrooms. New blower in furnace as well. Park fee includes sewer water taxes snow and trash removal. Purchase as an investment or live there, had tenants who were paying $975/month.
-
2006-03-31soldstatus $40,000
-
2006-03-01historical
-
2006-01-17$42,000
-
2004-11-02soldstatus $28,000
-
2004-09-25historical
-
2004-05-14$32,000
-
1999-04-27soldstatus $22,000
-
1999-02-17$22,500
ⓘ Source: listings_history table (triggers on properties + properties_extension) + one-shot
backfill from property_details.listing_events for pre-trigger history.
Climate risk First Street
- Flood 6/10 Major FEMA zone X (unshaded) · 73% chance over 30 yrs
- Wildfire 1/10 Low
- Heat 5/10 Major 7 d/yr ≥93°F today · 16 d/yr by 30 yrs out
- Wind 8/10 Severe 80% chance of damaging wind over 30 yrs
- Air quality 2/10 Low 1 unhealthy d/yr today · 1 by 30 yrs out
Nearby sold comps map
Loading sold comps map…
Walkable amenities ~0.75 mi
Loading nearby amenities…
Taxation est. · year 1
- Rental income
- $30,408
- − Mortgage interest
- −$8,397
- − Property taxes
- −$2,248
- − Insurance
- −$750
- − Repairs & maintenance
- −$2,433
- − Management
- −$2,433
- − Depreciation
- −$4,361
- Taxable income
- $9,787
- Est. tax owed @ 24.0%
- −$2,349
- After-tax cash flow
- $9,242/yr
For passive investors: Depreciation is non-cash, so a rental often shows a tax loss while cash-flowing — sheltering income. Rental losses are passive: they offset passive income freely, and up to $25,000/yr can offset ordinary (W-2) income if you actively participate and your MAGI is under $100k (phasing out to $0 by $150k); unused losses carry forward. On sale, claimed depreciation is recaptured at up to 25%, and gains may owe capital-gains tax (a 1031 exchange can defer both). Figures are a year-1 estimate at your 24.0% rate — not tax advice; consult a CPA.
Schools (NCES district)
- District
- Wareham
- NCES district ID
- 2512060
- Math proficiency
- 17% ▼ -10.00%
- Reading proficiency
- 33% ▼ -5.00%
- Median HH income
- $58,171
- Composite
- 22.78/100
- National rank
- #8024
- State rank
- #271 of 302 in MA
Livability — Wareham
No livability data for this city. (Only ~50 U.S. cities are tracked.)
Census & demographics
- Population (ZIP)
- 10,538
Population outlook (Plymouth County) Hauer SSP2
- Today (2025)
- 533,105 people
- By 2030
- 541,862 · +1.6%
- By 2040
- 549,791 · +3.1%
- By 2050
- 542,476 · +1.8%
- By 2075
- 518,429 · -2.8%
- By 2100
- 448,179 · -15.9%
Race, ethnicity, and origin ACS 2023
- Neighborhood character
- Predominantly White (79%)
- Race & ethnicity
- White 79% Two or more races 7% Black 2%
- Common ancestry
- Slovak 9% Russian 6% Lithuanian 6%
- Foreign-born
- 5% · Canada
- Languages at home
- 92% English-only · Other Indo-European 4% French/Haitian/Cajun 1% Other Asian/Pacific 1%
Political lean MEDSL · Plymouth
- 2024 margin
- Lean D (+8.8) · D 53.6% · R 44.7% · Other 1.7%
- 2008→2024 swing
- +1.3pp toward D · 2008: 7.6pp · 2024: 8.8pp
- All cycles
- 2024: D+8.8 2020: D+17.4 2016: D+7.2 2012: D+3.8 2008: D+7.6
Not yet ingested
- Civics
- —
Market trends
- HPI YoY
- ▼ -158.12%
- Current HPI
- 311.1966
- Rent YoY
- —
- Metro
- —
- State GDP YoY
- ▲ 2.28%
- F500 in state
- 38
Industry mix (Fortune 500 HQ in MA)
| Industry | F500 HQs | Revenue |
|---|---|---|
| Technology | 3 | $17B |
|
||
| Insurance | 2 | $84B |
|
||
| Retail | 2 | $76B |
|
||
| Life Sciences | 1 | $43B |
|
||
| Energy Technology | 1 | $31B |
|
||
| Aerospace / Defense | 1 | $18B |
|
||
Price history
+566.2% since first listed13 events — show timeline
- 2026-05-11 Price Changed $149,900 MLS PIN
- 2026-03-29 Listed $159,900 MLS PIN
- 2008-01-26 Sold (MLS) $23,000 MLS PIN
- 2008-01-26 Listing Removed — MLS PIN
- 2007-03-26 Listed $35,000 MLS PIN
- 2006-03-31 Sold (MLS) $40,000 MLS PIN
- 2006-03-01 Listing Removed — MLS PIN
- 2006-01-17 Listed $42,000 MLS PIN
- 2004-11-02 Sold (MLS) $28,000 MLS PIN
- 2004-09-25 Listing Removed — MLS PIN
- 2004-05-14 Listed $32,000 MLS PIN
- 1999-04-27 Sold (MLS) $22,000 CCIMLS
- 1999-02-17 Listed $22,500 CCIMLS
Cash-flow waterfall
monthlySold comps — $/sqft
last 12 mo · ≤1 miLoading sold comps…