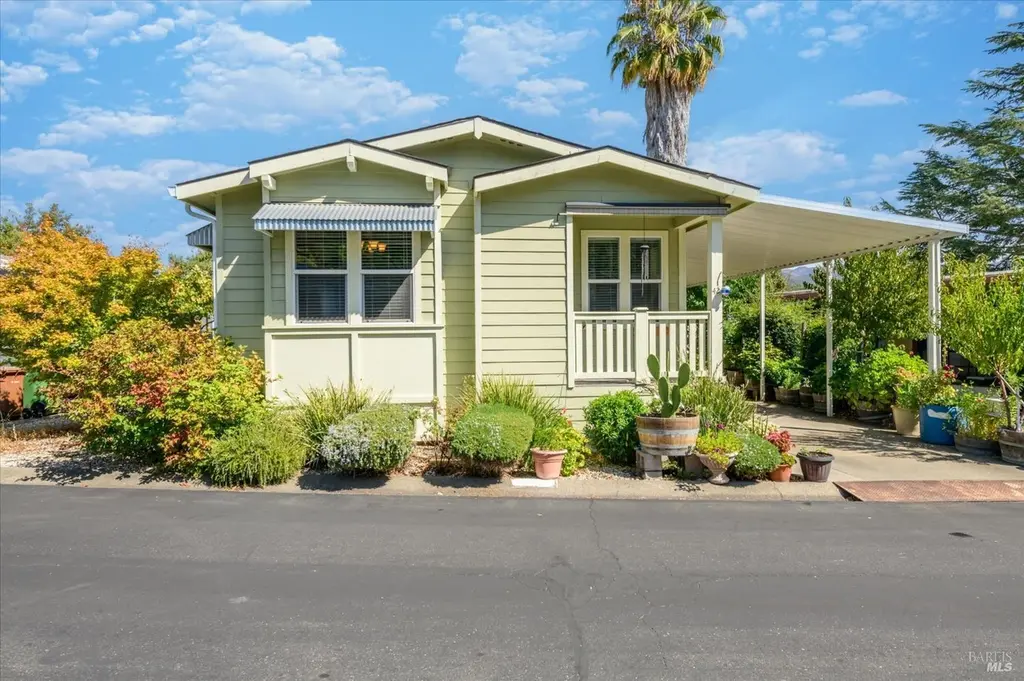
2412 Foothill Blvd #42 · Calistoga, CA
Flood risk 1/10 · Minimal
- FEMA flood zone
- X (unshaded)
- Chance of flooding over 30 yrs
- 0.0%
- Est. flood insurance / yr
- $507 – $1,088
Fire risk 7/10 · Major
- Est. fire insurance / yr
- $659 – $1,223
Heat risk 4/10 · Minor
- Hot days now (above 100°F)
- 7 days/yr
- Hot days in 30 yrs
- 15 days/yr
Wind risk 1/10 · Minimal
- Chance of severe wind over 30 yrs
- —
Air-quality risk 10/10 · Severe
- Unhealthy air days now
- 29 days/yr
- Unhealthy air days in 30 yrs
- 30 days/yr
Risk factors via First Street. Map © Google.
Why this score? — see what drove the C+ grade
The composite is a weighted blend of 9 inputs, each scored 0–100. Each bar is that input's sub-score; the figure is the points it added to the 100-point composite (weight × sub-score).
- Cash flow +27.6/30.0
- DSCR +9.7/10.0
- ARV discount +7.5/15.0
- 1% rule +6.2/10.0
- Schools +3.9/10.0
- Livability +3.2/5.0
- Rent growth +2.5/5.0
- Condition / age +2.5/5.0
- Appreciation +0.0/10.0
$325,000
🖨 Deal sheet (PDF) 📄 Offer letter ✓ Due diligence
Listing remarks MLS
Welcome to this charming 3-bedroom, 2-bath manufactured home built in 2014, located in the Rancho de Calistoga 55+ community. This move-in ready residence offers a spacious open-concept layout with a well-appointed kitchen featuring a center island, perfect for entertaining or casual dining. Enjoy year-round comfort with central heat and air, and the convenience of an inside laundry area. Step outside to your private outdoor dining area, ideal for morning coffee or evening gatherings. A large outdoor storage shed provides ample space for tools, hobbies, or seasonal items. Rancho de Calistoga offers a wealth of amenities including a clubhouse with a library, game room, and full kitchen, a heated swimming pool, hot tub, barbecue area, and a fully equipped exercise room. RV and boat owners will appreciate the on-site storage facilities, and a scenic community path provides easy access to downtown Calistoga, approximately 1.5 miles away. Don't miss your chance to enjoy relaxed Wine Country living with an abundance of community features in one of Calistoga's most welcoming neighborhoods.
Key facts
- Heated swimming pool
- Open-concept layout
- 2 parking spots
Tags
Neighborhood map
What this means for you Summary
Snapshot
- This is a 3-bed/2.0-bath manufactured listed at $325k.
Deal economics
- At list price, monthly cash flow is $970 ($12k/yr) — positive.
- The deal already cash-flows at list — no discount required.
- Meets the 1% rule at list price ($4k rent vs $325k).
- Recommended offer: $286k (12.0% below list) — sets the bar for market timing.
- Cap rate 9.9% vs local median 2.4% in Calistoga — top-decile yield for the area; either an underpriced asset or a hidden risk that comps aren't pricing in. Stress-test before assuming the spread holds.
Location & tenants
- Location reads 63/100 on livability (#448 in CA) — a middle-class / working-renter tenant base. Strengths: health & safety A+, employment A-; Watch: amenities F, commute F, cost of living F.
- Calistoga Joint Unified (town): math 33% / reading 51% proficiency, ranked #624 of 1,400 in CA (top 45%) — families likely to look elsewhere, expect single-tenant / working-renter base with shorter leases.
- Zoned schools: Calistoga Elementary (412 students, 82% FRL); Calistoga Junior/Senior High (380 students, 80% FRL) — zoned schools average 81% FRL vs 58% district-wide (23 pts higher); higher-poverty schools than district average — tighter screening recommended.
- Market conditions: 107 active listings in the ZIP; 3 comparable units currently listed for rent nearby; rentals at typical pace (median 16d on market — plan ~3-4 weeks tenant-placement turnaround); 427 units permitted in Napa County in 2024 (189 in 5+ unit buildings).
Forward outlook
- Local home prices are declining (-3.0%/yr); year-one equity from $2k of loan paydown is wiped out by about $10k of value loss. Plan a longer hold.
- Napa County population projected at +14% by 2050 — modest demand growth; plan on rents tracking national, not racing it.
- At projected returns (-3.0% appreciation + 3.0% rent growth), your $91k cash investment doubles in ~9 years — after that, you're playing with house money.
Negotiation context
- It's been on market 272 days — a 12% lower offer ($286k) is reasonable based on typical stale-listing flexibility.
Risks & watch-outs
- Climate carrying-cost: major wildfire risk — expect insurance premiums to compound above CPI over the hold.
Questions for the listing agent
- It's been on market 272 days. Have you received any prior offers? Is the seller open to a 12% concession, seller financing, or rate buy-down credit?
- Why hasn't it sold? Are there any deal-killer items the seller is aware of (foundation, flood, title, zoning, code violations)?
- Is there a deadline driving the sale (1031 exchange, divorce, estate, relocation)? That informs how much negotiation room exists.
- Schools are D-rated, which usually means shorter tenancies and higher turnover. Who's the typical renter profile here, and what's been the actual vacancy rate?
- What's the average days-on-market for RENTAL listings here right now (not sales)? A rising rental-DOM trend means longer vacancies and softer asking-rent achievability than the comps imply.
- What's the recent tenant-quality profile in this submarket — average credit score on applications, eviction rate, late-payment / NSF rate, and stable-employment percentage? A property-management company in the area should have these aggregated.
- How much new for-sale + rental construction is in the pipeline within 1–3 miles? Heavy new supply typically softens prices + rents 12–24 months out; constrained supply supports both.
Investment metrics
- 1% rule
- 1.12% ✓
- Cap rate
- 9.87%
- Cash-on-cash
- 12.79%
- DSCR
- 1.57
- GRM
- 7.4
CMA / ARV
- ARV (median comp)
- $153,000
- List price
- $325,000
- Delta
- 112.42%
- Verdict
- OVERPRICED
- Comps
- 13 within 1.0 mi
Show comp detail 12 sales within ~0.75 mi
| Address | Dist | Beds/Ba | Sqft | Sold | Price | $/sf | Match |
|---|---|---|---|---|---|---|---|
| 2412 Foothill Blvd #178 | 0.10mi | 2/2.0 (-1) | 1,440 (0%) | 0mo | $290,000 | $201 | 90 |
| 2412 Foothill Blvd #143 | 0.10mi | 2/2.0 (-1) | 1,440 (0%) | 4mo | $116,000 | $81 | 87 |
| 2412 Foothill Blvd #110 | 0.01mi | 2/2.0 (-1) | 1,400 (-3%) | 4mo | $235,000 | $168 | 86 |
| 2412 Foothill Blvd #41 | 0.01mi | 3/2.0 | 1,344 (-7%) | 3mo | $164,000 | $122 | 86 |
| 2412 Foothill Blvd #132 Blvd #132 | 0.10mi | 2/2.0 (-1) | 1,400 (-3%) | 4mo | $290,000 | $207 | 82 |
| 2412 Foothill Blvd #63 | 0.00mi | 2/2.0 (-1) | 1,344 (-7%) | 2mo | $92,500 | $69 | 82 |
| 2412 Foothill Blvd #173 | 0.01mi | 4/2.0 (+1) | 1,332 (-8%) | 1mo | $135,000 | $101 | 81 |
| 2412 Foothill Blvd #15 | 0.01mi | 2/2.0 (-1) | 1,267 (-12%) | 0mo | $208,950 | $165 | 74 |
| 2412 Foothill Blvd #71 | 0.10mi | 2/2.0 (-1) | 1,248 (-13%) | 1mo | $99,900 | $80 | 68 |
| 2412 Foothill Blvd #20 | 0.01mi | 3/2.0 | 1,232 (-14%) | 10mo | $155,000 | $126 | 67 |
| 2412 Foothill Blvd #166 | 0.10mi | 2/2.0 (-1) | 1,248 (-13%) | 3mo | $153,000 | $123 | 65 |
| 2412 Foothill Blvd #12 | 0.10mi | 2/2.0 (-1) | 1,586 (+10%) | 10mo | $167,000 | $105 | 65 |
Match score weights: distance 35% · size 25% · config 20% · recency 20%. Top-matched comps best support the ARV.
Projected returns pro-forma
-3.0% appreciation · 3.0% rent growth · sell at horizon
- IRR
- 2.6%
- Equity multiple
- 1.10×
- Total profit
- $8,944
- Equity at exit
- $48,459
- IRR
- 12.1%
- Equity multiple
- 1.95×
- Total profit
- $86,711
- Equity at exit
- $28,100
Cash invested: $91,000 (down + closing). Projections, not guarantees.
Landlord ↔ Tenant lean methodology
- Overall (STATE)
- 18 Strongly Tenant-Friendly
- State California
- 18 Strongly Tenant-Friendly · D+13
- County
- — inherits STATE
- City
- — inherits STATE
ZIP-level market 94515
- Active inventory
- 107
- Price-to-rent
- 7.4×
Monthly cashflow live
- Estimated rent
- $3,654 medium interval (Pro) →
- Mortgage (P&I)
- −$1,704
- Tax from tax record
- −$78 /mo · $932/yr
- Insurance
- −$135
- HOA
- −$0
- Vacancy / Maint / Mgmt
- −$767
- Net cashflow
- $970
Break-even live
Sensitivity live
| Price | -10% $1,154 | -5% $1,062 | +0% $970 | +5% $878 | +10% $786 |
|---|---|---|---|---|---|
| Rent | -10% $681 | -5% $825 | +0% $970 | +5% $1,114 | +10% $1,258 |
| Rate | -1.0pp $1,133 | -0.5pp $1,052 | base $970 | +0.5pp $885 | +1.0pp $800 |
UW: 25.0% down · 7.5% · 30yr · 1.5% tax · 5.0% vac · 8.0% maint · 8.0% mgmt
Financing live
Cash to close
- Down payment
- $81,250
- Closing costs
- $9,750
- Reserves months
- —
- Total cash needed
- —
Loan-product check · same deal, 3 products live
Conventional
25% down · 7.5% · 30yr
- Down + closing
- —
- Monthly P&I
- —
- Monthly cashflow
- —
- DSCR
- —
- Eligible?
- —
Personal DTI + credit; lowest rate.
DSCR
20% down · 8.5% · 30yr
- Down + closing
- —
- Monthly P&I
- —
- Monthly cashflow
- —
- DSCR
- —
- Eligible?
- —
No personal income docs; deal must DSCR.
Hard money
10% down · 12.0% · 12mo
- Down + closing
- —
- Monthly P&I
- —
- Monthly cashflow
- —
- DSCR
- —
- Eligible?
- —
Short-term bridge; refi at stabilization.
Rent comps 3 comps
| Address | Beds | Baths | Sqft | Rent | $/sqft | DOM | Units | Dist |
|---|---|---|---|---|---|---|---|---|
| 1700 Cedar St Calistoga, CA | 2.0 | 1.0 | 962 | $3,200 | $3.33 | 15d | 1 | 0.43mi |
| 1612 Grant St Calistoga, CA | 3.0 | 2.0 | 1625 | $3,795 | $2.34 | 45d | 1 | 0.68mi |
| 2014 Tablerock Ct Calistoga, CA | 3.0 | 2.0 | 1459 | $4,095 | $2.81 | 15d | 1 | 0.83mi |
Listing history 19 events
-
2026-06-21days on market $325,000 Active 272 DOM
-
2026-06-18days on market $325,000 Active 269 DOM
-
2026-06-17days on market $325,000 Active 268 DOM
-
2026-06-16days on market $325,000 Active 267 DOM
-
2026-06-15days on market $325,000 Active 266 DOM
-
2026-06-14days on market $325,000 Active 264 DOM
-
2026-06-13days on market $325,000 Active 263 DOM
-
2026-06-10days on market $325,000 Active 261 DOM
-
2026-06-09days on market $325,000 Active 260 DOM
-
2026-06-08days on market $325,000 Active 259 DOM
-
2026-06-07days on market $325,000 Active 258 DOM
-
2026-06-05days on market $325,000 Active 255 DOM
-
2026-06-03days on market $325,000 Active 254 DOM
-
2026-06-02days on market $325,000 Active 253 DOM
-
2026-06-01days on market $325,000 Active 252 DOM
-
2026-05-31days on market $325,000 Active 251 DOM
-
2026-05-30days on market $325,000 Active 250 DOM
-
2026-02-04price $325,000 1109-char remark
Show marketing remark (1109 chars)
Welcome to this charming 3-bedroom, 2-bath manufactured home built in 2014, located in the Rancho de Calistoga 55+ community. This move-in ready residence offers a spacious open-concept layout with a well-appointed kitchen featuring a center island, perfect for entertaining or casual dining. Enjoy year-round comfort with central heat and air, and the convenience of an inside laundry area. Step outside to your private outdoor dining area, ideal for morning coffee or evening gatherings. A large outdoor storage shed provides ample space for tools, hobbies, or seasonal items. Rancho de Calistoga offers a wealth of amenities including a clubhouse with a library, game room, and full kitchen, a heated swimming pool, hot tub, barbecue area, and a fully equipped exercise room. RV and boat owners will appreciate the on-site storage facilities, and a scenic community path provides easy access to downtown Calistoga, approximately 1.5 miles away. Don't miss your chance to enjoy relaxed Wine Country living with an abundance of community features in one of Calistoga's most welcoming neighborhoods.
-
2025-09-23$350,000 Active 1109-char remark
Show marketing remark (1109 chars)
Welcome to this charming 3-bedroom, 2-bath manufactured home built in 2014, located in the Rancho de Calistoga 55+ community. This move-in ready residence offers a spacious open-concept layout with a well-appointed kitchen featuring a center island, perfect for entertaining or casual dining. Enjoy year-round comfort with central heat and air, and the convenience of an inside laundry area. Step outside to your private outdoor dining area, ideal for morning coffee or evening gatherings. A large outdoor storage shed provides ample space for tools, hobbies, or seasonal items. Rancho de Calistoga offers a wealth of amenities including a clubhouse with a library, game room, and full kitchen, a heated swimming pool, hot tub, barbecue area, and a fully equipped exercise room. RV and boat owners will appreciate the on-site storage facilities, and a scenic community path provides easy access to downtown Calistoga, approximately 1.5 miles away. Don't miss your chance to enjoy relaxed Wine Country living with an abundance of community features in one of Calistoga's most welcoming neighborhoods.
ⓘ Source: listings_history table (triggers on properties + properties_extension) + one-shot
backfill from property_details.listing_events for pre-trigger history.
Tax reassessment forecast CA · Resets to sale price
- Current annual tax
- $932 · $78/mo
- Projected year-2 tax
- $2,470 · $206/mo
- Expected delta
- +$1,538/yr (+$128/mo · 165.0%)
ⓘ Screening estimate from a state-policy table — verify with the county assessor before closing.
Climate risk First Street
- Flood 1/10 Low FEMA zone X (unshaded) · 0% chance over 30 yrs
- Wildfire 7/10 Severe
- Heat 4/10 Moderate 7 d/yr ≥100°F today · 15 d/yr by 30 yrs out
- Wind 1/10 Low
- Air quality 10/10 Extreme 29 unhealthy d/yr today · 30 by 30 yrs out
Nearby sold comps map
Loading sold comps map…
Walkable amenities ~0.75 mi
Loading nearby amenities…
Taxation est. · year 1
- Rental income
- $43,854
- − Mortgage interest
- −$18,205
- − Property taxes
- −$932
- − Insurance
- −$1,625
- − Repairs & maintenance
- −$3,508
- − Management
- −$3,508
- − Depreciation
- −$9,455
- Taxable income
- $6,620
- Est. tax owed @ 24.0%
- −$1,589
- After-tax cash flow
- $10,046/yr
For passive investors: Depreciation is non-cash, so a rental often shows a tax loss while cash-flowing — sheltering income. Rental losses are passive: they offset passive income freely, and up to $25,000/yr can offset ordinary (W-2) income if you actively participate and your MAGI is under $100k (phasing out to $0 by $150k); unused losses carry forward. On sale, claimed depreciation is recaptured at up to 25%, and gains may owe capital-gains tax (a 1031 exchange can defer both). Figures are a year-1 estimate at your 24.0% rate — not tax advice; consult a CPA.
Schools (NCES district)
- District
- Calistoga Joint Unified
- NCES district ID
- 0607020
- Math proficiency
- 33% ▲ 2.00%
- Reading proficiency
- 51% ▲ 5.00%
- Median HH income
- $60,716
- Composite
- 39.48/100
- National rank
- #8101
- State rank
- #624 of 1400 in CA
Livability — Calistoga
- Score
- 63/100
- State rank
- #448
- US rank
- #15176
Category grades
Schools grade is shown separately in the Schools card above.
Census & demographics
- Census place
- Calistoga, CA
- Population (ZIP)
- 6,921
Population outlook (Napa County) Hauer SSP2
- Today (2025)
- 153,987 people
- By 2030
- 159,490 · +3.6%
- By 2040
- 168,796 · +9.6%
- By 2050
- 176,213 · +14.4%
- By 2075
- 190,113 · +23.5%
- By 2100
- 190,528 · +23.7%
Race, ethnicity, and origin ACS 2023
- Neighborhood character
- Majority White (55%)
- Race & ethnicity
- White 55% Hispanic / Latino 41% Two or more races 18% Asian 2% Black 1%
- Hispanic origin (detail)
- Mexican 38%
- Common ancestry
- Italian 3% Lithuanian 2% Portuguese 2%
- Foreign-born
- 25% · Canada
- Languages at home
- 64% English-only · Spanish 34% Russian/Polish/Slavic 1% French/Haitian/Cajun 1%
Political lean MEDSL · Napa
- 2024 margin
- Solid D (+34.9) · D 65.9% · R 31.1% · Other 3.0%
- 2008→2024 swing
- +2.4pp toward D · 2008: 32.5pp · 2024: 34.9pp
- All cycles
- 2024: D+34.9 2020: D+40.4 2016: D+35.2 2012: D+25.7 2008: D+32.5
Not yet ingested
- Civics
- —
Market trends
- HPI YoY
- ▼ -476.46%
- Current HPI
- 244.6548
- Rent YoY
- —
- Metro
- —
- State GDP YoY
- ▲ 3.21%
- F500 in state
- 116
Industry mix (Fortune 500 HQ in CA)
| Industry | F500 HQs | Revenue |
|---|---|---|
| Technology | 27 | $1,492B |
|
||
| Financial Services | 3 | $174B |
|
||
| Retail | 3 | $44B |
|
||
| Insurance | 3 | $26B |
|
||
| Media / Entertainment | 2 | $115B |
|
||
| Pharmaceuticals / Biotech | 2 | $62B |
|
||
Price history
-7.1% since first listed2 events — show timeline
- 2026-02-04 Price Changed $325,000 BAREIS
- 2025-09-23 Listed $350,000 BAREIS
Property tax history
+1.7%/yrLatest (2025): $932 · +15.6% YoY. Source: county tax records.
Cash-flow waterfall
monthlySold comps — $/sqft
last 12 mo · ≤1 miLoading sold comps…