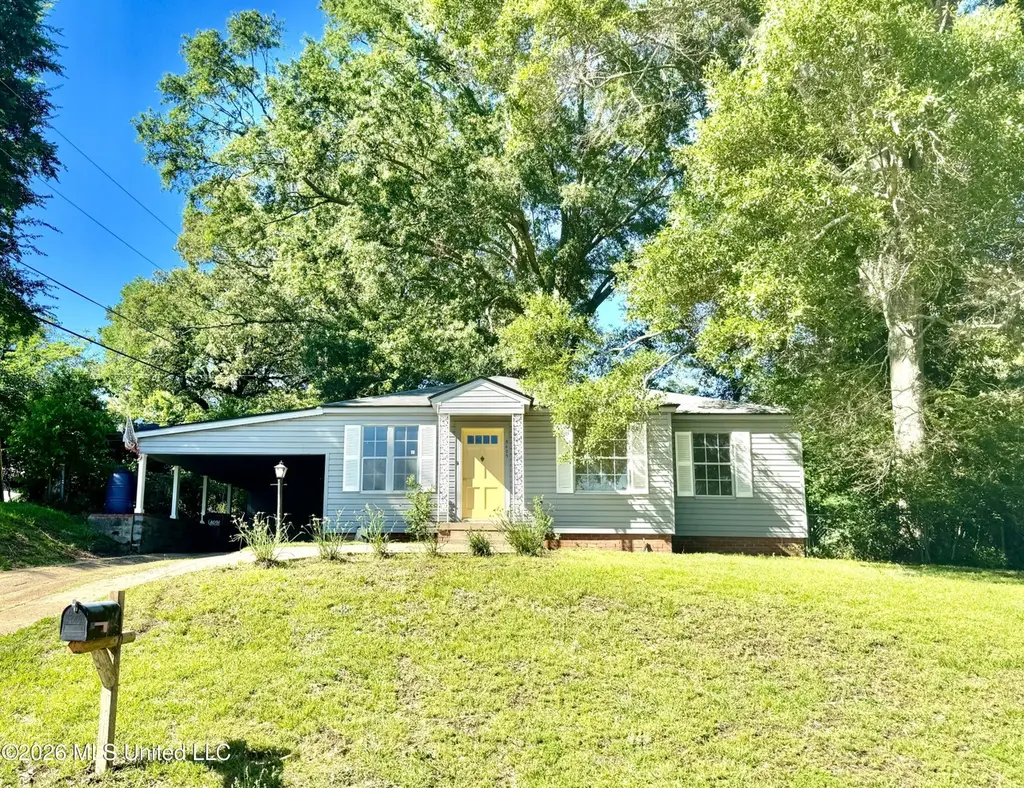
3605 Ridgewood Rd · Natchez, MS
Flood risk 1/10 · Minimal
- FEMA flood zone
- X (unshaded)
- Chance of flooding over 30 yrs
- 0.0%
- Est. flood insurance / yr
- $507 – $1,088
Fire risk 1/10 · Minimal
- Est. fire insurance / yr
- $1,241 – $2,305
Heat risk 7/10 · Major
- Hot days now (above 107°F)
- 7 days/yr
- Hot days in 30 yrs
- 19 days/yr
Wind risk 8/10 · Major
- Chance of severe wind over 30 yrs
- 94.0%
Air-quality risk 1/10 · Minimal
- Unhealthy air days now
- 0 days/yr
- Unhealthy air days in 30 yrs
- 0 days/yr
Risk factors via First Street. Map © Google.
Why this score? — see what drove the C- grade
The composite is a weighted blend of 9 inputs, each scored 0–100. Each bar is that input's sub-score; the figure is the points it added to the 100-point composite (weight × sub-score).
- Cash flow +26.0/30.0
- DSCR +8.7/10.0
- 1% rule +6.3/10.0
- ARV discount +4.2/15.0
- Livability +3.2/5.0
- Rent growth +2.5/5.0
- Condition / age +2.5/5.0
- Schools +1.0/10.0
- Appreciation +0.0/10.0
$115,000
🖨 Deal sheet 📄 Offer letter ✓ Due diligence
Listing remarks
CHARMING & UPDATED IN MONTEBELLO SUBDIVISION! This refreshed 3-bedroom, 1-bath home in desirable Montebello subdivision is move-in ready and full of appeal. Featuring new flooring and fresh neutral paint throughout, the home offers a bright, inviting atmosphere with an abundance of windows that fill the space with natural light. The kitchen has been tastefully updated with beautiful wood countertops, a new electric stove/oven, & a corner stainless steel sink. Attractive cabinetry, including select glass-front doors, adds both style and function. Just off the kitchen, you will find a convenient inside laundry room with shelving. The bathroom includes a vanity, tub/shower combinati
Key facts
- New flooring
- New electric stove
- Fresh neutral paint
Tags
Property features AI
Finance
- HOA & community: Street lights in the community
Exterior
- Parking: Covered carport (1 space); Driveway; Parking pad; Concrete parking
- Utilities: Public water; Public sewer; Electricity connected; Water connected
- Home design: Single family residence (house); One level; Lot approximately 70' x 118'
- Construction: Vinyl exterior; Shingle roof; Pillar/post/pier foundation; Assessor-recorded year built
- Exterior features: Chain link fencing; Storage structure; Workshop; See remarks
Interior
- Kitchen: Electric range; Range hood
- Flooring: Ceramic tile; Laminate
- Bathrooms: 1 full bathroom
- Heating & cooling: Central heating; Central air; Ceiling fan(s)
- Interior features: Bookcases; Ceiling fan(s); Eat-in kitchen; Storage
- Laundry & utility: Laundry room with inside laundry hookups
Neighborhood map
What this means for you Summary
Snapshot
- This is a 3-bed/1.0-bath single-family listed at $115k.
Deal economics
- At list price, monthly cash flow is $285 ($3k/yr) — positive.
- The deal already cash-flows at list — no discount required.
- Meets the 1% rule at list price ($1k rent vs $115k).
- Recommended offer: $113k (1.5% below list) — sets the bar for market timing.
- Cap rate 9.3% vs local median 4.4% in Natchez — top-decile yield for the area; either an underpriced asset or a hidden risk that comps aren't pricing in. Stress-test before assuming the spread holds.
Location & tenants
- Location reads 63/100 on livability (#156 in MS) — a middle-class / working-renter tenant base. Strengths: cost of living A+, crime B, housing B; Watch: health & safety C-, schools F, amenities F.
- Natchez-Adams School District (town): math 8% / reading 19% proficiency, ranked #114 of 130 in MS (top 88%) — low school quality limits family demand, transient renter base, plan for 1-2y turnover; 90% free/reduced lunch — lower-income household profile, screen leases tightly.
- Market conditions: 281 active listings in the ZIP; 6 units permitted in Adams County in 2024 (0 in 5+ unit buildings).
Forward outlook
- Local home prices are declining (-3.0%/yr); year-one equity from $795 of loan paydown is wiped out by about $3k of value loss. Plan a longer hold.
- Adams County population projected at -21% by 2050 — secular population decline; favor cash flow + early exit over multi-decade hold.
Negotiation context
- It's been on market 29 days — a 2% lower offer ($113k) is reasonable based on typical stale-listing flexibility.
- 2 sale attempts since 6y ago with the ask held roughly flat each time — persistent listings suggest the price (not the market) is what's stuck; bring a comps-based counter.
Risks & watch-outs
- Watch-outs: built in 1955 — expect roof / HVAC / electrical / plumbing capex.
- Climate carrying-cost: severe wind risk, 94% chance of damaging wind over 30y; extreme-heat days projected 7→19/yr by 2055 (HVAC capex compounding) — expect insurance premiums to compound above CPI over the hold.
Questions for the listing agent
- Built in 1955 — when were the roof, HVAC, electrical panel, plumbing, and water heater last replaced?
- Is there a deadline driving the sale (1031 exchange, divorce, estate, relocation)? That informs how much negotiation room exists.
- Schools are F-rated, which usually means shorter tenancies and higher turnover. Who's the typical renter profile here, and what's been the actual vacancy rate?
- What's the average days-on-market for RENTAL listings here right now (not sales)? A rising rental-DOM trend means longer vacancies and softer asking-rent achievability than the comps imply.
- What's the recent tenant-quality profile in this submarket — average credit score on applications, eviction rate, late-payment / NSF rate, and stable-employment percentage? A property-management company in the area should have these aggregated.
- How much new for-sale + rental construction is in the pipeline within 1–3 miles? Heavy new supply typically softens prices + rents 12–24 months out; constrained supply supports both.
Investment metrics
- 1% rule
- 1.13% ✓
- Cap rate
- 9.27%
- Cash-on-cash
- 10.62%
- DSCR
- 1.47
- GRM
- 7.3
CMA / ARV
- ARV (median comp)
- $107,081
- List price
- $115,000
- Delta
- 7.40%
- Verdict
- FAIR
- Comps
- 20 within 1.0 mi
Show comp detail 10 sales within ~0.75 mi
| Address | Dist | Beds/Ba | Sqft | Sold | Price | $/sf | Match |
|---|---|---|---|---|---|---|---|
| 811 Kenwood Ln | 0.09mi | 3/1.0 | 1,005 (+6%) | 3mo | $105,000 | $104 | 84 |
| 1301 Westwood Rd | 0.27mi | 3/1.0 | 965 (+2%) | 2mo | $109,000 | $113 | 83 |
| 12 Maplewood Ln | 0.28mi | 2/1.0 (-1) | 912 (-4%) | 1mo | $99,500 | $109 | 74 |
| 25 Maplewood Ln | 0.34mi | 2/1.0 (-1) | 951 (+0%) | 19mo | $95,000 | $100 | 63 |
| 1501 Eastwood Rd | 0.43mi | 2/1.0 (-1) | 897 (-6%) | 5mo | $54,500 | $61 | 61 |
| 209 Holly Dr | 0.16mi | 2/1.0 (-1) | 1,032 (+9%) | 20mo | $109,500 | $106 | 56 |
| 19 Beechwood Ln | 0.40mi | 2/1.0 (-1) | 873 (-8%) | 12mo | $69,500 | $80 | 52 |
| 8 Oakwood Ln | 0.31mi | 2/1.0 (-1) | 1,076 (+13%) | 13mo | $99,000 | $92 | 47 |
| 1306 Eastwood Rd | 0.35mi | 2/2.0 (-1) | 1,061 (+12%) | 12mo | $90,000 | $85 | 45 |
| 7 Maplewood Ln | 0.25mi | 2/1.0 (-1) | 825 (-13%) | 21mo | $110,000 | $133 | 44 |
Match score weights: distance 35% · size 25% · config 20% · recency 20%. Top-matched comps best support the ARV.
Projected returns pro-forma
-3.0% appreciation · 3.0% rent growth · sell at horizon
- IRR
- -0.4%
- Equity multiple
- 0.98×
- Total profit
- $-499
- Equity at exit
- $17,147
- IRR
- 9.3%
- Equity multiple
- 1.71×
- Total profit
- $22,889
- Equity at exit
- $9,943
Cash invested: $32,200 (down + closing). Projections, not guarantees.
Landlord ↔ Tenant lean methodology
- Overall (STATE)
- 90 Strongly Landlord-Friendly
- State Mississippi
- 90 Strongly Landlord-Friendly · R+11
- County
- — inherits STATE
- City
- — inherits STATE
ZIP-level market 39120
- Active inventory
- 281
- Price-to-rent
- 7.3×
Monthly cashflow live
- Estimated rent
- $1,304 medium interval (Pro) →
- Mortgage (P&I)
- −$603
- Tax from tax record
- −$94 /mo · $1,131/yr
- Insurance
- −$48
- HOA
- −$0
- Vacancy / Maint / Mgmt
- −$274
- Net cashflow
- $285
Break-even live
UW: 25.0% down · 7.5% · 30yr · 1.5% tax · 5.0% vac · 8.0% maint · 8.0% mgmt
Financing live
Cash to close
- Down payment
- $28,750
- Closing costs
- $3,450
- Reserves months
- —
- Total cash needed
- —
Loan-product check · same deal, 3 products live
Conventional
25% down · 7.5% · 30yr
- Down + closing
- —
- Monthly P&I
- —
- Monthly cashflow
- —
- DSCR
- —
- Eligible?
- —
Personal DTI + credit; lowest rate.
DSCR
20% down · 8.5% · 30yr
- Down + closing
- —
- Monthly P&I
- —
- Monthly cashflow
- —
- DSCR
- —
- Eligible?
- —
No personal income docs; deal must DSCR.
Hard money
10% down · 12.0% · 12mo
- Down + closing
- —
- Monthly P&I
- —
- Monthly cashflow
- —
- DSCR
- —
- Eligible?
- —
Short-term bridge; refi at stabilization.
Listing history 5 events
-
2026-06-02status $115,000 Pending 29 DOM
-
2026-06-01days on market $115,000 Active 29 DOM
-
2026-05-31days on market $115,000 Active 28 DOM
-
2026-05-02$115,000 Active 1318-char remark
-
2020-07-28$72,000
ⓘ Source: listings_history table (triggers on properties + properties_extension) + one-shot
backfill from property_details.listing_events for pre-trigger history.
Tax reassessment forecast MS · Resets to sale price
- Current annual tax
- $1,131 · $94/mo
- Projected year-2 tax
- $1,131 · $94/mo
- Expected delta
- $0/yr ($0/mo · 0.0%)
ⓘ Screening estimate from a state-policy table — verify with the county assessor before closing.
Climate risk First Street
- Flood 1/10 Low FEMA zone X (unshaded) · 0% chance over 30 yrs
- Wildfire 1/10 Low
- Heat 7/10 Severe 7 d/yr ≥107°F today · 19 d/yr by 30 yrs out
- Wind 8/10 Severe 94% chance of damaging wind over 30 yrs
- Air quality 1/10 Low 0 unhealthy d/yr today · 0 by 30 yrs out
Nearby sold comps map
Loading sold comps map…
Walkable amenities ~0.75 mi
Loading nearby amenities…
Taxation est. · year 1
- Rental income
- $15,648
- − Mortgage interest
- −$6,442
- − Property taxes
- −$1,131
- − Insurance
- −$575
- − Repairs & maintenance
- −$1,252
- − Management
- −$1,252
- − Depreciation
- −$3,345
- Taxable income
- $1,651
- Est. tax owed @ 24.0%
- −$396
- After-tax cash flow
- $3,023/yr
For passive investors: Depreciation is non-cash, so a rental often shows a tax loss while cash-flowing — sheltering income. Rental losses are passive: they offset passive income freely, and up to $25,000/yr can offset ordinary (W-2) income if you actively participate and your MAGI is under $100k (phasing out to $0 by $150k); unused losses carry forward. On sale, claimed depreciation is recaptured at up to 25%, and gains may owe capital-gains tax (a 1031 exchange can defer both). Figures are a year-1 estimate at your 24.0% rate — not tax advice; consult a CPA.
Schools (NCES district)
- District
- Natchez-Adams School District
- NCES district ID
- 2803030
- Math proficiency
- 8% ▼ -16.00%
- Reading proficiency
- 19% ▼ -5.00%
- Median HH income
- $28,288
- Composite
- 10.41/100
- National rank
- #9785
- State rank
- #114 of 130 in MS
Livability — Natchez
- Score
- 63/100
- State rank
- #156
- US rank
- #15334
Category grades
Schools grade is shown separately in the Schools card above.
Census & demographics
- Census place
- Natchez, MS
- Population (ZIP)
- 29,212
Population outlook (Adams County) Hauer SSP2
- Today (2025)
- 28,614 people
- By 2030
- 27,405 · -4.2%
- By 2040
- 24,914 · -12.9%
- By 2050
- 22,554 · -21.2%
- By 2075
- 17,096 · -40.3%
- By 2100
- 12,156 · -57.5%
Race, ethnicity, and origin ACS 2023
- Neighborhood character
- Diverse neighborhood (Simpson 0.55)
- Race & ethnicity
- Black 56% White 37% Hispanic / Latino 4% Two or more races 2%
- Common ancestry
- Lithuanian 2% Slovak 1% Serbian 1%
- Foreign-born
- 5% · Canada
- Languages at home
- 94% English-only · Spanish 4% Other Asian/Pacific 1%
Political lean MEDSL · Adams
- 2024 margin
- D (+13.9) · D 56.5% · R 42.6%
- 2008→2024 swing
- -1.7pp toward R · 2008: 15.6pp · 2024: 13.9pp
- All cycles
- 2024: D+13.9 2020: D+16.1 2016: D+14.7 2012: D+18.0 2008: D+15.6
Not yet ingested
- Civics
- —
Market trends
- HPI YoY
- ▼ -93.67%
- Current HPI
- 112.2371
- Rent YoY
- —
- Metro
- —
- State GDP YoY
- —
- F500 in state
- 0
Price history
+59.7% since first listed3 events — show timeline
- 2026-06-02 Pending — MLSU
- 2026-05-02 Listed $115,000 MLSU
- 2020-07-28 Listed $72,000 MLSU
Property tax history
-19.0%/yrLatest (2021): $1,131 · -19.0% YoY. Source: county tax records.
Cash-flow waterfall
monthlySold comps — $/sqft
last 12 mo · ≤1 miLoading sold comps…