 Triplex
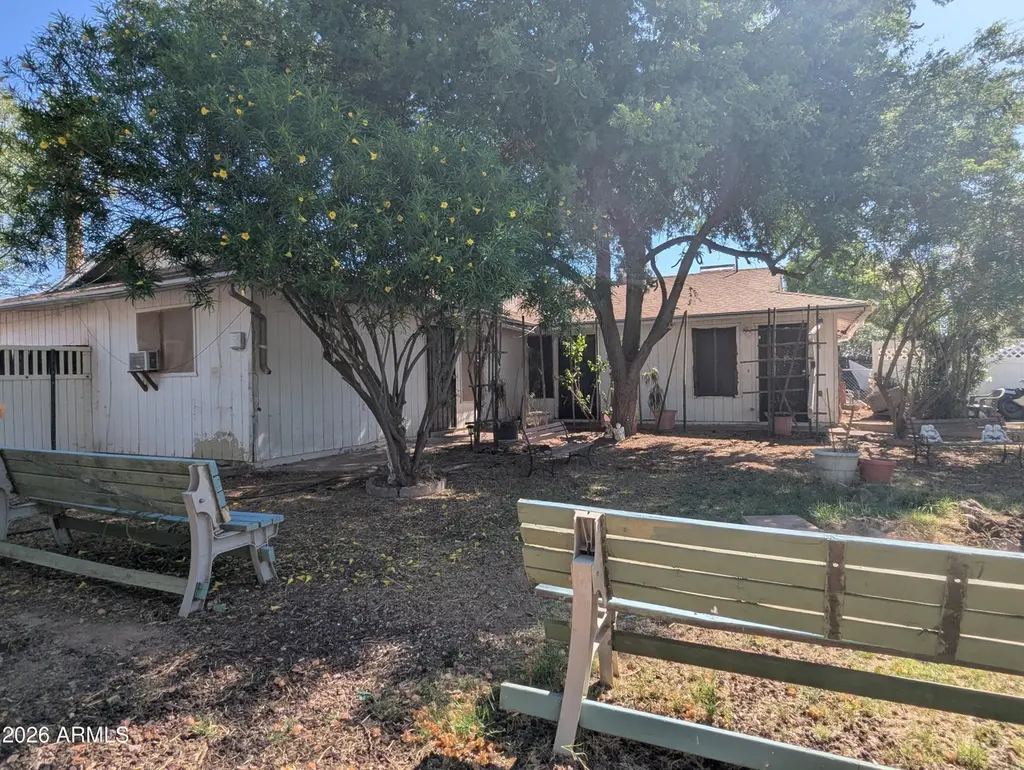
428 E Osage Ave · Apache Junction, AZ
Flood risk 1/10 · Minimal
- FEMA flood zone
- X (shaded)
- Chance of flooding over 30 yrs
- 0.0%
- Est. flood insurance / yr
- $507 – $1,088
Fire risk 5/10 · Moderate
- Est. fire insurance / yr
- $610 – $1,132
Heat risk 9/10 · Severe
- Hot days now (above 111°F)
- 7 days/yr
- Hot days in 30 yrs
- 19 days/yr
Wind risk 1/10 · Minimal
- Chance of severe wind over 30 yrs
- —
Air-quality risk 3/10 · Minor
- Unhealthy air days now
- 3 days/yr
- Unhealthy air days in 30 yrs
- 4 days/yr
Risk factors via First Street. Map © Google.
Why this score? — see what drove the D grade
The composite is a weighted blend of 9 inputs, each scored 0–100. Each bar is that input's sub-score; the figure is the points it added to the 100-point composite (weight × sub-score).
- Cash flow +18.0/30.0
- ARV discount +7.5/15.0
- DSCR +5.6/10.0
- 1% rule +3.5/10.0
- Livability +3.3/5.0
- Rent growth +2.9/5.0
- Condition / age +2.5/5.0
- Schools +1.5/10.0
- Appreciation +0.0/10.0
$465,000
🖨 Deal sheet (PDF) 📄 Offer letter ✓ Due diligence
Multi-family units
County records classify this as Multi-Family (2-4 Unit). Listing-text estimate: 3 units. confirmed
Listing remarks
Now's your chance to own a solid triplex in a high demand area! Two units have its own adorable honeycomb fireplace & all have W/ D hookup, and spacious, fenced private yards. Roof is newer (installed in 2022) and A/C's are newer. One unit is 2 bed, 1 bath, One is 2 bed, 2 bath, and the third unit is 1 bed, 1 bath (all occupied). This property offers a strong value-add opportunity through both interior and exterior renovations. Each unit is equipped with its own washer/dryer hookup, and the property is individually metered for electricity. Owner is also selling a similar Triplex next door (404 E. Osage - MLS 7016776) and would love to sell them together, if possible, but it's not a d
Key facts
- Newer a c
- Newer roof
- Honeycomb fireplace
Tags
Property features AI
Exterior
- Parking: 3 total parking spaces; 3 open parking spaces; On-street parking
- Utilities: SRP electric; Public sewer; City franchise water
- Home design: Fee simple ownership
- Construction: Board and batten siding; Wood frame construction; Composition roof; 1 building
- Exterior features: Asphalt road access; No community pool
Interior
- Kitchen: Refrigerator; Free-standing electric oven
- Flooring: Tile
- Heating & cooling: Central air; Ceiling fans; Electric heating
- Interior features: Washer/dryer hookup
- Laundry & utility: Washer/dryer hookup
Neighborhood map
What this means for you Summary
Snapshot
- This is a 1×2bd/1ba + 1×2bd/2ba + 1×1bd/1ba units multifamily listed at $465k.
Deal economics
- At list price, monthly cash flow is $402 ($5k/yr) — positive. Per door: $134/mo.
- The deal already cash-flows at list — no discount required.
- To meet the 1% rule (rent ≥ 1% of price), the offer needs to be $396k (14.9% below list).
- Recommended offer: $396k (14.9% below list) — sets the bar for 1% rule.
- Cap rate 7.3% vs local median 3.5% in Apache Junction — top-decile yield for the area; either an underpriced asset or a hidden risk that comps aren't pricing in. Stress-test before assuming the spread holds.
Location & tenants
- Location reads 66/100 on livability (#70 in AZ) — a middle-class / working-renter tenant base. Strengths: cost of living A+, housing A+; Watch: crime D+, amenities F, commute F.
- Apache Junction Unified District (4443) (suburban): math 15% / reading 20% proficiency, ranked #195 of 249 in AZ (top 78%) — low school quality limits family demand, transient renter base, plan for 1-2y turnover.
- Zoned schools: Desert Vista Elementary School (math 18% / reading 23%, grade F, #729 of 1,109 statewide, top 67%, 536 students, 50% FRL); Cactus Canyon Junior High (math 14% / reading 19%, grade F, #151 of 218 statewide, top 70%, 702 students, 50% FRL); Apache Junction High School (math 12% / reading 17%, grade F, #267 of 381 statewide, top 72%, 999 students, 48% FRL) — zoned schools at 49% FRL track the district average.
- Market conditions: Rents rising (+1.6%/yr); 354 active listings in the ZIP; 5 comparable units currently listed for rent nearby; rentals leasing fast (median 6d on market — plan ~1-2 weeks tenant-placement turnaround); 9,504 units permitted in Pinal County in 2024 (776 in 5+ unit buildings).
- At $3,956/mo this rent would consume 66% of the median local household income ($72k/yr) (locally 305% of renters already pay >50% of income on rent) — very limited rent-growth headroom before tenants either downsize or default.
Forward outlook
- Local home prices are declining (-3.0%/yr); year-one equity from $3k of loan paydown is wiped out by about $14k of value loss. Plan a longer hold.
Negotiation context
- It's been on market 23 days — a 2% lower offer ($458k) is reasonable based on typical stale-listing flexibility.
- Current owner paid $52k; list at $465k implies a 794% gain — meaningful room to come down on a strong offer.
Risks & watch-outs
- Climate carrying-cost: moderate wildfire risk; extreme-heat days projected 7→19/yr by 2055 (HVAC capex compounding) — expect insurance premiums to compound above CPI over the hold.
Questions for the listing agent
- Can we see the unit-by-unit rent roll, current vacancy, and any below-market leases? What's the average tenancy length?
- What capital expenditures (roof, boiler, parking lot, exteriors) have been made in the last 5 years, and what's planned in the next 2?
- Is there a deadline driving the sale (1031 exchange, divorce, estate, relocation)? That informs how much negotiation room exists.
- Schools are F-rated, which usually means shorter tenancies and higher turnover. Who's the typical renter profile here, and what's been the actual vacancy rate?
- Crime grade is D in this area — have there been break-ins, vandalism, or insurance claims at this property in the last 3 years? What carrier currently insures it and at what premium?
- The area grade is low — what's the realistic commute time and amenity access for the typical tenant pool here? Any planned neighborhood developments (good or bad) we should know about?
- What's the average days-on-market for RENTAL listings here right now (not sales)? A rising rental-DOM trend means longer vacancies and softer asking-rent achievability than the comps imply.
- What's the recent tenant-quality profile in this submarket — average credit score on applications, eviction rate, late-payment / NSF rate, and stable-employment percentage? A property-management company in the area should have these aggregated.
- How much new apartment / multifamily construction is in the pipeline within 1–3 miles? Heavy new supply (>2% of stock underway) typically softens rents 12–24 months out; light construction supports rent growth.
Investment metrics
- 1% rule
- 0.85% ✗
- Cap rate
- 7.33%
- Cash-on-cash
- 3.70%
- DSCR
- 1.16
- GRM
- 9.8
CMA / ARV
No comps found within radius.
Projected returns pro-forma
-3.0% appreciation · 1.57% rent growth · sell at horizon
- IRR
- -12.0%
- Equity multiple
- 0.57×
- Total profit
- $-55,616
- Equity at exit
- $69,333
- IRR
- -4.8%
- Equity multiple
- 0.70×
- Total profit
- $-38,837
- Equity at exit
- $40,205
Cash invested: $130,200 (down + closing). Projections, not guarantees.
Landlord ↔ Tenant lean methodology
- Overall (STATE)
- 87 Strongly Landlord-Friendly
- State Arizona
- 87 Strongly Landlord-Friendly · R+3
- County
- — inherits STATE
- City
- — inherits STATE
ZIP-level market 85119
- Home prices YoY
- -33.5%
- Rents YoY
- 1.6%
- Active inventory
- 354
- Price-to-rent
- 28.7×
Monthly cashflow live
- Estimated rent
- $3,956 high interval (Pro) →
- Mortgage (P&I)
- −$2,439
- Tax from tax record
- −$91 /mo · $1,095/yr
- Insurance
- −$194
- HOA
- −$0
- Vacancy / Maint / Mgmt
- −$831
- Net cashflow
- $402
Break-even live
Sensitivity live
| Price | -10% $665 | -5% $533 | +0% $402 | +5% $270 | +10% $139 |
|---|---|---|---|---|---|
| Rent | -10% $89 | -5% $245 | +0% $402 | +5% $558 | +10% $714 |
| Rate | -1.0pp $636 | -0.5pp $520 | base $402 | +0.5pp $281 | +1.0pp $159 |
3-unit breakdown (identical units grouped — click to expand)
| Units | Beds | Baths | Est. rent |
|---|---|---|---|
| 1× unit | 2 | 1 | $1,352 |
| 1× unit | 2 | 2 | $1,352 |
| 1× unit | 1 | 1 | $1,252 |
| Total (3 units) | $3,956 | ||
UW: 25.0% down · 7.5% · 30yr · 1.5% tax · 5.0% vac · 8.0% maint · 8.0% mgmt
Financing live
Cash to close
- Down payment
- $116,250
- Closing costs
- $13,950
- Reserves months
- —
- Total cash needed
- —
Loan-product check · same deal, 3 products live
Conventional
25% down · 7.5% · 30yr
- Down + closing
- —
- Monthly P&I
- —
- Monthly cashflow
- —
- DSCR
- —
- Eligible?
- —
Personal DTI + credit; lowest rate.
DSCR
20% down · 8.5% · 30yr
- Down + closing
- —
- Monthly P&I
- —
- Monthly cashflow
- —
- DSCR
- —
- Eligible?
- —
No personal income docs; deal must DSCR.
Hard money
10% down · 12.0% · 12mo
- Down + closing
- —
- Monthly P&I
- —
- Monthly cashflow
- —
- DSCR
- —
- Eligible?
- —
Short-term bridge; refi at stabilization.
Rent comps 5 comps
| Address | Beds | Baths | Sqft | Rent | $/sqft | DOM | Units | Dist |
|---|---|---|---|---|---|---|---|---|
| 1807 E 36th Ave Apache Junction, AZ | 3.0 | 2.5 | 2261 | $3,175 | $1.40 | 24d | 1 | 1.26mi |
| 3277 S Chaparral Rd Apache Junction, AZ | 3.0 | 2.5 | 1614 | $1,770 | $1.10 | 4d | 1 | 1.26mi |
| 3478 S Chaparral Rd Apache Junction, AZ | 3.0 | 2.5 | 1614 | $1,850 | $1.15 | 5d | 1 | 1.30mi |
| 2213 E 35th Ave Apache Junction, AZ | 3.0 | 2.5 | 2332 | $2,385 | $1.02 | 3d | 1 | 1.43mi |
| 2217 E 35th Ave Apache Junction, AZ | 3.0 | 2.5 | 2260 | $2,010 | $0.89 | 13d | 1 | 1.43mi |
Listing history 3 events
-
2026-05-13status Pending
-
2026-04-20$465,000 Active
-
1989-06-20soldstatus $52,000
ⓘ Source: listings_history table (triggers on properties + properties_extension) + one-shot
backfill from property_details.listing_events for pre-trigger history.
Tax reassessment forecast AZ · Resets to sale price
- Current annual tax
- $1,095 · $91/mo
- Projected year-2 tax
- $3,069 · $256/mo
- Expected delta
- +$1,974/yr (+$165/mo · 180.4%)
ⓘ Screening estimate from a state-policy table — verify with the county assessor before closing.
Climate risk First Street
- Flood 1/10 Low FEMA zone X (shaded) · 0% chance over 30 yrs
- Wildfire 5/10 Major
- Heat 9/10 Extreme 7 d/yr ≥111°F today · 19 d/yr by 30 yrs out
- Wind 1/10 Low
- Air quality 3/10 Moderate 3 unhealthy d/yr today · 4 by 30 yrs out
Nearby sold comps map
Loading sold comps map…
Walkable amenities ~0.75 mi
Loading nearby amenities…
Taxation est. · year 1
- Rental income
- $47,472
- − Mortgage interest
- −$26,047
- − Property taxes
- −$1,095
- − Insurance
- −$2,325
- − Repairs & maintenance
- −$3,798
- − Management
- −$3,798
- − Depreciation
- −$13,527
- Taxable loss
- −$3,118
- Est. tax savings @ 24.0%
- +$748
- After-tax cash flow
- $5,569/yr
For passive investors: Depreciation is non-cash, so a rental often shows a tax loss while cash-flowing — sheltering income. Rental losses are passive: they offset passive income freely, and up to $25,000/yr can offset ordinary (W-2) income if you actively participate and your MAGI is under $100k (phasing out to $0 by $150k); unused losses carry forward. On sale, claimed depreciation is recaptured at up to 25%, and gains may owe capital-gains tax (a 1031 exchange can defer both). Figures are a year-1 estimate at your 24.0% rate — not tax advice; consult a CPA.
Schools (NCES district)
- District
- Apache Junction Unified District (4443)
- NCES district ID
- 0400790
- Math proficiency
- 15% ▼ -17.00%
- Reading proficiency
- 20% ▼ -13.00%
- Median HH income
- $44,930
- Composite
- 15.34/100
- National rank
- #9325
- State rank
- #195 of 249 in AZ
Livability — Apache Junction
- Score
- 66/100
- State rank
- #70
- US rank
- #11242
Category grades
Schools grade is shown separately in the Schools card above.
Census & demographics
- Census place
- Apache Junction, AZ
- County
- Pinal County · 399,947 people
- City population
- 56,611
- Metro
- Phoenix-Mesa-Chandler, AZ
- Population (ZIP)
- 25,420
- Household income
- $71,585
- Rent vs Own
- Severe rent burden
- 305.0
Population outlook (Pinal County) Hauer SSP2
- Today (2025)
- 437,574 people
- By 2030
- 446,903 · +2.1%
- By 2040
- 452,589 · +3.4%
- By 2050
- 444,126 · +1.5%
- By 2075
- 430,300 · -1.7%
- By 2100
- 393,536 · -10.1%
Race, ethnicity, and origin ACS 2023
- Neighborhood character
- Predominantly White (74%)
- Race & ethnicity
- White 74% Hispanic / Latino 19% Two or more races 12% Black 2% Asian 1%
- Hispanic origin (detail)
- Mexican 17%
- Common ancestry
- Slovak 5% Portuguese 3% Lithuanian 3%
- Foreign-born
- 8% · Canada
- Languages at home
- 87% English-only · Spanish 11%
Political lean MEDSL · Pinal
- 2024 margin
- Strong R (+22.1) · D 38.5% · R 60.6%
- 2008→2024 swing
- -7.6pp toward R · 2008: -14.5pp · 2024: -22.1pp
- All cycles
- 2024: R+22.1 2020: R+17.3 2016: R+19.3 2012: R+17.1 2008: R+14.5
Not yet ingested
- Civics
- —
Market trends
- HPI YoY
- ▼ -138.19%
- Current HPI
- 274.3808
- Rent YoY
- ▲ 1.57%
- Metro
- Phoenix-Mesa-Chandler, AZ
- State GDP YoY
- ▲ 4.54%
- F500 in state
- 20
Industry mix (Fortune 500 HQ in AZ)
| Industry | F500 HQs | Revenue |
|---|---|---|
| Technology | 2 | $13B |
|
||
| Mining / Metals | 1 | $23B |
|
||
| Environmental Services | 1 | $16B |
|
||
| Metals / Steel | 1 | $14B |
|
||
| Technology Distribution | 1 | $9B |
|
||
| Homebuilding | 1 | $8B |
|
||
Price history
+794.2% since first listed3 events — show timeline
- 2026-05-13 Pending — ARMLS
- 2026-04-20 Listed $465,000 ARMLS
- 1989-06-20 Sold (Public Records) $52,000 Public Records
Property tax history
-1.7%/yrLatest (2025): $1,095 · +3.6% YoY. Source: county tax records.
Cash-flow waterfall
monthlySold comps — $/sqft
last 12 mo · ≤1 miLoading sold comps…