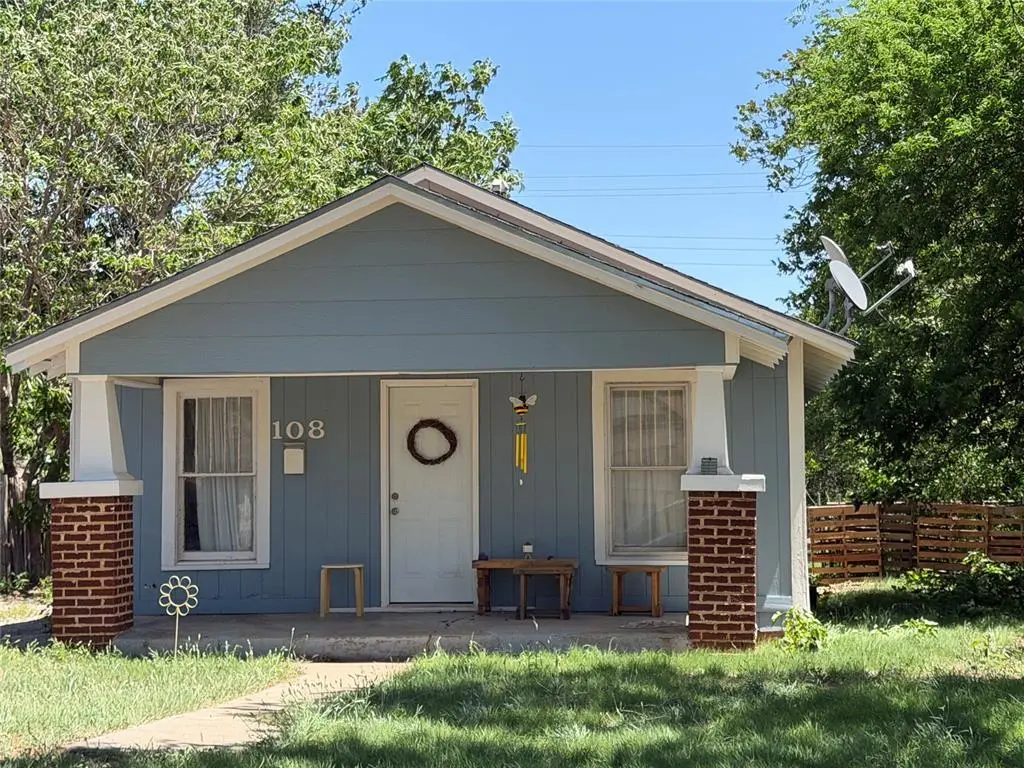
108 N Hitchcock St · Hobart, OK
Flood risk No data
- FEMA flood zone
- —
- Chance of flooding over 30 yrs
- —
- Est. flood insurance / yr
- —
Fire risk No data
- Est. fire insurance / yr
- —
Heat risk No data
- Hot days now (above threshold)
- —
- Hot days in 30 yrs
- —
Wind risk No data
- Chance of severe wind over 30 yrs
- —
Air-quality risk No data
- Unhealthy air days now
- —
- Unhealthy air days in 30 yrs
- —
Risk factors via First Street. Map © Google.
Why this score? — see what drove the B grade
The composite is a weighted blend of 9 inputs, each scored 0–100. Each bar is that input's sub-score; the figure is the points it added to the 100-point composite (weight × sub-score).
- Cash flow +29.4/30.0
- DSCR +10.0/10.0
- Appreciation +10.0/10.0
- ARV discount +7.5/15.0
- 1% rule +7.2/10.0
- Livability +2.7/5.0
- Rent growth +2.5/5.0
- Condition / age +2.5/5.0
- Schools +2.1/10.0
$80,000
🖨 Deal sheet 📄 Offer letter ✓ Due diligence
Listing remarks MLS
Calling all investors! This home is located right in the heart of Hobart. Needs extensive repairs. This is a package deal consisting of 9 properties. MLS #s : 1118783, 1118781, 1118778, 1118775, 1118774, 1118773, 1118771, 1118765, 1118755. Total price for all 9 properties $220K
Key facts
- 7,000 sq ft lot
- Built 1920
- Listed 13 days
Property features AI
Finance
- Other: Homestead not indicated; Property is vacant (not occupied)
- Financial info: Loan qualification available; Not assumable
- HOA & community: No mandatory association dues
Exterior
- Home design: Single family residence; One story; Residential property; Existing property
- Construction: Frame construction; Composition roof; Combination foundation; Built as part of Hills Hobart addition; Historically designated
- Exterior features: Covered porch; Interior lot
Interior
- Bedrooms: 3 bedrooms
- Bathrooms: 1 full bathroom
- Interior features: One living area; No fireplace
Neighborhood map
What this means for you Summary
Snapshot
- This is a 2-bed/1.0-bath single-family listed at $80k.
Deal economics
- At list price, monthly cash flow is $284 ($3k/yr) — positive.
- The deal already cash-flows at list — no discount required.
- Meets the 1% rule at list price ($972 rent vs $80k).
- Cap rate 10.6% vs local median 8.3% in Hobart — meaningfully above typical; check what's discounted (condition, days-on-market, listing class) to confirm the premium yield is real.
Location & tenants
- Location reads 53/100 on livability (#627 in OK) — a working-class tenant base; expect higher turnover. Strengths: cost of living A+; Watch: crime D+, amenities F, commute F.
- Hobart (town): math 23% / reading 28% proficiency, ranked #110 of 270 in OK (top 41%) — low school quality limits family demand, transient renter base, plan for 1-2y turnover; 63% free/reduced lunch — lower-income household profile, screen leases tightly.
- Zoned schools: Hobart Es (math 32% / reading 27%, grade F, #255 of 845 statewide, top 35%, 366 students, 0% FRL); Hobart Hs (math 5% / reading 24%, grade F, #332 of 447 statewide, top 78%, 197 students, 0% FRL) — zoned schools average 0% FRL vs 63% district-wide (63 pts lower); this property's tenant base skews higher-income than the district average.
- Market conditions: 52 active listings in the ZIP.
Forward outlook
- In year one you build about $9k of equity ($553 loan paydown + $8k appreciation (10.0% local appreciation)).
- At projected returns (10.0% appreciation + 3.0% rent growth), your $22k cash investment doubles in ~2 years — after that, you're playing with house money.
- By year 4, paydown + projected appreciation supports a ~$30k cash-out refi (75% LTV) — recoverable capital for the next deal without selling this one.
Negotiation context
- Only 13 days on market — expect competitive offers; lowballing is unlikely to land.
- 4 sale attempts since 2y ago with the ask held roughly flat each time — persistent listings suggest the price (not the market) is what's stuck; bring a comps-based counter.
- Current owner paid $12k; list at $80k implies a 586% gain — meaningful room to come down on a strong offer.
Risks & watch-outs
- Watch-outs: built in 1920 — expect roof / HVAC / electrical / plumbing capex.
Questions for the listing agent
- Built in 1920 — when were the roof, HVAC, electrical panel, plumbing, and water heater last replaced?
- Is there a deadline driving the sale (1031 exchange, divorce, estate, relocation)? That informs how much negotiation room exists.
- Schools are F-rated, which usually means shorter tenancies and higher turnover. Who's the typical renter profile here, and what's been the actual vacancy rate?
- Crime grade is D in this area — have there been break-ins, vandalism, or insurance claims at this property in the last 3 years? What carrier currently insures it and at what premium?
- What's the average days-on-market for RENTAL listings here right now (not sales)? A rising rental-DOM trend means longer vacancies and softer asking-rent achievability than the comps imply.
- What's the recent tenant-quality profile in this submarket — average credit score on applications, eviction rate, late-payment / NSF rate, and stable-employment percentage? A property-management company in the area should have these aggregated.
- How much new for-sale + rental construction is in the pipeline within 1–3 miles? Heavy new supply typically softens prices + rents 12–24 months out; constrained supply supports both.
Investment metrics
- 1% rule
- 1.22% ✓
- Cap rate
- 10.55%
- Cash-on-cash
- 15.21%
- DSCR
- 1.68
- GRM
- 6.9
CMA / ARV
- ARV (on-the-fly)
- $18,258
- Comps found
- 9
Show comp detail 9 sales within ~0.75 mi
| Address | Dist | Beds/Ba | Sqft | Sold | Price | $/sf | Match |
|---|---|---|---|---|---|---|---|
| 306 N Hitchcock St | 0.16mi | 3/1.0 (+1) | 1,080 (+1%) | 14mo | $37,000 | $34 | 75 |
| 329 N Bailey St | 0.23mi | 3/2.0 (+1) | 1,132 (+5%) | 4mo | $70,000 | $62 | 68 |
| 400 N Stephens St | 0.27mi | 2/1.5 | 1,123 (+5%) | 13mo | $109,500 | $98 | 67 |
| 302 N Hill St | 0.25mi | 2/1.0 | 1,104 (+3%) | 20mo | $18,666 | $17 | 67 |
| 108 N Hitchcock | 0.00mi | 2/1.0 | 956 (-11%) | 20mo | $11,666 | $12 | 65 |
| 416 S Hill St | 0.41mi | 2/1.0 | 1,188 (+11%) | 20mo | $16,666 | $14 | 46 |
| 200 S Pueblo Ave | 0.25mi | 3/2.0 (+1) | 1,232 (+15%) | 19mo | $100,000 | $81 | 39 |
| 109 N Lincoln St | 0.65mi | 3/1.5 (+1) | 1,000 (-7%) | 15mo | $13,900 | $14 | 39 |
| 109 S Lincoln St | 0.66mi | 2/1.0 | 968 (-10%) | 20mo | $16,666 | $17 | 36 |
Match score weights: distance 35% · size 25% · config 20% · recency 20%. Top-matched comps best support the ARV.
Projected returns pro-forma
10.0% appreciation · 3.0% rent growth · sell at horizon
- IRR
- 35.5%
- Equity multiple
- 3.75×
- Total profit
- $61,620
- Equity at exit
- $72,070
- IRR
- 30.6%
- Equity multiple
- 8.46×
- Total profit
- $167,190
- Equity at exit
- $155,422
Cash invested: $22,400 (down + closing). Projections, not guarantees.
Landlord ↔ Tenant lean methodology
- Overall (STATE)
- 83 Strongly Landlord-Friendly
- State Oklahoma
- 83 Strongly Landlord-Friendly · R+20
- County
- — inherits STATE
- City
- — inherits STATE
ZIP-level market 73651
- Home prices YoY
- 8.0%
- Active inventory
- 52
- Price-to-rent
- 6.9×
Monthly cashflow live
- Estimated rent
- $972 medium interval (Pro) →
- Mortgage (P&I)
- −$420
- Tax from tax record
- −$31 /mo · $376/yr
- Insurance
- −$33
- HOA
- −$0
- Vacancy / Maint / Mgmt
- −$204
- Net cashflow
- $284
Break-even live
UW: 25.0% down · 7.5% · 30yr · 1.5% tax · 5.0% vac · 8.0% maint · 8.0% mgmt
Financing live
Cash to close
- Down payment
- $20,000
- Closing costs
- $2,400
- Reserves months
- —
- Total cash needed
- —
Loan-product check · same deal, 3 products live
Conventional
25% down · 7.5% · 30yr
- Down + closing
- —
- Monthly P&I
- —
- Monthly cashflow
- —
- DSCR
- —
- Eligible?
- —
Personal DTI + credit; lowest rate.
DSCR
20% down · 8.5% · 30yr
- Down + closing
- —
- Monthly P&I
- —
- Monthly cashflow
- —
- DSCR
- —
- Eligible?
- —
No personal income docs; deal must DSCR.
Hard money
10% down · 12.0% · 12mo
- Down + closing
- —
- Monthly P&I
- —
- Monthly cashflow
- —
- DSCR
- —
- Eligible?
- —
Short-term bridge; refi at stabilization.
Listing history 10 events
-
2026-06-18days on market $80,000 Active 13 DOM
-
2026-06-17days on market $80,000 Active 12 DOM
-
2026-06-16days on market $80,000 Active 11 DOM
-
2026-06-15days on market $80,000 Active 10 DOM
-
2026-06-13days on market $80,000 Active 8 DOM
-
2026-06-12days on market $80,000 Active 7 DOM
-
2026-06-09days on market $80,000 Active 4 DOM
-
2026-06-08days on market $80,000 Active 3 DOM
-
2026-06-08remarks 339-char remark
-
2026-06-08$80,000 Active 2 DOM
ⓘ Source: listings_history table (triggers on properties + properties_extension) + one-shot
backfill from property_details.listing_events for pre-trigger history.
Tax reassessment forecast OK · Resets to sale price
- Current annual tax
- $376 · $31/mo
- Projected year-2 tax
- $720 · $60/mo
- Expected delta
- +$344/yr (+$29/mo · 91.5%)
ⓘ Screening estimate from a state-policy table — verify with the county assessor before closing.
Nearby sold comps map
Loading sold comps map…
Walkable amenities ~0.75 mi
Loading nearby amenities…
Taxation est. · year 1
- Rental income
- $11,666
- − Mortgage interest
- −$4,481
- − Property taxes
- −$376
- − Insurance
- −$400
- − Repairs & maintenance
- −$933
- − Management
- −$933
- − Depreciation
- −$2,327
- Taxable income
- $2,215
- Est. tax owed @ 24.0%
- −$532
- After-tax cash flow
- $2,874/yr
For passive investors: Depreciation is non-cash, so a rental often shows a tax loss while cash-flowing — sheltering income. Rental losses are passive: they offset passive income freely, and up to $25,000/yr can offset ordinary (W-2) income if you actively participate and your MAGI is under $100k (phasing out to $0 by $150k); unused losses carry forward. On sale, claimed depreciation is recaptured at up to 25%, and gains may owe capital-gains tax (a 1031 exchange can defer both). Figures are a year-1 estimate at your 24.0% rate — not tax advice; consult a CPA.
Schools (NCES district)
- District
- Hobart
- NCES district ID
- 4014700
- Math proficiency
- 23% ▼ -6.00%
- Reading proficiency
- 28% ▼ -8.00%
- Median HH income
- $36,779
- Composite
- 21.2/100
- National rank
- #8417
- State rank
- #110 of 270 in OK
Livability — Hobart
- Score
- 53/100
- State rank
- #627
- US rank
- #24677
Category grades
Schools grade is shown separately in the Schools card above.
Census & demographics
- Census place
- Hobart, OK
- City population
- 4,070
- Population (ZIP)
- 4,070
Population outlook (Kiowa County) Hauer SSP2
- Today (2025)
- 8,842 people
- By 2030
- 8,733 · -1.2%
- By 2040
- 8,641 · -2.3%
- By 2050
- 8,758 · -1.0%
- By 2075
- 9,894 · +11.9%
- By 2100
- 11,194 · +26.6%
Race, ethnicity, and origin ACS 2023
- Neighborhood character
- Predominantly White (72%)
- Race & ethnicity
- White 72% Hispanic / Latino 15% Two or more races 10% Black 4% Native American 2%
- Hispanic origin (detail)
- Mexican 13%
- Common ancestry
- Iranian 8% Italian 2% Slovak 1%
- Foreign-born
- 1% · Canada
- Languages at home
- 90% English-only · Spanish 10%
Political lean MEDSL · Kiowa
- 2024 margin
- Solid R (+58.3) · D 20.1% · R 78.4% · Other 1.6%
- 2008→2024 swing
- -23.5pp toward R · 2008: -34.8pp · 2024: -58.3pp
- All cycles
- 2024: R+58.3 2020: R+57.6 2016: R+52.4 2012: R+35.4 2008: R+34.8
Not yet ingested
- Civics
- —
Market trends
- HPI YoY
- ▲ 11.68%
- Current HPI
- 158.6311
- Rent YoY
- —
- Metro
- —
- State GDP YoY
- ▲ 1.55%
- F500 in state
- 6
Industry mix (Fortune 500 HQ in OK)
| Industry | F500 HQs | Revenue |
|---|---|---|
| Energy | 3 | $48B |
|
||
Price history
+433.3% since first listed9 events — show timeline
- 2026-06-05 Listed $80,000 MLSOK
- 2025-08-17 Rental Removed $900 TURBOTENANT
- 2025-07-17 Listed for Rent $900 TURBOTENANT
- 2025-06-18 Rental Removed $900 TURBOTENANT
- 2025-05-17 Listed for Rent $900 TURBOTENANT
- 2024-10-11 Sold (Public Records) $190,000 Public Records
- 2024-10-11 Sold (MLS) $11,666 MLSOK
- 2024-08-18 Pending — MLSOK
- 2024-06-11 Listed $15,000 MLSOK
Property tax history
+3.8%/yrLatest (2025): $376 · +6.2% YoY. Source: county tax records.
Cash-flow waterfall
monthlySold comps — $/sqft
last 12 mo · ≤1 miLoading sold comps…