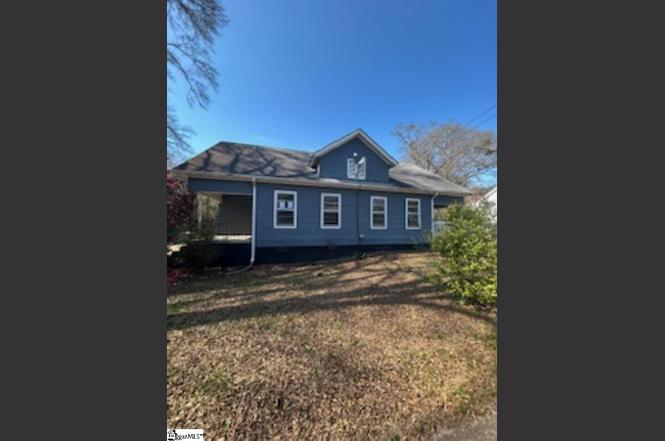
255 Limestone St · Pacolet, SC
Flood risk 1/10 · Minimal
- FEMA flood zone
- X (unshaded)
- Chance of flooding over 30 yrs
- 0.0%
- Est. flood insurance / yr
- $507 – $1,088
Fire risk 4/10 · Minor
- Est. fire insurance / yr
- $783 – $1,453
Heat risk 6/10 · Moderate
- Hot days now (above 105°F)
- 7 days/yr
- Hot days in 30 yrs
- 16 days/yr
Wind risk 3/10 · Minor
- Chance of severe wind over 30 yrs
- 4.0%
Air-quality risk 3/10 · Minor
- Unhealthy air days now
- 3 days/yr
- Unhealthy air days in 30 yrs
- 3 days/yr
Risk factors via First Street. Map © Google.
Why this score? — see what drove the B grade
The composite is a weighted blend of 9 inputs, each scored 0–100. Each bar is that input's sub-score; the figure is the points it added to the 100-point composite (weight × sub-score).
- Cash flow +30.0/30.0
- ARV discount +11.2/15.0
- DSCR +10.0/10.0
- 1% rule +9.7/10.0
- Schools +3.7/10.0
- Livability +3.5/5.0
- Rent growth +2.5/5.0
- Condition / age +2.5/5.0
- Appreciation +0.0/10.0
$81,000
🖨 Deal sheet (PDF) 📄 Offer letter ✓ Due diligence
Listing remarks
Great opportunity for a first time buyer. 255 Limestone Street offers a 2-bedroom 2 bath home with a spacious den and living room. Home has a 0.28 acre lot. Property Sold AS IS. HUD case # 461-482455 In. Home was built in 1915 and has approx. 1424 square feet. THIS PROPERTY IS AN EQUAL HOUSING OPPORTUNITY
Key facts
- 0.28 acre lot
- Built 1915
- Listed 62 days
Property features AI
Finance
- HOA & community: No HOA amenities or fees
Exterior
- Parking: Unpaved driveway; Other/see remarks for garage/parking details
- Utilities: Public water; Public sewer; Private garbage pickup
- Home design: Single-story home; Built around 1915; Residential property disclosure required; Lead-based paint disclosure required
- Construction: Asbestos shingle exterior; Composition shingle roof; Crawl space foundation; Outbuilding for storage
- Exterior features: Porch (other); Level lot
Interior
- Kitchen: 13 x 9 kitchen; Dishwasher
- Bedrooms: Primary bedroom on main level (11 x 15); Second bedroom on main level (11 x 15)
- Flooring: Hardwood flooring; Vinyl flooring
- Bathrooms: Two full bathrooms on the main level
- Heating & cooling: Forced air heating (natural gas); Central forced cooling; Gas water heater
- Interior features: Ceiling fan
- Laundry & utility: Laundry on the 1st floor
Neighborhood map
What this means for you Summary
Snapshot
- This is a 3-bed/2.0-bath single-family listed at $81k.
Deal economics
- At list price, monthly cash flow is $455 ($5k/yr) — positive.
- The deal already cash-flows at list — no discount required.
- Meets the 1% rule at list price ($1k rent vs $81k).
- Recommended offer: $76k (6.0% below list) — sets the bar for market timing.
- Cap rate 13.0% vs local median 3.6% in Pacolet — top-decile yield for the area; either an underpriced asset or a hidden risk that comps aren't pricing in. Stress-test before assuming the spread holds.
Location & tenants
- Location reads 69/100 on livability (#69 in SC) — a middle-class / working-renter tenant base. Strengths: cost of living A+, housing A+; Watch: employment D, amenities F, commute F.
- Spartanburg 03 (suburban): math 39% / reading 49% proficiency, ranked #28 of 80 in SC (top 35%) — families likely to look elsewhere, expect single-tenant / working-renter base with shorter leases.
- Zoned schools: Pacolet Elementary (math 52% / reading 47%, grade D, #168 of 597 statewide, top 31%, 410 students, 100% FRL); Clifdale Middle (695 students, 78% FRL); Broome High (math 42% / reading 80%, grade C+, #105 of 196 statewide, top 54%, 825 students, 68% FRL) — zoned schools average 82% FRL vs 57% district-wide (25 pts higher); higher-poverty schools than district average — tighter screening recommended.
- Market conditions: 42 active listings in the ZIP; 3,129 units permitted in Spartanburg County in 2024 (40 in 5+ unit buildings).
Forward outlook
- Local home prices are declining (-3.0%/yr); year-one equity from $560 of loan paydown is wiped out by about $2k of value loss. Plan a longer hold.
- Spartanburg County population projected at +18% by 2050 — long-run rental-demand tailwind backs the buy-and-hold thesis.
- At projected returns (-3.0% appreciation + 3.0% rent growth), your $23k cash investment doubles in ~6 years — after that, you're playing with house money.
Negotiation context
- It's been on market 62 days — a 6% lower offer ($76k) is reasonable based on typical stale-listing flexibility.
Risks & watch-outs
- Watch-outs: built in 1915 — expect roof / HVAC / electrical / plumbing capex.
- Climate carrying-cost: extreme-heat days projected 7→16/yr by 2055 (HVAC capex compounding) — expect insurance premiums to compound above CPI over the hold.
Questions for the listing agent
- It's been on market 62 days. Have you received any prior offers? Is the seller open to a 6% concession, seller financing, or rate buy-down credit?
- Built in 1915 — when were the roof, HVAC, electrical panel, plumbing, and water heater last replaced?
- Why hasn't it sold? Are there any deal-killer items the seller is aware of (foundation, flood, title, zoning, code violations)?
- Is there a deadline driving the sale (1031 exchange, divorce, estate, relocation)? That informs how much negotiation room exists.
- Schools are F-rated, which usually means shorter tenancies and higher turnover. Who's the typical renter profile here, and what's been the actual vacancy rate?
- What's the average days-on-market for RENTAL listings here right now (not sales)? A rising rental-DOM trend means longer vacancies and softer asking-rent achievability than the comps imply.
- What's the recent tenant-quality profile in this submarket — average credit score on applications, eviction rate, late-payment / NSF rate, and stable-employment percentage? A property-management company in the area should have these aggregated.
- How much new for-sale + rental construction is in the pipeline within 1–3 miles? Heavy new supply typically softens prices + rents 12–24 months out; constrained supply supports both.
Investment metrics
- 1% rule
- 1.47% ✓
- Cap rate
- 13.03%
- Cash-on-cash
- 24.06%
- DSCR
- 2.07
- GRM
- 5.7
CMA / ARV
- ARV (on-the-fly)
- $88,288
- Comps found
- 7
Show comp detail 7 sales within ~0.75 mi
| Address | Dist | Beds/Ba | Sqft | Sold | Price | $/sf | Match |
|---|---|---|---|---|---|---|---|
| 1130 Cleveland St | 0.17mi | 3/1.0 | 1,388 (-2%) | 1mo | $65,000 | $47 | 83 |
| 235 Green St | 0.07mi | 3/2.0 | 1,464 (+3%) | 13mo | $79,000 | $54 | 81 |
| 215 Limestone St | 0.08mi | 2/2.0 (-1) | 1,444 (+1%) | 12mo | $90,000 | $62 | 79 |
| 236 Walker St | 0.35mi | 3/1.0 | 1,388 (-2%) | 10mo | $90,000 | $65 | 68 |
| 225 Montgomery Ave | 0.34mi | 3/1.0 | 1,388 (-2%) | 15mo | $143,000 | $103 | 63 |
| 268 Walker St | 0.42mi | 3/1.5 | 1,388 (-2%) | 14mo | $40,000 | $29 | 63 |
| 173 Fleming Ave | 0.43mi | 3/1.5 | 1,440 (+1%) | 17mo | $104,000 | $72 | 62 |
Match score weights: distance 35% · size 25% · config 20% · recency 20%. Top-matched comps best support the ARV.
Projected returns pro-forma
-3.0% appreciation · 3.0% rent growth · sell at horizon
- IRR
- 17.3%
- Equity multiple
- 1.70×
- Total profit
- $15,802
- Equity at exit
- $12,077
- IRR
- 25.7%
- Equity multiple
- 3.25×
- Total profit
- $50,927
- Equity at exit
- $7,003
Cash invested: $22,680 (down + closing). Projections, not guarantees.
Landlord ↔ Tenant lean methodology
- Overall (STATE)
- 90 Strongly Landlord-Friendly
- State South Carolina
- 90 Strongly Landlord-Friendly · R+6
- County
- — inherits STATE
- City
- — inherits STATE
ZIP-level market 29372
- Home prices YoY
- -12.1%
- Active inventory
- 42
- Price-to-rent
- 5.7×
Monthly cashflow live
- Estimated rent
- $1,187 medium interval (Pro) →
- Mortgage (P&I)
- −$425
- Tax from tax record
- −$24 /mo · $291/yr
- Insurance
- −$34
- HOA
- −$0
- Vacancy / Maint / Mgmt
- −$249
- Net cashflow
- $455
Break-even live
Sensitivity live
| Price | -10% $501 | -5% $478 | +0% $455 | +5% $432 | +10% $409 |
|---|---|---|---|---|---|
| Rent | -10% $361 | -5% $408 | +0% $455 | +5% $502 | +10% $548 |
| Rate | -1.0pp $495 | -0.5pp $475 | base $455 | +0.5pp $434 | +1.0pp $412 |
UW: 25.0% down · 7.5% · 30yr · 1.5% tax · 5.0% vac · 8.0% maint · 8.0% mgmt
Financing live
Cash to close
- Down payment
- $20,250
- Closing costs
- $2,430
- Reserves months
- —
- Total cash needed
- —
Loan-product check · same deal, 3 products live
Conventional
25% down · 7.5% · 30yr
- Down + closing
- —
- Monthly P&I
- —
- Monthly cashflow
- —
- DSCR
- —
- Eligible?
- —
Personal DTI + credit; lowest rate.
DSCR
20% down · 8.5% · 30yr
- Down + closing
- —
- Monthly P&I
- —
- Monthly cashflow
- —
- DSCR
- —
- Eligible?
- —
No personal income docs; deal must DSCR.
Hard money
10% down · 12.0% · 12mo
- Down + closing
- —
- Monthly P&I
- —
- Monthly cashflow
- —
- DSCR
- —
- Eligible?
- —
Short-term bridge; refi at stabilization.
Listing history 3 events
-
2026-05-12status Pending
-
2026-04-15price $81,000
-
2026-03-11$90,000 Active
ⓘ Source: listings_history table (triggers on properties + properties_extension) + one-shot
backfill from property_details.listing_events for pre-trigger history.
Tax reassessment forecast SC · Resets to sale price
- Current annual tax
- $291 · $24/mo
- Projected year-2 tax
- $462 · $38/mo
- Expected delta
- +$170/yr (+$14/mo · 58.4%)
ⓘ Screening estimate from a state-policy table — verify with the county assessor before closing.
Climate risk First Street
- Flood 1/10 Low FEMA zone X (unshaded) · 0% chance over 30 yrs
- Wildfire 4/10 Moderate
- Heat 6/10 Major 7 d/yr ≥105°F today · 16 d/yr by 30 yrs out
- Wind 3/10 Moderate 4% chance of damaging wind over 30 yrs
- Air quality 3/10 Moderate 3 unhealthy d/yr today · 3 by 30 yrs out
Nearby sold comps map
Loading sold comps map…
Walkable amenities ~0.75 mi
Loading nearby amenities…
Taxation est. · year 1
- Rental income
- $14,240
- − Mortgage interest
- −$4,537
- − Property taxes
- −$291
- − Insurance
- −$405
- − Repairs & maintenance
- −$1,139
- − Management
- −$1,139
- − Depreciation
- −$2,356
- Taxable income
- $4,371
- Est. tax owed @ 24.0%
- −$1,049
- After-tax cash flow
- $4,407/yr
For passive investors: Depreciation is non-cash, so a rental often shows a tax loss while cash-flowing — sheltering income. Rental losses are passive: they offset passive income freely, and up to $25,000/yr can offset ordinary (W-2) income if you actively participate and your MAGI is under $100k (phasing out to $0 by $150k); unused losses carry forward. On sale, claimed depreciation is recaptured at up to 25%, and gains may owe capital-gains tax (a 1031 exchange can defer both). Figures are a year-1 estimate at your 24.0% rate — not tax advice; consult a CPA.
Schools (NCES district)
- District
- Spartanburg 03
- NCES district ID
- 4503540
- Math proficiency
- 39% ▼ -5.00%
- Reading proficiency
- 49% ▲ 6.00%
- Median HH income
- $36,898
- Composite
- 36.52/100
- National rank
- #4645
- State rank
- #28 of 80 in SC
Livability — Pacolet
- Score
- 69/100
- State rank
- #69
- US rank
- #8417
Category grades
Schools grade is shown separately in the Schools card above.
Census & demographics
- Census place
- Pacolet, SC
- City population
- 293
- Population (ZIP)
- 3,440
Population outlook (Spartanburg County) Hauer SSP2
- Today (2025)
- 325,495 people
- By 2030
- 338,800 · +4.1%
- By 2040
- 363,471 · +11.7%
- By 2050
- 384,156 · +18.0%
- By 2075
- 430,137 · +32.1%
- By 2100
- 442,733 · +36.0%
Race, ethnicity, and origin ACS 2023
- Neighborhood character
- Predominantly White (79%)
- Race & ethnicity
- White 79% Black 16% Hispanic / Latino 3% Two or more races 2%
- Common ancestry
- Lithuanian 1% Slovak 1% Iranian 1%
- Foreign-born
- 2% · Canada
- Languages at home
- 95% English-only · Spanish 4% German/W. Germanic 1%
Political lean MEDSL · Spartanburg
- 2024 margin
- Solid R (+33.6) · D 32.6% · R 66.2% · Other 1.2%
- 2008→2024 swing
- -12.0pp toward R · 2008: -21.6pp · 2024: -33.6pp
- All cycles
- 2024: R+33.6 2020: R+27.3 2016: R+30.0 2012: R+23.1 2008: R+21.6
Not yet ingested
- Civics
- —
Market trends
- HPI YoY
- ▼ -30.46%
- Current HPI
- 222.0245
- Rent YoY
- —
- Metro
- —
- State GDP YoY
- ▲ 4.51%
- F500 in state
- 2
Industry mix (Fortune 500 HQ in SC)
| Industry | F500 HQs | Revenue |
|---|---|---|
| Packaging | 1 | $7B |
|
||
Price history
-10.0% since first listed3 events — show timeline
- 2026-05-12 Pending — Greater Greenville MLS
- 2026-04-15 Price Changed $81,000 Greater Greenville MLS
- 2026-03-11 Listed $90,000 Greater Greenville MLS
Property tax history
+10.8%/yrLatest (2025): $291 · +3.6% YoY. Source: county tax records.
Cash-flow waterfall
monthlySold comps — $/sqft
last 12 mo · ≤1 miLoading sold comps…