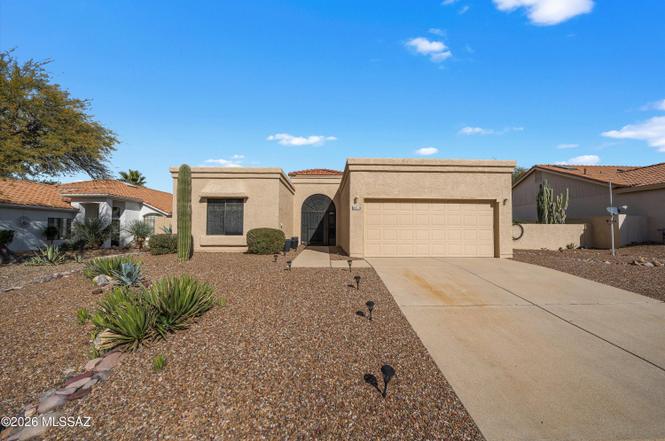
64510 E Canyon Shadows Ln · Saddlebrooke, AZ
Flood risk 1/10 · Minimal
- FEMA flood zone
- X (unshaded)
- Chance of flooding over 30 yrs
- 0.0%
- Est. flood insurance / yr
- $507 – $1,088
Fire risk 6/10 · Moderate
- Est. fire insurance / yr
- $610 – $1,132
Heat risk 7/10 · Major
- Hot days now (above 101°F)
- 7 days/yr
- Hot days in 30 yrs
- 21 days/yr
Wind risk 1/10 · Minimal
- Chance of severe wind over 30 yrs
- —
Air-quality risk 1/10 · Minimal
- Unhealthy air days now
- 0 days/yr
- Unhealthy air days in 30 yrs
- 0 days/yr
Risk factors via First Street. Map © Google.
Why this score? — see what drove the D+ grade
The composite is a weighted blend of 9 inputs, each scored 0–100. Each bar is that input's sub-score; the figure is the points it added to the 100-point composite (weight × sub-score).
- ARV discount +15.0/15.0
- Cash flow +14.7/30.0
- DSCR +4.5/10.0
- 1% rule +4.3/10.0
- Livability +3.1/5.0
- Rent growth +2.5/5.0
- Condition / age +2.5/5.0
- Schools +2.1/10.0
- Appreciation +0.0/10.0
$315,000
🖨 Deal sheet (PDF) 📄 Offer letter ✓ Due diligence
Listing remarks
An original Toltec model offering 1535 sq ft of living space. This territorial-style two-bedroom, two-bath residence offers ample opportunity for personal customization. The double-door entry leads to a spacious great room with a fireplace, perfect for enjoying SaddleBrooke's cooler evenings. The kitchen features abundant white Euro cabinetry and opens to a breakfast nook with additional storage. The primary suite includes an ensuite bath with a double vanity, walk-in closet, and direct access to the covered patio and hot tub. A guest bedroom and bathroom provide comfortable accommodations for visitors. Outside, a large, fully enclosed yard with a wrap-around covered patio creates an ideal
Key facts
- 8,600 sq ft lot
- 2 garage spots
- Community pool
Property features AI
Finance
- Other: Lot has shrubs, front sprinklers, north/south exposure; Paved road maintained by HOA; Irregular lot shape
- HOA & community: Part of HOA (SS HOA 1); HOA semi-annual fee; HOA transfer fee applies; HOA covers common area maintenance and street maintenance; Community amenities include clubhouse, pool, spa/hot tub, tennis courts, pickleball, volleyball court, putting green, basketball court, fitness center, recreation center, paved streets
Exterior
- Parking: Attached 2-car garage with garage door opener and cabinets; 2 covered parking spaces
- Security: Wrought-iron security door; Smoke detectors
- Utilities: Water from local water company; Sewer connected; Pre-wired for telephone lines
- Home design: Single-family residence, Shawnee model; One story; South-facing
- Construction: Frame with stucco exterior; Built-Up roof
- Exterior features: Covered paver patio; Block fencing; Spa/Hot Tub
Interior
- Kitchen: Dishwasher; Disposal; Refrigerator; Electric range
- Bedrooms: One-level layout
- Flooring: Carpet; Ceramic tile
- Bathrooms: 2 full bathrooms
- Heating & cooling: Forced air heating; Central air conditioning; Ceiling fans
- Interior features: Pre-wired for satellite dish; Gas fireplace in living room; Smoke detectors; Wrought-iron security door
- Laundry & utility: Laundry closet
Neighborhood map
What this means for you Summary
Snapshot
- This is a 2-bed/2.0-bath single-family listed at $315k.
Deal economics
- At list price, monthly cash flow is $83 ($992/yr) — positive.
- The deal already cash-flows at list — no discount required.
- To meet the 1% rule (rent ≥ 1% of price), the offer needs to be $292k (7.4% below list).
- Recommended offer: $277k (12.0% below list) — sets the bar for market timing.
- Cap rate 6.6% vs local median 3.9% in Saddlebrooke — top-decile yield for the area; either an underpriced asset or a hidden risk that comps aren't pricing in. Stress-test before assuming the spread holds.
Location & tenants
- Location reads 61/100 on livability (#168 in AZ) — a middle-class / working-renter tenant base. Strengths: crime A+, employment A+, housing A-; Watch: amenities F, commute F, cost of living F.
- Oracle Elementary District (4444) (rural): math 15% / reading 30% proficiency, ranked #159 of 249 in AZ (top 64%) — low school quality limits family demand, transient renter base, plan for 1-2y turnover.
- Market conditions: 278 active listings in the ZIP; 23 comparable units currently listed for rent nearby; rentals at typical pace (median 26d on market — plan ~3-4 weeks tenant-placement turnaround); 9,504 units permitted in Pinal County in 2024 (776 in 5+ unit buildings).
Forward outlook
- Local home prices are declining (-3.0%/yr); year-one equity from $2k of loan paydown is wiped out by about $9k of value loss. Plan a longer hold.
Negotiation context
- It's been on market 132 days — a 12% lower offer ($277k) is reasonable based on typical stale-listing flexibility.
- 2 sale attempts since 19y ago with the ask held roughly flat each time — persistent listings suggest the price (not the market) is what's stuck; bring a comps-based counter.
- Current owner paid $105k; list at $315k implies a 200% gain — meaningful room to come down on a strong offer.
Risks & watch-outs
- Climate carrying-cost: major wildfire risk; extreme-heat days projected 7→21/yr by 2055 (HVAC capex compounding) — expect insurance premiums to compound above CPI over the hold.
Questions for the listing agent
- It's been on market 132 days. Have you received any prior offers? Is the seller open to a 12% concession, seller financing, or rate buy-down credit?
- What does the HOA fee cover, when was the last increase, and are there any pending special assessments or reserve-fund shortfalls?
- Why hasn't it sold? Are there any deal-killer items the seller is aware of (foundation, flood, title, zoning, code violations)?
- Is there a deadline driving the sale (1031 exchange, divorce, estate, relocation)? That informs how much negotiation room exists.
- The area grade is low — what's the realistic commute time and amenity access for the typical tenant pool here? Any planned neighborhood developments (good or bad) we should know about?
- What's the average days-on-market for RENTAL listings here right now (not sales)? A rising rental-DOM trend means longer vacancies and softer asking-rent achievability than the comps imply.
- What's the recent tenant-quality profile in this submarket — average credit score on applications, eviction rate, late-payment / NSF rate, and stable-employment percentage? A property-management company in the area should have these aggregated.
- How much new for-sale + rental construction is in the pipeline within 1–3 miles? Heavy new supply typically softens prices + rents 12–24 months out; constrained supply supports both.
Investment metrics
- 1% rule
- 0.93% ✗
- Cap rate
- 6.61%
- Cash-on-cash
- 1.12%
- DSCR
- 1.05
- GRM
- 9.0
CMA / ARV
- ARV (on-the-fly)
- $379,145
- Comps found
- 12
Show comp detail 12 sales within ~0.75 mi
| Address | Dist | Beds/Ba | Sqft | Sold | Price | $/sf | Match |
|---|---|---|---|---|---|---|---|
| 64262 E Chippewa Ct | 0.30mi | 2/2.0 | 1,529 (-0%) | 14mo | $285,000 | $186 | 74 |
| 38230 S Elbow Bend Dr | 0.46mi | 2/2.0 | 1,600 (+4%) | 0mo | $315,000 | $197 | 72 |
| 64304 E Round Robin Ln | 0.15mi | 2/2.0 | 1,364 (-11%) | 6mo | $344,000 | $252 | 69 |
| 38289 S Silverwood Dr | 0.24mi | 2/2.0 | 1,387 (-10%) | 10mo | $282,000 | $203 | 64 |
| 37970 S Elbow Bend Dr | 0.58mi | 2/2.0 | 1,600 (+4%) | 3mo | $345,000 | $216 | 63 |
| 64442 E Galveston Ln | 0.44mi | 2/2.0 | 1,436 (-6%) | 10mo | $355,000 | $247 | 60 |
| 63842 E Via De Desconso | 0.48mi | 3/2.0 (+1) | 1,550 (+1%) | 13mo | $525,000 | $339 | 60 |
| 63902 E Condalia Pl | 0.49mi | 3/2.0 (+1) | 1,550 (+1%) | 14mo | $505,000 | $326 | 59 |
| 63812 E High Point Ln | 0.63mi | 2/2.0 | 1,449 (-6%) | 5mo | $325,000 | $224 | 57 |
| 38240 S Mountain Site Dr | 0.39mi | 2/2.0 | 1,734 (+13%) | 9mo | $330,000 | $190 | 53 |
| 65410 E Rolling Hills Dr | 0.69mi | 2/2.0 | 1,677 (+9%) | 5mo | $422,982 | $252 | 48 |
| 37931 S Desert Bluff Dr | 0.73mi | 2/2.0 | 1,458 (-5%) | 11mo | $420,000 | $288 | 48 |
Match score weights: distance 35% · size 25% · config 20% · recency 20%. Top-matched comps best support the ARV.
Projected returns pro-forma
-3.0% appreciation · 3.0% rent growth · sell at horizon
- IRR
- -14.5%
- Equity multiple
- 0.48×
- Total profit
- $-45,708
- Equity at exit
- $46,968
- IRR
- -5.7%
- Equity multiple
- 0.63×
- Total profit
- $-32,735
- Equity at exit
- $27,235
Cash invested: $88,200 (down + closing). Projections, not guarantees.
Landlord ↔ Tenant lean methodology
- Overall (STATE)
- 87 Strongly Landlord-Friendly
- State Arizona
- 87 Strongly Landlord-Friendly · R+3
- County
- — inherits STATE
- City
- — inherits STATE
ZIP-level market 85739
- Home prices YoY
- -34.1%
- Active inventory
- 278
- Price-to-rent
- 9.0×
Monthly cashflow live
- Estimated rent
- $2,916 high interval (Pro) →
- Mortgage (P&I)
- −$1,652
- Tax from tax record
- −$175 /mo · $2,100/yr
- Insurance
- −$131
- HOA
- −$263
- Vacancy / Maint / Mgmt
- −$612
- Net cashflow
- $83
Break-even live
Sensitivity live
| Price | -10% $261 | -5% $172 | +0% $83 | +5% $-7 | +10% $-96 |
|---|---|---|---|---|---|
| Rent | -10% $-148 | -5% $-33 | +0% $83 | +5% $198 | +10% $313 |
| Rate | -1.0pp $241 | -0.5pp $163 | base $83 | +0.5pp $1 | +1.0pp $-82 |
UW: 25.0% down · 7.5% · 30yr · 1.5% tax · 5.0% vac · 8.0% maint · 8.0% mgmt
Financing live
Cash to close
- Down payment
- $78,750
- Closing costs
- $9,450
- Reserves months
- —
- Total cash needed
- —
Loan-product check · same deal, 3 products live
Conventional
25% down · 7.5% · 30yr
- Down + closing
- —
- Monthly P&I
- —
- Monthly cashflow
- —
- DSCR
- —
- Eligible?
- —
Personal DTI + credit; lowest rate.
DSCR
20% down · 8.5% · 30yr
- Down + closing
- —
- Monthly P&I
- —
- Monthly cashflow
- —
- DSCR
- —
- Eligible?
- —
No personal income docs; deal must DSCR.
Hard money
10% down · 12.0% · 12mo
- Down + closing
- —
- Monthly P&I
- —
- Monthly cashflow
- —
- DSCR
- —
- Eligible?
- —
Short-term bridge; refi at stabilization.
Rent comps 23 comps
| Address | Beds | Baths | Sqft | Rent | $/sqft | DOM | Units | Dist |
|---|---|---|---|---|---|---|---|---|
| 38325 S Mountain Site Dr Tucson, AZ | 2.0 | 2.5 | 2218 | $2,975 | $1.34 | 18d | 1 | 0.32mi |
| 38973 S Tranquil Dr Tucson, AZ | 2.0 | 2.0 | 1448 | $2,800 | $1.93 | 25d | 1 | 0.53mi |
| 38040 S Elbow Bend Dr Tucson, AZ | 2.0 | 1.5 | 1810 | $2,400 | $1.33 | 25d | 1 | 0.53mi |
| 38844 S Carefree Dr Tucson, AZ | 2.0 | 2.0 | 1740 | $3,500 | $2.01 | 19d | 1 | 0.54mi |
| 64576 E Wind Ridge Cir Tucson, AZ | 2.0 | 2.0 | 1544 | $2,700 | $1.75 | 25d | 1 | 0.55mi |
| 38045 S Elbow Bend Dr Tucson, AZ | 3.0 | 2.0 | 2141 | $3,100 | $1.45 | 25d | 1 | 0.56mi |
| 64528 E Wind Ridge Cir Tucson, AZ | 2.0 | 2.0 | 1456 | $2,700 | $1.85 | 19d | 1 | 0.57mi |
| 63692 E Vacation Dr Tucson, AZ | 2.0 | 2.0 | 1709 | $2,800 | $1.64 | 11d | 1 | 0.63mi |
| 38873 S Serenity Ln Tucson, AZ | 2.0 | 2.0 | 1709 | $2,875 | $1.68 | 25d | 1 | 0.65mi |
| 38774 S Desert Bluff Dr Tucson, AZ | 2.0 | 2.0 | 1638 | $2,775 | $1.69 | 19d | 1 | 0.65mi |
| 65091 E Diamond Ridge Ct Tucson, AZ | 2.0 | 2.0 | 2075 | $2,800 | $1.35 | 25d | 1 | 0.68mi |
| 38162 S Desert Bluff Dr Tucson, AZ | 2.0 | 2.5 | 2106 | $2,950 | $1.40 | 25d | 1 | 0.70mi |
| 37330 S Canyon View Dr Tucson, AZ | 2.0 | 2.0 | 1428 | $3,500 | $2.45 | 25d | 1 | 0.79mi |
| 63945 E Orangewood Ln Tucson, AZ | 2.0 | 2.0 | 2194 | $2,900 | $1.32 | 25d | 1 | 0.88mi |
| 37514 S Desert Star Ct Tucson, AZ | 2.0 | 2.0 | 1576 | $2,500 | $1.59 | 5d | 1 | 0.89mi |
| 37413 S Golf Course Dr Tucson, AZ | 3.0 | 3.0 | 1977 | $3,100 | $1.57 | 25d | 1 | 1.14mi |
| 39548 S Summerwood Dr Tucson, AZ | 2.0 | 1.5 | 1638 | $2,700 | $1.65 | 2d | 1 | 1.27mi |
| 37284 S Ocotillo Canyon Dr Tucson, AZ | 2.0 | 2.0 | 1968 | $2,875 | $1.46 | 25d | 1 | 1.27mi |
| 36716 S Stoney Flower Dr Tucson, AZ | 2.0 | 2.0 | 1866 | $3,900 | $2.09 | 25d | 1 | 1.27mi |
| 65685 E Rocky Trail Dr Tucson, AZ | 3.0 | 2.0 | 2140 | $2,000 | $0.93 | 25d | 1 | 1.28mi |
| 39019 S Moonwood Dr Tucson, AZ | 2.0 | 2.0 | 1959 | $2,800 | $1.43 | 19d | 1 | 1.29mi |
| 39589 S Summerwood Dr Tucson, AZ | 2.0 | 2.0 | 1650 | $3,000 | $1.82 | 2d | 1 | 1.31mi |
| 36500 S Rock Crest Dr Tucson, AZ | 2.0 | 1.5 | 1913 | $4,200 | $2.20 | 25d | 1 | 1.44mi |
HOA detail
- Monthly dues
- $263 · $3,156/yr
Listing history 19 events
-
2026-06-21days on market $315,000 Active 132 DOM
-
2026-06-18days on market $315,000 Active 129 DOM
-
2026-06-17days on market $315,000 Active 128 DOM
-
2026-06-16days on market $315,000 Active 127 DOM
-
2026-06-15days on market $315,000 Active 126 DOM
-
2026-06-13days on market $315,000 Active 124 DOM
-
2026-06-13days on market $315,000 Active 123 DOM
-
2026-06-09days on market $315,000 Active 120 DOM
-
2026-06-08days on market $315,000 Active 119 DOM
-
2026-06-07days on market $315,000 Active 118 DOM
-
2026-06-04days on market $315,000 Active 115 DOM
-
2026-06-03days on market $315,000 Active 114 DOM
-
2026-06-02days on market $315,000 Active 113 DOM
-
2026-06-01days on market $315,000 Active 112 DOM
-
2026-05-31days on market $315,000 Active 111 DOM
-
2026-02-09$315,000 Active
-
2008-07-31historical
-
2007-12-07$249,900
-
1990-12-12soldstatus $105,000
ⓘ Source: listings_history table (triggers on properties + properties_extension) + one-shot
backfill from property_details.listing_events for pre-trigger history.
Tax reassessment forecast AZ · Resets to sale price
- Current annual tax
- $2,100 · $175/mo
- Projected year-2 tax
- $2,100 · $175/mo
- Expected delta
- $0/yr ($0/mo · 0.0%)
ⓘ Screening estimate from a state-policy table — verify with the county assessor before closing.
Climate risk First Street
- Flood 1/10 Low FEMA zone X (unshaded) · 0% chance over 30 yrs
- Wildfire 6/10 Major
- Heat 7/10 Severe 7 d/yr ≥101°F today · 21 d/yr by 30 yrs out
- Wind 1/10 Low
- Air quality 1/10 Low 0 unhealthy d/yr today · 0 by 30 yrs out
Nearby sold comps map
Loading sold comps map…
Walkable amenities ~0.75 mi
Loading nearby amenities…
Taxation est. · year 1
- Rental income
- $34,994
- − Mortgage interest
- −$17,645
- − Property taxes
- −$2,100
- − Insurance
- −$1,575
- − Repairs & maintenance
- −$2,799
- − Management
- −$2,799
- − HOA
- −$3,156
- − Depreciation
- −$9,164
- Taxable loss
- −$4,244
- Est. tax savings @ 24.0%
- +$1,019
- After-tax cash flow
- $2,010/yr
For passive investors: Depreciation is non-cash, so a rental often shows a tax loss while cash-flowing — sheltering income. Rental losses are passive: they offset passive income freely, and up to $25,000/yr can offset ordinary (W-2) income if you actively participate and your MAGI is under $100k (phasing out to $0 by $150k); unused losses carry forward. On sale, claimed depreciation is recaptured at up to 25%, and gains may owe capital-gains tax (a 1031 exchange can defer both). Figures are a year-1 estimate at your 24.0% rate — not tax advice; consult a CPA.
Schools (NCES district)
- District
- Oracle Elementary District (4444)
- NCES district ID
- 0405640
- Math proficiency
- 15% ▼ -9.00%
- Reading proficiency
- 30% ▲ 3.00%
- Median HH income
- $60,899
- Composite
- 20.97/100
- National rank
- #8469
- State rank
- #159 of 249 in AZ
Livability — Saddlebrooke
- Score
- 61/100
- State rank
- #168
- US rank
- #18326
Category grades
Schools grade is shown separately in the Schools card above.
Census & demographics
- Census place
- Saddlebrooke, AZ
- Population (ZIP)
- 18,749
Population outlook (Pinal County) Hauer SSP2
- Today (2025)
- 437,574 people
- By 2030
- 446,903 · +2.1%
- By 2040
- 452,589 · +3.4%
- By 2050
- 444,126 · +1.5%
- By 2075
- 430,300 · -1.7%
- By 2100
- 393,536 · -10.1%
Race, ethnicity, and origin ACS 2023
- Neighborhood character
- Predominantly White (78%)
- Race & ethnicity
- White 78% Hispanic / Latino 17% Two or more races 9%
- Hispanic origin (detail)
- Mexican 13%
- Common ancestry
- Romanian 4% Slovak 4% Portuguese 3%
- Foreign-born
- 9% · Canada, Jamaica
- Languages at home
- 87% English-only · Spanish 11% German/W. Germanic 1%
Political lean MEDSL · Pinal
- 2024 margin
- Strong R (+22.1) · D 38.5% · R 60.6%
- 2008→2024 swing
- -7.6pp toward R · 2008: -14.5pp · 2024: -22.1pp
- All cycles
- 2024: R+22.1 2020: R+17.3 2016: R+19.3 2012: R+17.1 2008: R+14.5
Not yet ingested
- Civics
- —
Market trends
- HPI YoY
- ▼ -109.24%
- Current HPI
- 211.3845
- Rent YoY
- —
- Metro
- —
- State GDP YoY
- ▲ 4.54%
- F500 in state
- 20
Industry mix (Fortune 500 HQ in AZ)
| Industry | F500 HQs | Revenue |
|---|---|---|
| Technology | 2 | $13B |
|
||
| Mining / Metals | 1 | $23B |
|
||
| Environmental Services | 1 | $16B |
|
||
| Metals / Steel | 1 | $14B |
|
||
| Technology Distribution | 1 | $9B |
|
||
| Homebuilding | 1 | $8B |
|
||
Price history
+200.0% since first listed4 events — show timeline
- 2026-02-09 Listed $315,000 MLSSAZ
- 2008-07-31 Listing Removed — MLSSAZ
- 2007-12-07 Listed $249,900 MLSSAZ
- 1990-12-12 Sold (Public Records) $105,000 Public Records
Property tax history
+0.7%/yrLatest (2025): $2,100 · +5.2% YoY. Source: county tax records.
Cash-flow waterfall
monthlySold comps — $/sqft
last 12 mo · ≤1 miLoading sold comps…