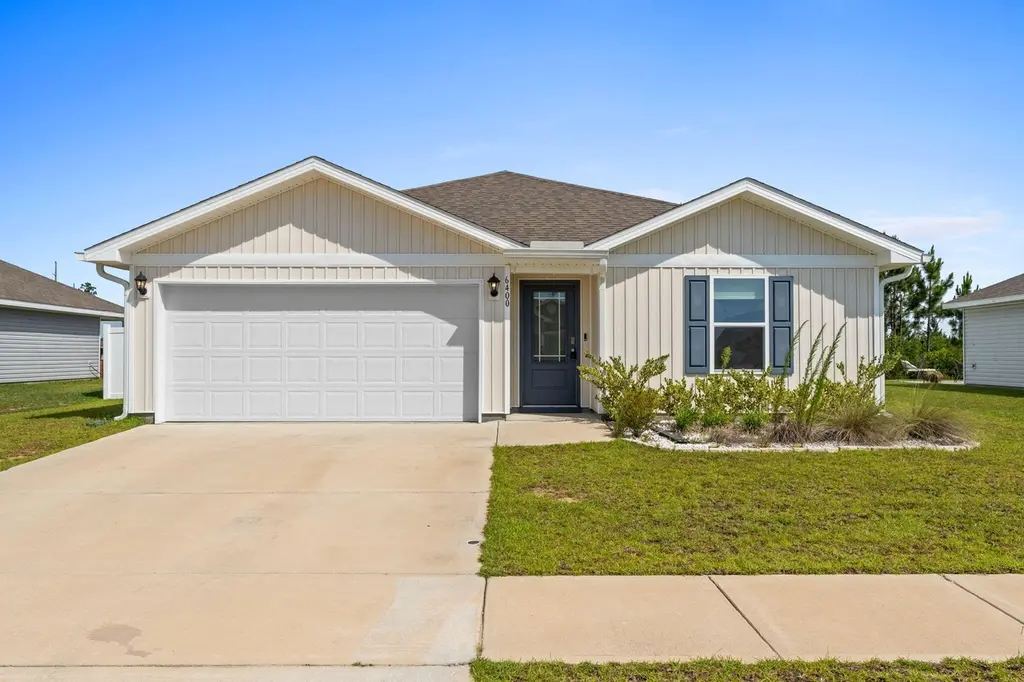
6400 Bellavia Ln · Panama City, FL
Flood risk 1/10 · Minimal
- FEMA flood zone
- X (unshaded)
- Chance of flooding over 30 yrs
- 0.0%
- Est. flood insurance / yr
- $507 – $1,088
Fire risk 6/10 · Moderate
- Est. fire insurance / yr
- $947 – $1,759
Heat risk 10/10 · Severe
- Hot days now (above 105°F)
- 7 days/yr
- Hot days in 30 yrs
- 21 days/yr
Wind risk 9/10 · Severe
- Chance of severe wind over 30 yrs
- 99.0%
Air-quality risk 1/10 · Minimal
- Unhealthy air days now
- 0 days/yr
- Unhealthy air days in 30 yrs
- 0 days/yr
Risk factors via First Street. Map © Google.
Why this score? — see what drove the D grade
The composite is a weighted blend of 9 inputs, each scored 0–100. Each bar is that input's sub-score; the figure is the points it added to the 100-point composite (weight × sub-score).
- Cash flow +12.0/30.0
- ARV discount +6.6/15.0
- Schools +4.3/10.0
- Condition / age +4.0/5.0
- DSCR +3.6/10.0
- Livability +3.6/5.0
- 1% rule +3.4/10.0
- Rent growth +2.8/5.0
- Appreciation +0.0/10.0
$289,000
🖨 Deal sheet (PDF) 📄 Offer letter ✓ Due diligence
Listing remarks MLS
Motivated Seller! Welcome to 6400 Bellavia Lane, a beautifully maintained 4-bedroom, 2-bath home offering 1,394 square feet of comfortable living space in the highly sought-after Liberty community of Panama City. Perfectly designed for everyday living and entertaining, this home features an open-concept floor plan, spacious bedrooms, and a large privacy-fenced backyard that provides the ideal setting for outdoor gatherings, children at play, or pets to roam freely. Located just a short walk from Liberty's outstanding neighborhood amenities, residents enjoy access to a resort-style community pool, splash pad, playground, fitness center, and beautifully maintained common areas, creating an exceptional lifestyle for families and active homeowners alike. The Liberty community also offers sidewalks throughout and a welcoming neighborhood atmosphere. Conveniently situated off Highway 231, this home offers easy access to everyday necessities and major destinations. Tyndall Air Force Base is just a short commute away, making it an excellent choice for military personnel and civilian employees. You'll also appreciate the convenient access to Northwest Florida Beaches International Airport, as well as the shopping, dining, entertainment, and white-sand beaches that make the Panama City area so desirable. Liberty's location provides quick access to Panama City Beach, local schools, healthcare facilities, and countless recreational opportunities. Adding even more convenience, the newly developed shopping corridor along Highway 231 features a new Publix and Starbucks just minutes from the neighborhood, making daily errands and your morning coffee run easier than ever. Whether you're searching for your first home, a growing family home, or an investment in one of Panama City's fastest-growing communities, 6400 Bellavia Lane offers the perfect combination of comfort, convenience, and community living.
Key facts
- Fitness center
- Splash pad
- Playground
Tags
Property features AI
Finance
- HOA & community: Homeowners association present; Association fees cover grounds maintenance, management and recreational facilities; Fees include accounting and ground keeping; Community amenities include pool, playground, pavilion/gazebo, community room, exercise room, BBQ grill, and pickleball; short-term rentals not allowed; pets allowed
Exterior
- Parking: Attached 2-car garage; Driveway with 2 spaces
- Security: Security system; Smoke detectors
- Utilities: Public water; Public sewer; Electric service; TV cable available; Phone service available; Underground utilities
- Home design: Single-story Craftsman-style home; Built in 2023; Zoned for single-family residential; Lot approx. 0.19 acre (65 x 125)
- Construction: Vinyl siding and trim; Shingle roof; Slab foundation
- Exterior features: Private yard; Privacy fencing; Open patio; Open porch; Paved road access; Sidewalks; Covenants and restrictions
Interior
- Kitchen: Dishwasher; Disposal; Microwave; Refrigerator; Kitchen island
- Bedrooms: 4 bedrooms (all on the first floor); Primary bedroom with double vanity, shower (no tub) and walk-in closet
- Flooring: Vinyl; Carpet
- Bathrooms: 2 full bathrooms
- Heating & cooling: Central heating; Central air conditioning; Electric heat control
- Interior features: Kitchen island; Living room on the first floor; Kitchen on the first floor
- Laundry & utility: Washer; Dryer; Electric water heater
Neighborhood map
What this means for you Summary
Snapshot
- This is a 4-bed/2.0-bath single-family listed at $289k. Condition is rated good.
Deal economics
- At list price, monthly cash flow is $-67 ($-806/yr) — negative.
- To cash-flow at today's rent, offer at most $277k (4.1% below list).
- To meet the 1% rule (rent ≥ 1% of price), the offer needs to be $242k (16.3% below list).
- Recommended offer: $242k (16.3% below list) — sets the bar for 1% rule.
- Cap rate 6.0% vs local median 4.7% in Panama City — meaningfully above typical; check what's discounted (condition, days-on-market, listing class) to confirm the premium yield is real.
Location & tenants
- Location reads 72/100 on livability (#350 in FL) — a middle-class / working-renter tenant base. Strengths: cost of living A+, housing A+, health & safety A+; Watch: crime F, amenities F, commute F.
- Bay (suburban): math 51% / reading 51% proficiency, ranked #29 of 73 in FL (top 40%) — acceptable for families but not a draw, mixed tenant base, ~2y average lease.
- Zoned schools: Tommy Smith Elementary School (math 46% / reading 51%, grade D, #1,152 of 2,144 statewide, top 55%, 639 students, 53% FRL); Merritt Brown Middle School (math 38% / reading 38%, grade F, #388 of 571 statewide, top 69%, 701 students, 55% FRL); Rutherford High School (math 24% / reading 29%, grade F, #489 of 667 statewide, top 74%, 1,337 students, 63% FRL).
- Zoned-school proficiency averages 38% at this address vs 51% district-wide (-13 pts) — the specific schools serving this property underperform the Bay average; the district grade overstates school quality for this exact location.
- Market conditions: Rents rising (+1.1%/yr); 983 active listings in the ZIP; 2 comparable units currently listed for rent nearby; 2,473 units permitted in Bay County in 2024 (559 in 5+ unit buildings).
- This rent runs 39% of the median local income ($75k/yr) — at the standard rent-burdened threshold; future hikes will face affordability resistance.
Forward outlook
- Local home prices are declining (-3.0%/yr); year-one equity from $2k of loan paydown is wiped out by about $9k of value loss. Plan a longer hold.
- Bay County population projected at +24% by 2050 — long-run rental-demand tailwind backs the buy-and-hold thesis.
Negotiation context
- It's been on market 16 days — a 2% lower offer ($285k) is reasonable based on typical stale-listing flexibility.
- 3 sale attempts since 3y ago with the ask held roughly flat each time — persistent listings suggest the price (not the market) is what's stuck; bring a comps-based counter.
Risks & watch-outs
- Climate carrying-cost: severe wind risk, 99% chance of damaging wind over 30y; major wildfire risk; extreme-heat days projected 7→21/yr by 2055 (HVAC capex compounding) — expect insurance premiums to compound above CPI over the hold.
Questions for the listing agent
- What do current leases actually rent for vs. the listed asking? Can we see a recent rent roll and the last 12 months of T-12 income?
- What does the HOA fee cover, when was the last increase, and are there any pending special assessments or reserve-fund shortfalls?
- Is there a deadline driving the sale (1031 exchange, divorce, estate, relocation)? That informs how much negotiation room exists.
- Schools are B-rated — typically a magnet for longer-tenancy family renters. What's the average tenant stay here, and is there a school-zone premium baked into asking?
- Crime grade is F in this area — have there been break-ins, vandalism, or insurance claims at this property in the last 3 years? What carrier currently insures it and at what premium?
- The area grade is low — what's the realistic commute time and amenity access for the typical tenant pool here? Any planned neighborhood developments (good or bad) we should know about?
- What's the average days-on-market for RENTAL listings here right now (not sales)? A rising rental-DOM trend means longer vacancies and softer asking-rent achievability than the comps imply.
- What's the recent tenant-quality profile in this submarket — average credit score on applications, eviction rate, late-payment / NSF rate, and stable-employment percentage? A property-management company in the area should have these aggregated.
- How much new for-sale + rental construction is in the pipeline within 1–3 miles? Heavy new supply typically softens prices + rents 12–24 months out; constrained supply supports both.
Investment metrics
- 1% rule
- 0.84% ✗
- Cap rate
- 6.01%
- Cash-on-cash
- -1.00%
- DSCR
- 0.96
- GRM
- 10.0
CMA / ARV
- ARV (on-the-fly)
- $283,500
- Comps found
- 12
Show comp detail 12 sales within ~0.75 mi
| Address | Dist | Beds/Ba | Sqft | Sold | Price | $/sf | Match |
|---|---|---|---|---|---|---|---|
| 6380 Bellavia Ln | 0.06mi | 4/2.0 | 1,500 (0%) | 2mo | $270,000 | $180 | 95 |
| 6943 William Pitsenbarger Rd | 0.68mi | 4/2.0 | 1,458 (-3%) | 4mo | $273,900 | $188 | 60 |
| 6558 Canley Ct | 0.53mi | 3/2.0 (-1) | 1,383 (-8%) | 2mo | $267,500 | $193 | 56 |
| 6682 Atkins Rd | 0.69mi | 3/2.0 (-1) | 1,439 (-4%) | 2mo | $250,000 | $174 | 54 |
| 6998 William Pitsenbarger Rd | 0.72mi | 3/2.0 (-1) | 1,580 (+5%) | 1mo | $310,000 | $196 | 52 |
| 7074 Merlyn Dethlefsen Rd | 0.68mi | 3/2.0 (-1) | 1,580 (+5%) | 4mo | $289,900 | $183 | 51 |
| 6958 William Pitsenbarger Rd | 0.68mi | 3/2.0 (-1) | 1,580 (+5%) | 4mo | $299,900 | $190 | 51 |
| 7039 George Day Ln | 0.73mi | 3/2.0 (-1) | 1,580 (+5%) | 2mo | $299,400 | $189 | 51 |
| 6974 William Pitsenbarger Rd | 0.69mi | 3/2.0 (-1) | 1,580 (+5%) | 4mo | $309,900 | $196 | 50 |
| 7087 George Day Ln | 0.71mi | 3/2.0 (-1) | 1,580 (+5%) | 4mo | $279,900 | $177 | 50 |
| 7038 Merlyn Dethlefsen Rd | 0.74mi | 3/2.0 (-1) | 1,580 (+5%) | 2mo | $298,500 | $189 | 50 |
| 7043 George Day Ln | 0.74mi | 3/2.0 (-1) | 1,580 (+5%) | 3mo | $299,900 | $190 | 49 |
Match score weights: distance 35% · size 25% · config 20% · recency 20%. Top-matched comps best support the ARV.
Projected returns pro-forma
-3.0% appreciation · 1.12% rent growth · sell at horizon
- IRR
- -20.0%
- Equity multiple
- 0.31×
- Total profit
- $-55,573
- Equity at exit
- $43,091
- IRR
- -17.6%
- Equity multiple
- 0.12×
- Total profit
- $-71,546
- Equity at exit
- $24,987
Cash invested: $80,920 (down + closing). Projections, not guarantees.
Landlord ↔ Tenant lean methodology
- Overall (STATE)
- 87 Strongly Landlord-Friendly
- State Florida
- 87 Strongly Landlord-Friendly · R+3
- County
- — inherits STATE
- City
- — inherits STATE
ZIP-level market 32404
- Home prices YoY
- -16.1%
- Rents YoY
- 1.1%
- Active inventory
- 983
- Price-to-rent
- 10.0×
Monthly cashflow live
- Estimated rent
- $2,419 medium interval (Pro) →
- Mortgage (P&I)
- −$1,516
- Tax from tax record
- −$264 /mo · $3,172/yr
- Insurance
- −$120
- HOA
- −$78
- Vacancy / Maint / Mgmt
- −$508
- Net cashflow
- $-67
Break-even live
Sensitivity live
| Price | -10% $96 | -5% $15 | +0% $-67 | +5% $-149 | +10% $-231 |
|---|---|---|---|---|---|
| Rent | -10% $-258 | -5% $-163 | +0% $-67 | +5% $28 | +10% $124 |
| Rate | -1.0pp $78 | -0.5pp $6 | base $-67 | +0.5pp $-142 | +1.0pp $-218 |
UW: 25.0% down · 7.5% · 30yr · 1.5% tax · 5.0% vac · 8.0% maint · 8.0% mgmt
Financing live
Cash to close
- Down payment
- $72,250
- Closing costs
- $8,670
- Reserves months
- —
- Total cash needed
- —
Loan-product check · same deal, 3 products live
Conventional
25% down · 7.5% · 30yr
- Down + closing
- —
- Monthly P&I
- —
- Monthly cashflow
- —
- DSCR
- —
- Eligible?
- —
Personal DTI + credit; lowest rate.
DSCR
20% down · 8.5% · 30yr
- Down + closing
- —
- Monthly P&I
- —
- Monthly cashflow
- —
- DSCR
- —
- Eligible?
- —
No personal income docs; deal must DSCR.
Hard money
10% down · 12.0% · 12mo
- Down + closing
- —
- Monthly P&I
- —
- Monthly cashflow
- —
- DSCR
- —
- Eligible?
- —
Short-term bridge; refi at stabilization.
Rent comps 2 comps
| Address | Beds | Baths | Sqft | Rent | $/sqft | DOM | Units | Dist |
|---|---|---|---|---|---|---|---|---|
| 6416 Bellavia Ln Panama City, FL | 4.0 | 2.0 | 1812 | $2,100 | $1.16 | 15d | 1 | 0.09mi |
| 5284 Emma Grace Dr Panama City, FL | 3.0–5.0 | 2.0–3.0 | 2069 | $2,393 | $1.16 | 15d | 1 | 1.41mi |
HOA detail
- Monthly dues
- $78 · $936/yr
- Likely covers
- poolgym
Listing history 13 events
-
2026-06-21days on market $289,000 Active 16 DOM
-
2026-06-19days on market $289,000 Active 14 DOM
-
2026-06-18days on market $289,000 Active 13 DOM
-
2026-06-17days on market $289,000 Active 12 DOM
-
2026-06-16days on market $289,000 Active 11 DOM
-
2026-06-15days on market $289,000 Active 10 DOM
-
2026-06-14days on market $289,000 Active 8 DOM
-
2026-06-13pricedays on market $289,000 Active 7 DOM
-
2026-06-10days on market $290,000 Active 5 DOM
-
2026-06-09days on market $290,000 Active 4 DOM
-
2026-06-08days on market $290,000 Active 3 DOM
-
2026-06-07remarks 699-char remark
-
2026-06-07$290,000 Active 2 DOM
ⓘ Source: listings_history table (triggers on properties + properties_extension) + one-shot
backfill from property_details.listing_events for pre-trigger history.
Tax reassessment forecast FL · Resets to sale price
- Current annual tax
- $3,172 · $264/mo
- Projected year-2 tax
- $3,172 · $264/mo
- Expected delta
- $0/yr ($0/mo · 0.0%)
ⓘ Screening estimate from a state-policy table — verify with the county assessor before closing.
Climate risk First Street
- Flood 1/10 Low FEMA zone X (unshaded) · 0% chance over 30 yrs
- Wildfire 6/10 Major
- Heat 10/10 Extreme 7 d/yr ≥105°F today · 21 d/yr by 30 yrs out
- Wind 9/10 Extreme 99% chance of damaging wind over 30 yrs
- Air quality 1/10 Low 0 unhealthy d/yr today · 0 by 30 yrs out
Nearby sold comps map
Loading sold comps map…
Walkable amenities ~0.75 mi
Loading nearby amenities…
Taxation est. · year 1
- Rental income
- $29,030
- − Mortgage interest
- −$16,188
- − Property taxes
- −$3,172
- − Insurance
- −$1,445
- − Repairs & maintenance
- −$2,322
- − Management
- −$2,322
- − HOA
- −$936
- − Depreciation
- −$8,407
- Taxable loss
- −$5,763
- Est. tax savings @ 24.0%
- +$1,383
- After-tax cash flow
- $578/yr
For passive investors: Depreciation is non-cash, so a rental often shows a tax loss while cash-flowing — sheltering income. Rental losses are passive: they offset passive income freely, and up to $25,000/yr can offset ordinary (W-2) income if you actively participate and your MAGI is under $100k (phasing out to $0 by $150k); unused losses carry forward. On sale, claimed depreciation is recaptured at up to 25%, and gains may owe capital-gains tax (a 1031 exchange can defer both). Figures are a year-1 estimate at your 24.0% rate — not tax advice; consult a CPA.
Condition & rehab AI · 12 photos
This well-maintained single-family home in Panama City offers a good condition with a good condition score of 80. It is ready for a cosmetic rehab to enhance curb appeal and add smart home features.
Value-add opportunities
- Resale paint exterior — enhances curb appeal
- Both landscape and add privacy fencing — improves curb appeal and provides privacy
- Both install smart home features — attracts tech-savvy buyers and renters
Renovation cost estimate screening
Value-add ROI direction
- Resale paint exterior — enhances curb appeal ↑
- Both landscape and add privacy fencing — improves curb appeal and provides privacy ↑
- Both install smart home features — attracts tech-savvy buyers and renters ↑
ⓘ Cost ranges are severity-bucket heuristics (US national rule-of-thumb). Get contractor quotes + a written scope before underwriting a rehab budget.
Schools (NCES district)
- District
- Bay
- NCES district ID
- 1200090
- Math proficiency
- 51% ▼ -8.00%
- Reading proficiency
- 51% ▼ -7.00%
- Median HH income
- $47,740
- Composite
- 43.41/100
- National rank
- #3014
- State rank
- #29 of 73 in FL
Livability — Panama City
- Score
- 72/100
- State rank
- #350
- US rank
- #5823
Category grades
Schools grade is shown separately in the Schools card above.
Census & demographics
- Census place
- Panama City, FL
- County
- Bay County · 163,593 people
- City population
- 91,445
- Metro
- Panama City, FL
- Population (ZIP)
- 42,514
- Household income
- $74,708
- Rent vs Own
- Severe rent burden
- 1218.0
Population outlook (Bay County) Hauer SSP2
- Today (2025)
- 206,264 people
- By 2030
- 217,740 · +5.6%
- By 2040
- 238,738 · +15.7%
- By 2050
- 255,545 · +23.9%
- By 2075
- 288,295 · +39.8%
- By 2100
- 288,638 · +39.9%
Race, ethnicity, and origin ACS 2023
- Neighborhood character
- Predominantly White (69%)
- Race & ethnicity
- White 69% Black 12% Two or more races 10% Hispanic / Latino 9% Asian 3%
- Hispanic origin (detail)
- Mexican 2% Puerto Rican 3%
- Common ancestry
- Lithuanian 3% Slovak 2% Italian 2%
- Foreign-born
- 7% · Canada, Vietnam, Mexico
- Languages at home
- 90% English-only · Spanish 6% Vietnamese 1% Other Asian/Pacific 1%
Political lean MEDSL · Bay
- 2024 margin
- Solid R (+47.4) · D 25.8% · R 73.1% · Other 1.1%
- 2008→2024 swing
- -6.6pp toward R · 2008: -40.7pp · 2024: -47.4pp
- All cycles
- 2024: R+47.4 2020: R+43.5 2016: R+46.3 2012: R+43.6 2008: R+40.7
Not yet ingested
- Civics
- —
Market trends
- HPI YoY
- ▼ -50.59%
- Current HPI
- 263.7178
- Rent YoY
- ▲ 1.12%
- Metro
- Panama City, FL
- State GDP YoY
- ▲ 3.28%
- F500 in state
- 36
Industry mix (Fortune 500 HQ in FL)
| Industry | F500 HQs | Revenue |
|---|---|---|
| Industrial Technology | 2 | $29B |
|
||
| Insurance | 2 | $17B |
|
||
| Retail | 1 | $60B |
|
||
| Technology Distribution | 1 | $58B |
|
||
| Homebuilding | 1 | $35B |
|
||
| Technology Manufacturing | 1 | $35B |
|
||
Price history
-6.1% since first listed10 events — show timeline
- 2026-06-05 Listed $290,000 ECAR
- 2026-06-05 Listed $290,000 CPARMLS
- 2023-07-13 Sold (MLS) $281,400 CPARMLS
- 2023-06-15 Pending — CPARMLS
- 2023-06-06 Price Changed $281,400 CPARMLS
- 2023-05-25 Price Changed $280,400 CPARMLS
- 2023-05-03 Price Changed $292,900 CPARMLS
- 2023-04-25 Price Changed $308,900 CPARMLS
- 2023-04-22 Price Changed $269,900 CPARMLS
- 2023-03-27 Listed $308,900 CPARMLS
Property tax history
+264.6%/yrLatest (2025): $3,172 · +3.8% YoY. Source: county tax records.
Cash-flow waterfall
monthlySold comps — $/sqft
last 12 mo · ≤1 miLoading sold comps…