219 Cumberland Trl · Runaway Bay, TX
Flood risk No data
- FEMA flood zone
- —
- Chance of flooding over 30 yrs
- —
- Est. flood insurance / yr
- —
Fire risk No data
- Est. fire insurance / yr
- —
Heat risk No data
- Hot days now (above threshold)
- —
- Hot days in 30 yrs
- —
Wind risk No data
- Chance of severe wind over 30 yrs
- —
Air-quality risk No data
- Unhealthy air days now
- —
- Unhealthy air days in 30 yrs
- —
Risk factors via First Street. Map © Google.
Why this score? — see what drove the C grade
The composite is a weighted blend of 9 inputs, each scored 0–100. Each bar is that input's sub-score; the figure is the points it added to the 100-point composite (weight × sub-score).
- Cash flow +15.3/30.0
- ARV discount +15.0/15.0
- DSCR +4.7/10.0
- Appreciation +4.6/10.0
- 1% rule +4.2/10.0
- Condition / age +4.0/5.0
- Schools +3.6/10.0
- Livability +3.4/5.0
- Rent growth +2.5/5.0
$149,000
🖨 Deal sheet 📄 Offer letter ✓ Due diligence
Listing remarks
Charming, fully updated Texas home on approximately ¼ acre offering the perfect blend of comfort, affordability, and peaceful living. Whether you’re searching for a starter home, weekend lake retreat, retirement escape, investment opportunity, or a place to simplify life without giving up outdoor space, this move-in ready property delivers the lifestyle buyers are searching for in today’s North Texas market. This home is close to Lake Bridgeport!! Picture yourself enjoying quiet mornings with coffee under the Texas sky, maybe evenings around a firepit, space for pets or gardening, and the freedom that comes with owning your own piece of land. The oversized lot offers r
Key facts
- Updated texas home
- Oversized lot
- Open concept layout
Tags
Property features AI
Finance
- Other: Lake access: Bridgeport (dock not permitted); Horse not permitted
- Financial info: Listing acceptable for Cash, Conventional, FHA, USDA, VA and other loan types
- HOA & community: No association
Exterior
- Parking: Covered detached carport; Carport with 3 covered spaces; Gravel/unpaved parking (no garage)
- Security: Smoke detector(s)
- Utilities: City water; City sewer; Electricity connected; Not in a municipal utility district
- Home design: Single family residence; One story; Property attached: Yes; Subdivision: Runaway Bay; Built in 2023; Preowned
- Construction: Board & batten siding and wood construction; Metal and shingle roof; Pillar/post/pier foundation
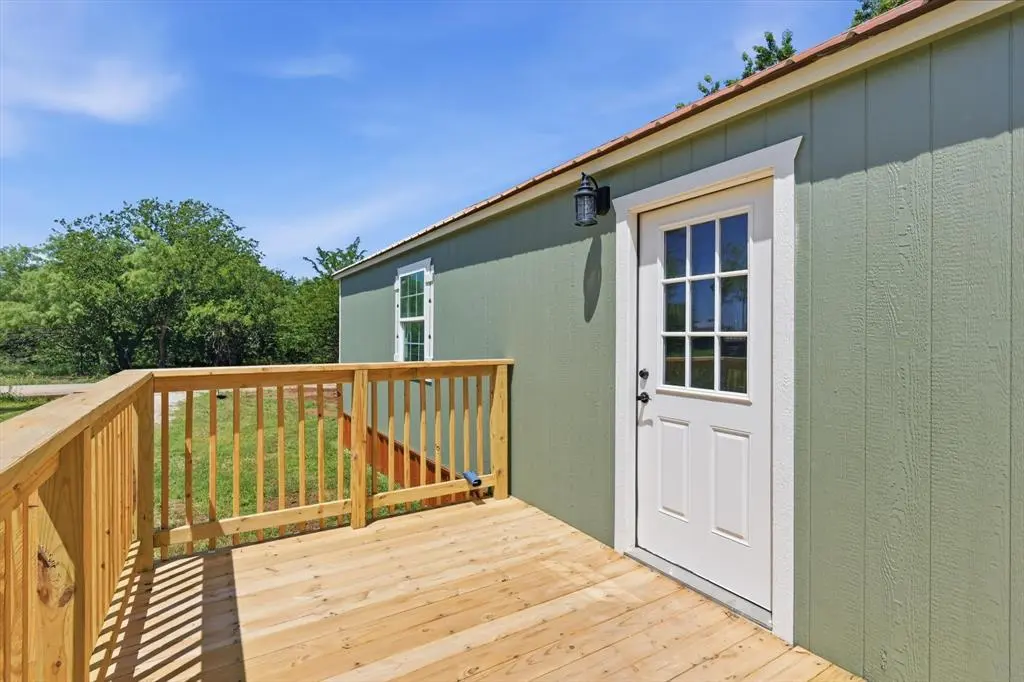
- Exterior features: Deck; Chain link and partial fencing; Cleared lot with few trees; Interior lot in a subdivision; Other exterior structures
Interior
- Kitchen: Dishwasher; Electric oven; Electric range
- Bedrooms: Primary bedroom on main level with walk-in closet and separate shower; Second bedroom on main level (10 x 10)
- Flooring: Laminate flooring
- Bathrooms: Two full bathrooms; Primary bathroom ensuite with separate shower; Second bathroom ensuite with separate shower
- Heating & cooling: Electric heating; Ceiling fan(s); Wall unit(s) for cooling
- Interior features: Open floorplan; Vaulted ceilings; Walk-in closet(s); One living area; One dining area; 7 total rooms
- Laundry & utility: Stacked washer/dryer area on site; Other laundry area
Neighborhood map
What this means for you Summary
Snapshot
- This is a 2-bed/2.0-bath single-family listed at $149k. Condition is rated good.
Deal economics
- At list price, monthly cash flow is $55 ($665/yr) — positive.
- The deal already cash-flows at list — no discount required.
- To meet the 1% rule (rent ≥ 1% of price), the offer needs to be $137k (7.8% below list).
- Recommended offer: $137k (7.8% below list) — sets the bar for 1% rule.
- Cap rate 6.7% vs local median 2.9% in Runaway Bay — top-decile yield for the area; either an underpriced asset or a hidden risk that comps aren't pricing in. Stress-test before assuming the spread holds.
Location & tenants
- Location reads 68/100 on livability (#491 in TX) — a middle-class / working-renter tenant base. Strengths: crime A+, cost of living A+, housing A+; Watch: health & safety D+, amenities F, commute F.
- Bridgeport ISD (rural): math 41% / reading 41% proficiency, ranked #356 of 826 in TX (top 43%) — families likely to look elsewhere, expect single-tenant / working-renter base with shorter leases.
- Zoned schools: Bridgeport El (523 students, 70% FRL) — zoned schools average 70% FRL vs 50% district-wide (20 pts higher); higher-poverty schools than district average — tighter screening recommended.
- Market conditions: 338 active listings in the ZIP; 1 comparable units currently listed for rent nearby; solid renter incomes; 460 units permitted in Wise County in 2024 (243 in 5+ unit buildings).
- This rent is only 18% of the median local income ($92k/yr) — well below the 30% rent-burden line; pricing power to push rent on renewal without tenant pushback.
Forward outlook
- Local home prices are declining (-0.8%/yr); year-one equity from $1k of loan paydown is wiped out by about $1k of value loss. Plan a longer hold.
- Wise County population projected at +27% by 2050 — long-run rental-demand tailwind backs the buy-and-hold thesis.
Negotiation context
- It's been on market 35 days — a 3% lower offer ($145k) is reasonable based on typical stale-listing flexibility.
Questions for the listing agent
- It's been on market 35 days. Have you received any prior offers? Is the seller open to a 8% concession, seller financing, or rate buy-down credit?
- Is there a deadline driving the sale (1031 exchange, divorce, estate, relocation)? That informs how much negotiation room exists.
- Schools are D-rated, which usually means shorter tenancies and higher turnover. Who's the typical renter profile here, and what's been the actual vacancy rate?
- What's the average days-on-market for RENTAL listings here right now (not sales)? A rising rental-DOM trend means longer vacancies and softer asking-rent achievability than the comps imply.
- What's the recent tenant-quality profile in this submarket — average credit score on applications, eviction rate, late-payment / NSF rate, and stable-employment percentage? A property-management company in the area should have these aggregated.
- How much new for-sale + rental construction is in the pipeline within 1–3 miles? Heavy new supply typically softens prices + rents 12–24 months out; constrained supply supports both.
Investment metrics
- 1% rule
- 0.92% ✗
- Cap rate
- 6.74%
- Cash-on-cash
- 1.59%
- DSCR
- 1.07
- GRM
- 9.0
CMA / ARV
- ARV (median comp)
- $214,037
- List price
- $149,000
- Delta
- -30.39%
- Verdict
- UNDERPRICED
- Comps
- 10 within 1.0 mi
Show comp detail 1 sale within ~0.75 mi
| Address | Dist | Beds/Ba | Sqft | Sold | Price | $/sf | Match |
|---|---|---|---|---|---|---|---|
| 380 Cimmarron Trl | 0.44mi | 2/1.0 | 880 (-6%) | 7mo | $167,000 | $190 | 60 |
Match score weights: distance 35% · size 25% · config 20% · recency 20%. Top-matched comps best support the ARV.
Projected returns pro-forma
-0.82% appreciation · 3.0% rent growth · sell at horizon
- IRR
- -3.5%
- Equity multiple
- 0.85×
- Total profit
- $-6,459
- Equity at exit
- $37,255
- IRR
- 3.1%
- Equity multiple
- 1.30×
- Total profit
- $12,399
- Equity at exit
- $40,230
Cash invested: $41,720 (down + closing). Projections, not guarantees.
Landlord ↔ Tenant lean methodology
- Overall (STATE)
- 87 Strongly Landlord-Friendly
- State Texas
- 87 Strongly Landlord-Friendly · R+5
- County
- — inherits STATE
- City
- — inherits STATE
ZIP-level market 76426
- Home prices YoY
- -0.2%
- Active inventory
- 338
- Price-to-rent
- 9.0×
Monthly cashflow live
- Estimated rent
- $1,374 medium interval (Pro) →
- Mortgage (P&I)
- −$781
- Tax est. 1.5%
- −$186 /mo · $2,235/yr
- Insurance
- −$62
- HOA
- −$0
- Vacancy / Maint / Mgmt
- −$288
- Net cashflow
- $55
Break-even live
UW: 25.0% down · 7.5% · 30yr · 1.5% tax · 5.0% vac · 8.0% maint · 8.0% mgmt
Financing live
Cash to close
- Down payment
- $37,250
- Closing costs
- $4,470
- Reserves months
- —
- Total cash needed
- —
Loan-product check · same deal, 3 products live
Conventional
25% down · 7.5% · 30yr
- Down + closing
- —
- Monthly P&I
- —
- Monthly cashflow
- —
- DSCR
- —
- Eligible?
- —
Personal DTI + credit; lowest rate.
DSCR
20% down · 8.5% · 30yr
- Down + closing
- —
- Monthly P&I
- —
- Monthly cashflow
- —
- DSCR
- —
- Eligible?
- —
No personal income docs; deal must DSCR.
Hard money
10% down · 12.0% · 12mo
- Down + closing
- —
- Monthly P&I
- —
- Monthly cashflow
- —
- DSCR
- —
- Eligible?
- —
Short-term bridge; refi at stabilization.
Rent comps 1 comps
| Address | Beds | Baths | Sqft | Rent | $/sqft | DOM | Units | Dist |
|---|---|---|---|---|---|---|---|---|
| 1210 Chestnut Ct Unit 1 Runaway Bay, TX | 2.0 | 2.5 | 1079 | $1,800 | $1.67 | 43d | 1 | 0.69mi |
Listing history 16 events
-
2026-06-17status $149,000 Pending 35 DOM
-
2026-06-17days on market $149,000 Active Option Contract 35 DOM
-
2026-06-16days on market $149,000 Active Option Contract 34 DOM
-
2026-06-15days on market $149,000 Active Option Contract 33 DOM
-
2026-06-13days on market $149,000 Active Option Contract 31 DOM
-
2026-06-13days on market $149,000 Active Option Contract 30 DOM
-
2026-06-10status $149,000 Active Option Contract 27 DOM
-
2026-06-09days on market $149,000 Active 27 DOM
-
2026-06-08days on market $149,000 Active 26 DOM
-
2026-06-07days on market $149,000 Active 25 DOM
-
2026-06-04days on market $149,000 Active 22 DOM
-
2026-06-03days on market $149,000 Active 21 DOM
-
2026-06-02days on market $149,000 Active 20 DOM
-
2026-06-01days on market $149,000 Active 19 DOM
-
2026-05-31days on market $149,000 Active 18 DOM
-
2026-05-13$149,000 Active 1786-char remark
ⓘ Source: listings_history table (triggers on properties + properties_extension) + one-shot
backfill from property_details.listing_events for pre-trigger history.
Nearby sold comps map
Loading sold comps map…
Walkable amenities ~0.75 mi
Loading nearby amenities…
Taxation est. · year 1
- Rental income
- $16,482
- − Mortgage interest
- −$8,346
- − Property taxes
- −$2,235
- − Insurance
- −$745
- − Repairs & maintenance
- −$1,319
- − Management
- −$1,319
- − Depreciation
- −$4,335
- Taxable loss
- −$1,816
- Est. tax savings @ 24.0%
- +$436
- After-tax cash flow
- $1,100/yr
For passive investors: Depreciation is non-cash, so a rental often shows a tax loss while cash-flowing — sheltering income. Rental losses are passive: they offset passive income freely, and up to $25,000/yr can offset ordinary (W-2) income if you actively participate and your MAGI is under $100k (phasing out to $0 by $150k); unused losses carry forward. On sale, claimed depreciation is recaptured at up to 25%, and gains may owe capital-gains tax (a 1031 exchange can defer both). Figures are a year-1 estimate at your 24.0% rate — not tax advice; consult a CPA.
Condition & rehab AI · 18 photos
This move-in ready home offers a charming and fully updated Texas living experience with modern amenities and a peaceful outdoor setting.
Value-add opportunities
- Both landscaping — enhances curb appeal and outdoor living space
- Both furniture — improves living space and comfort
- Both smart home integration — enhances convenience and energy efficiency
Renovation cost estimate screening
Value-add ROI direction
- Both landscaping — enhances curb appeal and outdoor living space ↑
- Both furniture — improves living space and comfort ↑
- Both smart home integration — enhances convenience and energy efficiency ↑
ⓘ Cost ranges are severity-bucket heuristics (US national rule-of-thumb). Get contractor quotes + a written scope before underwriting a rehab budget.
Schools (NCES district)
- District
- Bridgeport ISD
- NCES district ID
- 4811340
- Math proficiency
- 41% ▼ -4.00%
- Reading proficiency
- 41% ▲ 3.00%
- Median HH income
- $51,866
- Composite
- 35.51/100
- National rank
- #4913
- State rank
- #356 of 826 in TX
Livability — Runaway Bay
- Score
- 68/100
- State rank
- #491
- US rank
- #9730
Category grades
Schools grade is shown separately in the Schools card above.
Census & demographics
- County
- Wise County · 49,037 people
- Metro
- Dallas-Fort Worth-Arlington, TX
- Population (ZIP)
- 11,632
- Household income
- $92,130
- Rent vs Own
- Severe rent burden
- 74.0
Population outlook (Wise County) Hauer SSP2
- Today (2025)
- 71,620 people
- By 2030
- 75,858 · +5.9%
- By 2040
- 83,908 · +17.2%
- By 2050
- 90,717 · +26.7%
- By 2075
- 107,583 · +50.2%
- By 2100
- 114,996 · +60.6%
Race, ethnicity, and origin ACS 2023
- Neighborhood character
- Majority White (60%)
- Race & ethnicity
- White 60% Hispanic / Latino 32% Two or more races 9% Black 2% Asian 1% Native American 1%
- Hispanic origin (detail)
- Mexican 31%
- Common ancestry
- Slovak 1% Lithuanian 1% Romanian 1%
- Foreign-born
- 14% · Canada, Vietnam
- Languages at home
- 72% English-only · Spanish 27%
Political lean MEDSL · Wise
- 2024 margin
- Solid R (+70.0) · D 14.7% · R 84.7%
- 2008→2024 swing
- -14.3pp toward R · 2008: -55.7pp · 2024: -70.0pp
- All cycles
- 2024: R+70.0 2020: R+68.2 2016: R+69.9 2012: R+67.5 2008: R+55.7
Not yet ingested
- Civics
- —
Market trends
- HPI YoY
- ▼ -0.82%
- Current HPI
- 417.89
- Rent YoY
- —
- Metro
- Dallas-Fort Worth-Arlington, TX
- State GDP YoY
- ▲ 3.95%
- F500 in state
- 110
Industry mix (Fortune 500 HQ in TX)
| Industry | F500 HQs | Revenue |
|---|---|---|
| Energy | 16 | $1,198B |
|
||
| Technology | 5 | $198B |
|
||
| Engineering / Construction | 4 | $72B |
|
||
| Energy Services | 3 | $60B |
|
||
| Utilities | 3 | $41B |
|
||
| Healthcare | 2 | $330B |
|
||
Price history
3 events — show timeline
- 2026-06-17 Pending — NTREIS
- 2026-06-10 Contingent — NTREIS
- 2026-05-13 Listed $149,000 NTREIS
Cash-flow waterfall
monthlySold comps — $/sqft
last 12 mo · ≤1 miLoading sold comps…