1715 Nelson Ave Unit 5G · New York, NY
Flood risk 1/10 · Minimal
- FEMA flood zone
- X (unshaded)
- Chance of flooding over 30 yrs
- 0.0%
- Est. flood insurance / yr
- $507 – $1,088
Fire risk 1/10 · Minimal
- Est. fire insurance / yr
- $691 – $1,283
Heat risk 6/10 · Moderate
- Hot days now (above 99°F)
- 7 days/yr
- Hot days in 30 yrs
- 14 days/yr
Wind risk 6/10 · Moderate
- Chance of severe wind over 30 yrs
- 27.0%
Air-quality risk 4/10 · Minor
- Unhealthy air days now
- 5 days/yr
- Unhealthy air days in 30 yrs
- 6 days/yr
Risk factors via First Street. Map © Google.
Why this score? — see what drove the A- grade
The composite is a weighted blend of 9 inputs, each scored 0–100. Each bar is that input's sub-score; the figure is the points it added to the 100-point composite (weight × sub-score).
- Cash flow +30.0/30.0
- 1% rule +10.0/10.0
- DSCR +10.0/10.0
- Appreciation +10.0/10.0
- ARV discount +7.5/15.0
- Schools +5.0/10.0
- Livability +3.8/5.0
- Rent growth +2.5/5.0
- Condition / age +2.2/5.0
$128,000
🖨 Deal sheet 📄 Offer letter ✓ Due diligence
Listing remarks MLS
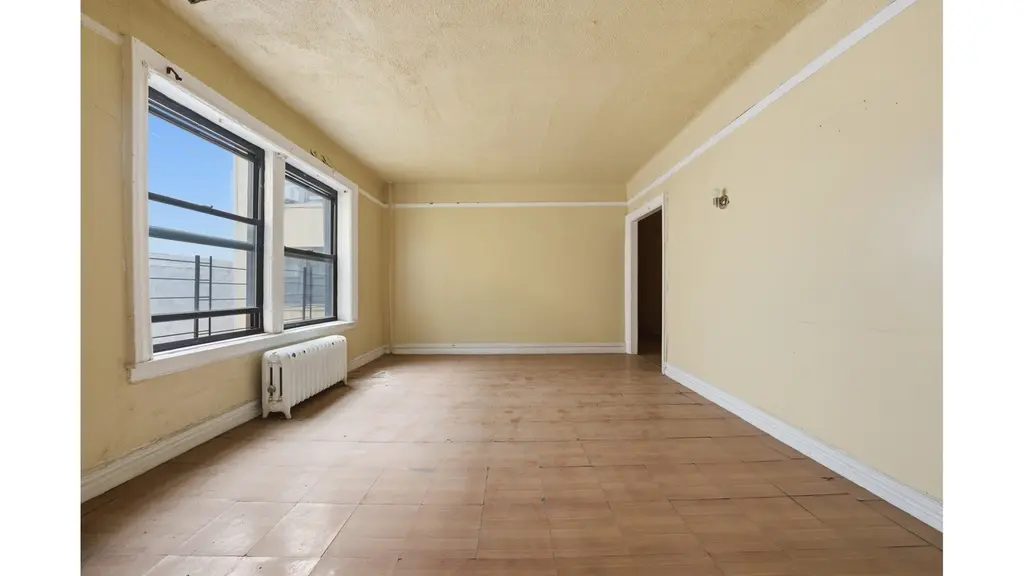
Spacious pre-war two-bedroom co-op bursting with classic charm & light! Oversized rooms, an eat-in kitchen, abundant closets, and beautiful original details throughout offer a timeless foundation ready for your vision. Set in an elevator HFDC building in the heart of Morris Heights, close to Manhattan with easy access to the 4 train, shopping, dining, and major highways. A true opportunity to restore and personalize-bring your creativity! Needs TLC. CASH ONLY! HDFC Maximum Income Requirements: $86,000 for 1 occupant; $102,000 for 2 occupants.
Key facts
- Original details
- Eat-in kitchen
- Elevator building
Tags
Property features AI
Exterior
- Parking: On-street parking
- Utilities: Public sewer; Cable available; Electricity connected; Sewer connected; Public trash collection; Water connected
- Home design: Stock cooperative; Entry on level 5
- Construction: Brick exterior
- Exterior features: Brick construction; Not waterfront
Interior
- Kitchen: Electric cooktop; Electric oven; Electric range; Refrigerator
- Bedrooms: 5th floor entry level
- Flooring: Hardwood
- Bathrooms: 1 full bathroom
- Heating & cooling: Oil heating; Wall/window air conditioning unit(s); Other heating
- Interior features: Eat-in kitchen; Entrance foyer; High ceilings; Natural woodwork; Original details; Other interior features
- Laundry & utility: Pets allowed (cats; contact for details)
Neighborhood map
What this means for you Summary
Snapshot
- This is a 2-bed/1.0-bath condo listed at $128k. Condition is rated fair.
Deal economics
- At list price, monthly cash flow is $2k ($29k/yr) — positive.
- The deal already cash-flows at list — no discount required.
- Meets the 1% rule at list price ($4k rent vs $128k).
- Recommended offer: $120k (6.0% below list) — sets the bar for market timing.
- Cap rate 28.7% vs local median 2.6% in New York — top-decile yield for the area; either an underpriced asset or a hidden risk that comps aren't pricing in. Stress-test before assuming the spread holds.
Location & tenants
- Location reads 75/100 on livability (#268 in NY, #4,188 nationally) — a middle-class / working-renter tenant base. Strengths: amenities A+, commute A+, health & safety A; Watch: crime F, cost of living F.
- Market conditions: 34 active listings in the ZIP; 2 comparable units currently listed for rent nearby; lower-income renter base — watch delinquency; 6,929 units permitted in Bronx County in 2024 (6,829 in 5+ unit buildings).
- At $4,145/mo this rent would consume 150% of the median local household income ($33k/yr) (locally 10286% of renters already pay >50% of income on rent) — very limited rent-growth headroom before tenants either downsize or default.
Forward outlook
- In year one you build about $14k of equity ($885 loan paydown + $13k appreciation (10.0% local appreciation)).
- Bronx County population projected at +21% by 2050 — long-run rental-demand tailwind backs the buy-and-hold thesis.
- At projected returns (10.0% appreciation + 3.0% rent growth), your $36k cash investment doubles in ~1 year — after that, you're playing with house money.
- By year 3, paydown + projected appreciation supports a ~$35k cash-out refi (75% LTV) — recoverable capital for the next deal without selling this one.
Negotiation context
- It's been on market 64 days — a 6% lower offer ($120k) is reasonable based on typical stale-listing flexibility.
- 2 sale attempts with the ask held roughly flat each time — persistent listings suggest the price (not the market) is what's stuck; bring a comps-based counter.
Risks & watch-outs
- Watch-outs: built in 1927 — expect roof / HVAC / electrical / plumbing capex.
- Climate carrying-cost: major wind risk, 27% chance of damaging wind over 30y; extreme-heat days projected 7→14/yr by 2055 (HVAC capex compounding) — expect insurance premiums to compound above CPI over the hold.
Questions for the listing agent
- It's been on market 64 days. Have you received any prior offers? Is the seller open to a 6% concession, seller financing, or rate buy-down credit?
- Have any recent inspections been done? Can we get a copy of the seller's disclosures and any deferred-maintenance estimates?
- Built in 1927 — when were the roof, HVAC, electrical panel, plumbing, and water heater last replaced?
- Any open or pending special assessments — roof, HVAC, plumbing, elevator, façade? What's the per-unit balance and payoff schedule, and is the seller paying it off at close or rolling it to the buyer?
- Why hasn't it sold? Are there any deal-killer items the seller is aware of (foundation, flood, title, zoning, code violations)?
- Is there a deadline driving the sale (1031 exchange, divorce, estate, relocation)? That informs how much negotiation room exists.
- Schools are B-rated — typically a magnet for longer-tenancy family renters. What's the average tenant stay here, and is there a school-zone premium baked into asking?
- Crime grade is F in this area — have there been break-ins, vandalism, or insurance claims at this property in the last 3 years? What carrier currently insures it and at what premium?
- What's the average days-on-market for RENTAL listings here right now (not sales)? A rising rental-DOM trend means longer vacancies and softer asking-rent achievability than the comps imply.
- What's the recent tenant-quality profile in this submarket — average credit score on applications, eviction rate, late-payment / NSF rate, and stable-employment percentage? A property-management company in the area should have these aggregated.
- How much new apartment / multifamily construction is in the pipeline within 1–3 miles? Heavy new supply (>2% of stock underway) typically softens rents 12–24 months out; light construction supports rent growth.
Investment metrics
- 1% rule
- 3.24% ✓
- Cap rate
- 28.70%
- Cash-on-cash
- 80.02%
- DSCR
- 4.56
- GRM
- 2.6
CMA / ARV
No comps found within radius.
Projected returns pro-forma
10.0% appreciation · 3.0% rent growth · sell at horizon
- IRR
- 90.0%
- Equity multiple
- 7.19×
- Total profit
- $221,990
- Equity at exit
- $115,313
- IRR
- 84.7%
- Equity multiple
- 15.90×
- Total profit
- $534,148
- Equity at exit
- $248,676
Cash invested: $35,840 (down + closing). Projections, not guarantees.
Landlord ↔ Tenant lean methodology
- Overall (CITY)
- 0 Strongly Tenant-Friendly
- State New York
- 15 Strongly Tenant-Friendly · D+10
- County
- — inherits STATE
- City New York
- 0 Strongly Tenant-Friendly · D+34
ZIP-level market 10453
- Home prices YoY
- 4.2%
- Active inventory
- 34
- Price-to-rent
- 2.6×
Monthly cashflow live
- Estimated rent
- $4,145 medium interval (Pro) →
- Mortgage (P&I)
- −$671
- Tax est. 1.5%
- −$160 /mo · $1,920/yr
- Insurance
- −$53
- HOA
- −$0
- Vacancy / Maint / Mgmt
- −$870
- Net cashflow
- $2,390
Break-even live
UW: 25.0% down · 7.5% · 30yr · 1.5% tax · 5.0% vac · 8.0% maint · 8.0% mgmt
Financing live
Cash to close
- Down payment
- $32,000
- Closing costs
- $3,840
- Reserves months
- —
- Total cash needed
- —
Loan-product check · same deal, 3 products live
Conventional
25% down · 7.5% · 30yr
- Down + closing
- —
- Monthly P&I
- —
- Monthly cashflow
- —
- DSCR
- —
- Eligible?
- —
Personal DTI + credit; lowest rate.
DSCR
20% down · 8.5% · 30yr
- Down + closing
- —
- Monthly P&I
- —
- Monthly cashflow
- —
- DSCR
- —
- Eligible?
- —
No personal income docs; deal must DSCR.
Hard money
10% down · 12.0% · 12mo
- Down + closing
- —
- Monthly P&I
- —
- Monthly cashflow
- —
- DSCR
- —
- Eligible?
- —
Short-term bridge; refi at stabilization.
Rent comps 2 comps
| Address | Beds | Baths | Sqft | Rent | $/sqft | DOM | Units | Dist |
|---|---|---|---|---|---|---|---|---|
| 405 W 206th St Unit 1202E New York, NY | 3.0 | 2.0 | 900 | $6,250 | $6.94 | 24d | 1 | 0.98mi |
| 40 Pinehurst Ave Ph 7B New York, NY | 2.0 | 2.0 | 1043 | $5,200 | $4.99 | 11d | 1 | 1.21mi |
HOA detail condo
- Monthly dues
- $0 · $0/yr
- Assessments
- None detected in remarks — confirm with the listing agent.
Listing history 13 events
-
2026-06-18days on market $128,000 Active 64 DOM
-
2026-06-17days on market $128,000 Active 63 DOM
-
2026-06-15days on market $128,000 Active 61 DOM
-
2026-06-13days on market $128,000 Active 59 DOM
-
2026-06-10days on market $128,000 Active 55 DOM
-
2026-06-08days on market $128,000 Active 54 DOM
-
2026-06-08days on market $128,000 Active 53 DOM
-
2026-06-04days on market $128,000 Active 50 DOM
-
2026-06-03days on market $128,000 Active 49 DOM
-
2026-06-01days on market $128,000 Active 47 DOM
-
2026-05-31days on market $128,000 Active 46 DOM
-
2026-04-22$128,000 Active 554-char remark
Show marketing remark (554 chars)
Spacious pre-war two-bedroom co-op bursting with classic charm & light! Oversized rooms, an eat-in kitchen, abundant closets, and beautiful original details throughout offer a timeless foundation ready for your vision. Set in an elevator HFDC building in the heart of Morris Heights, close to Manhattan with easy access to the 4 train, shopping, dining, and major highways. A true opportunity to restore and personalize-bring your creativity! Needs TLC. CASH ONLY! HDFC Maximum Income Requirements: $86,000 for 1 occupant; $102,000 for 2 occupants.
-
2026-04-07$128,000 Active
ⓘ Source: listings_history table (triggers on properties + properties_extension) + one-shot
backfill from property_details.listing_events for pre-trigger history.
Climate risk First Street
- Flood 1/10 Low FEMA zone X (unshaded) · 0% chance over 30 yrs
- Wildfire 1/10 Low
- Heat 6/10 Major 7 d/yr ≥99°F today · 14 d/yr by 30 yrs out
- Wind 6/10 Major 27% chance of damaging wind over 30 yrs
- Air quality 4/10 Moderate 5 unhealthy d/yr today · 6 by 30 yrs out
Nearby sold comps map
Loading sold comps map…
Walkable amenities ~0.75 mi
Loading nearby amenities…
Taxation est. · year 1
- Rental income
- $49,739
- − Mortgage interest
- −$7,170
- − Property taxes
- −$1,920
- − Insurance
- −$640
- − Repairs & maintenance
- −$3,979
- − Management
- −$3,979
- − Depreciation
- −$3,724
- Taxable income
- $28,327
- Est. tax owed @ 24.0%
- −$6,799
- After-tax cash flow
- $21,881/yr
For passive investors: Depreciation is non-cash, so a rental often shows a tax loss while cash-flowing — sheltering income. Rental losses are passive: they offset passive income freely, and up to $25,000/yr can offset ordinary (W-2) income if you actively participate and your MAGI is under $100k (phasing out to $0 by $150k); unused losses carry forward. On sale, claimed depreciation is recaptured at up to 25%, and gains may owe capital-gains tax (a 1031 exchange can defer both). Figures are a year-1 estimate at your 24.0% rate — not tax advice; consult a CPA.
Condition & rehab AI · 11 photos
This property requires moderate renovations to bring it up to modern standards, focusing on the kitchen and bathroom. The investment would significantly enhance its resale and rental value.
Repairs flagged
- Major kitchen cabinets — severe wear
- Major kitchen countertops — severe wear
- Major bathroom fixtures — dated and worn
- Major flooring — severe wear
Value-add opportunities
- Resale paint interior walls — enhances curb appeal
- Both replace kitchen cabinets and countertops — modernizes the space and improves functionality
- Both replace bathroom fixtures — modernizes the space and improves functionality
- Both replace flooring — modernizes the space and improves functionality
Renovation cost estimate screening
| Repair item | Severity | Est. cost |
|---|---|---|
| kitchen cabinets · severe wear | Major | $15,000–50,000 |
| kitchen countertops · severe wear | Major | $15,000–50,000 |
| bathroom fixtures · dated and worn | Major | $15,000–50,000 |
| flooring · severe wear | Major | $15,000–50,000 |
| Total estimated repair cost · 4 items | $60,000–200,000 |
Value-add ROI direction
- Resale paint interior walls — enhances curb appeal ↑
- Both replace kitchen cabinets and countertops — modernizes the space and improves functionality ↑
- Both replace bathroom fixtures — modernizes the space and improves functionality ↑
- Both replace flooring — modernizes the space and improves functionality ↑
ⓘ Cost ranges are severity-bucket heuristics (US national rule-of-thumb). Get contractor quotes + a written scope before underwriting a rehab budget.
Schools (NCES district)
No district data.
Livability — New York
- Score
- 75/100
- State rank
- #268
- US rank
- #4188
Category grades
Schools grade is shown separately in the Schools card above.
Census & demographics
- Census place
- New York, NY
- County
- Bronx County · 1,197,324 people
- City population
- 7,731,280
- Metro
- New York-Newark-Jersey City, NY-NJ-PA
- Population (ZIP)
- 76,282
- Household income
- $33,186
- Rent vs Own
- Severe rent burden
- 10286.0
Population outlook (Bronx County) Hauer SSP2
- Today (2025)
- 1,607,353 people
- By 2030
- 1,681,852 · +4.6%
- By 2040
- 1,824,421 · +13.5%
- By 2050
- 1,945,470 · +21.0%
- By 2075
- 2,187,887 · +36.1%
- By 2100
- 2,244,136 · +39.6%
Race, ethnicity, and origin ACS 2023
- Neighborhood character
- Predominantly Hispanic (67%)
- Race & ethnicity
- Hispanic / Latino 67% Black 26% Two or more races 17% White 2% Native American 2% Asian 1%
- Hispanic origin (detail)
- Mexican 4% Puerto Rican 13% Dominican 41%
- Foreign-born
- 44% · Canada, United Kingdom, Jamaica
- Languages at home
- 32% English-only · Spanish 58% French/Haitian/Cajun 2% Other Indo-European 1%
Political lean MEDSL · Bronx
- 2024 margin
- Solid D (+45.4) · D 72.7% · R 27.3%
- 2008→2024 swing
- -32.3pp toward R · 2008: 77.8pp · 2024: 45.4pp
- All cycles
- 2024: D+45.4 2020: D+67.6 2016: D+79.1 2012: D+82.9 2008: D+77.8
Not yet ingested
- Civics
- —
Market trends
- HPI YoY
- ▲ 14.52%
- Current HPI
- 361.6961
- Rent YoY
- —
- Metro
- New York-Newark-Jersey City, NY-NJ-PA
- State GDP YoY
- ▲ 2.60%
- F500 in state
- 92
Industry mix (Fortune 500 HQ in NY)
| Industry | F500 HQs | Revenue |
|---|---|---|
| Financial Services | 10 | $950B |
|
||
| Consumer Goods | 9 | $162B |
|
||
| Insurance | 4 | $225B |
|
||
| Telecommunications | 2 | $144B |
|
||
| Pharmaceuticals | 2 | $112B |
|
||
| Media / Entertainment | 2 | $69B |
|
||
Price history
+0.0% since first listed2 events — show timeline
- 2026-04-22 Listed $128,000 RLS at REBNY
- 2026-04-07 Listed $128,000 OneKey® MLS as Distributed by MLS Grid
Cash-flow waterfall
monthlySold comps — $/sqft
last 12 mo · ≤1 miLoading sold comps…