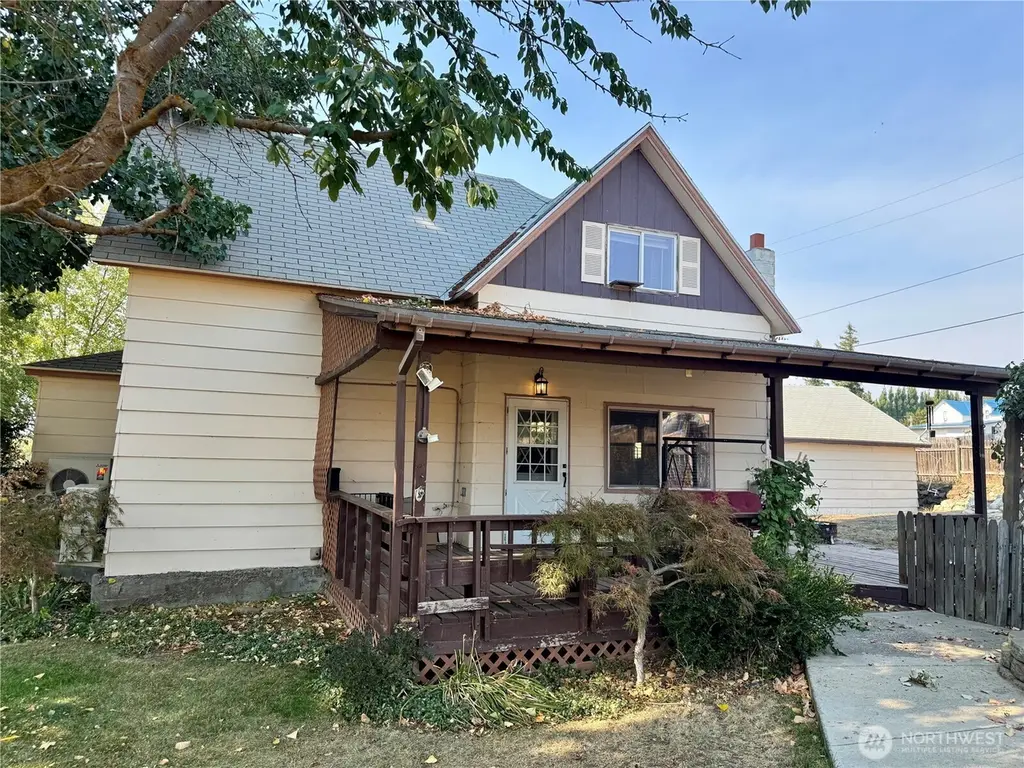
405 NW Dellah Ave · Wilbur, WA
Flood risk No data
- FEMA flood zone
- —
- Chance of flooding over 30 yrs
- —
- Est. flood insurance / yr
- —
Fire risk No data
- Est. fire insurance / yr
- —
Heat risk No data
- Hot days now (above threshold)
- —
- Hot days in 30 yrs
- —
Wind risk No data
- Chance of severe wind over 30 yrs
- —
Air-quality risk No data
- Unhealthy air days now
- —
- Unhealthy air days in 30 yrs
- —
Risk factors via First Street. Map © Google.
Why this score? — see what drove the D grade
The composite is a weighted blend of 9 inputs, each scored 0–100. Each bar is that input's sub-score; the figure is the points it added to the 100-point composite (weight × sub-score).
- ARV discount +15.0/15.0
- Appreciation +7.8/10.0
- Cash flow +6.4/30.0
- Schools +4.6/10.0
- Livability +3.2/5.0
- Rent growth +2.5/5.0
- Condition / age +2.5/5.0
- 1% rule +0.9/10.0
- DSCR +0.7/10.0
$170,000
🖨 Deal sheet (PDF) 📄 Offer letter ✓ Due diligence
Listing remarks MLS
Enjoy the best of Wilbur! It's close to the city but a peaceful small-town atmosphere. The property features many updates, including new flooring throughout and an updated mini split heating/cooling system. Cozy dining area with fireplace, spacious living room, and kitchen on the main floor. The second floor boasts two bedrooms, a family room, and a bathroom. It's a large corner lot with a private deck, cherry tree, raised garden beds, and large fence back yard. Come enjoy peaceful evenings and beautiful sunsets.
Key facts
- Bright kitchen
- New mini-splits
- Shady covered deck
Tags
Neighborhood map
What this means for you Summary
Snapshot
- This is a 2-bed/1.5-bath single-family listed at $170k.
Deal economics
- At list price, monthly cash flow is $-295 ($-4k/yr) — negative.
- To cash-flow at today's rent, offer at most $118k (30.7% below list).
- To meet the 1% rule (rent ≥ 1% of price), the offer needs to be $100k (41.4% below list).
- Recommended offer: $100k (41.4% below list) — sets the bar for 1% rule.
Location & tenants
- Location reads 65/100 on livability (#338 in WA) — a middle-class / working-renter tenant base. Strengths: cost of living A+, housing A+, employment B; Watch: health & safety C-, crime F, amenities F.
- Wilbur School District (rural): math 40% / reading 65% proficiency, ranked #137 of 291 in WA (top 47%) — acceptable for families but not a draw, mixed tenant base, ~2y average lease.
- Zoned schools: Wilbur Elementary School (91 students, 53% FRL); Wilbur Secondary School (126 students, 44% FRL) — zoned schools average 49% FRL vs 31% district-wide (17 pts higher); higher-poverty schools than district average — tighter screening recommended.
- Market conditions: 30 active listings in the ZIP; 49 units permitted in Lincoln County in 2024 (0 in 5+ unit buildings).
Forward outlook
- In year one you build about $11k of equity ($1k loan paydown + $10k appreciation (5.6% local appreciation)).
- Lincoln County population projected at -20% by 2050 — secular population decline; favor cash flow + early exit over multi-decade hold.
- By year 4, paydown + projected appreciation supports a ~$36k cash-out refi (75% LTV) — recoverable capital for the next deal without selling this one.
Negotiation context
- It's been on market 269 days — a 12% lower offer ($150k) is reasonable based on typical stale-listing flexibility.
- 3 sale attempts since 6y ago; this cycle's ask has dropped $70k (29%) from the opening price — seller is motivated, your offer sets the floor, not the list.
Risks & watch-outs
- Watch-outs: built in 1915 — expect roof / HVAC / electrical / plumbing capex.
Questions for the listing agent
- What do current leases actually rent for vs. the listed asking? Can we see a recent rent roll and the last 12 months of T-12 income?
- It's been on market 269 days. Have you received any prior offers? Is the seller open to a 41% concession, seller financing, or rate buy-down credit?
- Built in 1915 — when were the roof, HVAC, electrical panel, plumbing, and water heater last replaced?
- Why hasn't it sold? Are there any deal-killer items the seller is aware of (foundation, flood, title, zoning, code violations)?
- Is there a deadline driving the sale (1031 exchange, divorce, estate, relocation)? That informs how much negotiation room exists.
- Crime grade is F in this area — have there been break-ins, vandalism, or insurance claims at this property in the last 3 years? What carrier currently insures it and at what premium?
- The area grade is low — what's the realistic commute time and amenity access for the typical tenant pool here? Any planned neighborhood developments (good or bad) we should know about?
- What's the average days-on-market for RENTAL listings here right now (not sales)? A rising rental-DOM trend means longer vacancies and softer asking-rent achievability than the comps imply.
- What's the recent tenant-quality profile in this submarket — average credit score on applications, eviction rate, late-payment / NSF rate, and stable-employment percentage? A property-management company in the area should have these aggregated.
- How much new for-sale + rental construction is in the pipeline within 1–3 miles? Heavy new supply typically softens prices + rents 12–24 months out; constrained supply supports both.
Investment metrics
- 1% rule
- 0.59% ✗
- Cap rate
- 4.21%
- Cash-on-cash
- -7.45%
- DSCR
- 0.67
- GRM
- 14.2
CMA / ARV
- ARV (median comp)
- $224,423
- List price
- $170,000
- Delta
- -24.25%
- Verdict
- UNDERPRICED
- Comps
- 19 within 1.0 mi
Show comp detail 2 sales within ~0.75 mi
| Address | Dist | Beds/Ba | Sqft | Sold | Price | $/sf | Match |
|---|---|---|---|---|---|---|---|
| 405 SE Regent Ave | 0.63mi | 3/1.5 (+1) | 1,402 (-4%) | 7mo | $220,000 | $157 | 54 |
| 413 SW Regent Ave | 0.40mi | 3/2.0 (+1) | 1,360 (-7%) | 13mo | $199,900 | $147 | 53 |
Match score weights: distance 35% · size 25% · config 20% · recency 20%. Top-matched comps best support the ARV.
Projected returns pro-forma
5.61% appreciation · 3.0% rent growth · sell at horizon
- IRR
- 8.3%
- Equity multiple
- 1.55×
- Total profit
- $26,288
- Equity at exit
- $102,674
- IRR
- 10.0%
- Equity multiple
- 2.96×
- Total profit
- $93,107
- Equity at exit
- $182,677
Cash invested: $47,600 (down + closing). Projections, not guarantees.
Landlord ↔ Tenant lean methodology
- Overall (STATE)
- 28 Tenant-Leaning
- State Washington
- 28 Tenant-Leaning · D+8
- County
- — inherits STATE
- City
- — inherits STATE
ZIP-level market 99185
- Home prices YoY
- 2.2%
- Active inventory
- 30
- Price-to-rent
- 14.2×
Monthly cashflow live
- Estimated rent
- $996 medium interval (Pro) →
- Mortgage (P&I)
- −$891
- Tax from tax record
- −$120 /mo · $1,438/yr
- Insurance
- −$71
- HOA
- −$0
- Vacancy / Maint / Mgmt
- −$209
- Net cashflow
- $-295
Break-even live
Sensitivity live
| Price | -10% $-199 | -5% $-247 | +0% $-295 | +5% $-343 | +10% $-392 |
|---|---|---|---|---|---|
| Rent | -10% $-374 | -5% $-335 | +0% $-295 | +5% $-256 | +10% $-217 |
| Rate | -1.0pp $-210 | -0.5pp $-252 | base $-295 | +0.5pp $-339 | +1.0pp $-384 |
UW: 25.0% down · 7.5% · 30yr · 1.5% tax · 5.0% vac · 8.0% maint · 8.0% mgmt
Financing live
Cash to close
- Down payment
- $42,500
- Closing costs
- $5,100
- Reserves months
- —
- Total cash needed
- —
Loan-product check · same deal, 3 products live
Conventional
25% down · 7.5% · 30yr
- Down + closing
- —
- Monthly P&I
- —
- Monthly cashflow
- —
- DSCR
- —
- Eligible?
- —
Personal DTI + credit; lowest rate.
DSCR
20% down · 8.5% · 30yr
- Down + closing
- —
- Monthly P&I
- —
- Monthly cashflow
- —
- DSCR
- —
- Eligible?
- —
No personal income docs; deal must DSCR.
Hard money
10% down · 12.0% · 12mo
- Down + closing
- —
- Monthly P&I
- —
- Monthly cashflow
- —
- DSCR
- —
- Eligible?
- —
Short-term bridge; refi at stabilization.
Listing history 27 events
-
2026-06-21days on market $170,000 Active 269 DOM
-
2026-06-21days on market $170,000 Active 268 DOM
-
2026-06-18days on market $170,000 Active 266 DOM
-
2026-06-17days on market $170,000 Active 265 DOM
-
2026-06-16days on market $170,000 Active 264 DOM
-
2026-06-15days on market $170,000 Active 263 DOM
-
2026-06-15days on market $170,000 Active 262 DOM
-
2026-06-13days on market $170,000 Active 261 DOM
-
2026-06-12days on market $170,000 Active 260 DOM
-
2026-06-09days on market $170,000 Active 257 DOM
-
2026-06-08days on market $170,000 Active 256 DOM
-
2026-06-08days on market $170,000 Active 255 DOM
-
2026-06-05days on market $170,000 Active 253 DOM
-
2026-06-03days on market $170,000 Active 251 DOM
-
2026-06-02days on market $170,000 Active 250 DOM
-
2026-06-01days on market $170,000 Active 249 DOM
-
2026-05-31days on market $170,000 Active 248 DOM
-
2026-03-25price $170,000
-
2026-03-16price $180,000
-
2026-01-12price $199,900
-
2025-10-21price $225,000
-
2025-09-25$240,000 Active
-
2021-06-15soldstatus $162,000 Sold 518-char remark
Show marketing remark (518 chars)
Enjoy the best of Wilbur! It's close to the city but a peaceful small-town atmosphere. The property features many updates, including new flooring throughout and an updated mini split heating/cooling system. Cozy dining area with fireplace, spacious living room, and kitchen on the main floor. The second floor boasts two bedrooms, a family room, and a bathroom. It's a large corner lot with a private deck, cherry tree, raised garden beds, and large fence back yard. Come enjoy peaceful evenings and beautiful sunsets.
-
2021-04-16status Pending 518-char remark
Show marketing remark (518 chars)
Enjoy the best of Wilbur! It's close to the city but a peaceful small-town atmosphere. The property features many updates, including new flooring throughout and an updated mini split heating/cooling system. Cozy dining area with fireplace, spacious living room, and kitchen on the main floor. The second floor boasts two bedrooms, a family room, and a bathroom. It's a large corner lot with a private deck, cherry tree, raised garden beds, and large fence back yard. Come enjoy peaceful evenings and beautiful sunsets.
-
2021-04-08$156,900 New 518-char remark
Show marketing remark (518 chars)
Enjoy the best of Wilbur! It's close to the city but a peaceful small-town atmosphere. The property features many updates, including new flooring throughout and an updated mini split heating/cooling system. Cozy dining area with fireplace, spacious living room, and kitchen on the main floor. The second floor boasts two bedrooms, a family room, and a bathroom. It's a large corner lot with a private deck, cherry tree, raised garden beds, and large fence back yard. Come enjoy peaceful evenings and beautiful sunsets.
-
2020-09-25soldstatus $110,000
-
2020-08-11$129,500
ⓘ Source: listings_history table (triggers on properties + properties_extension) + one-shot
backfill from property_details.listing_events for pre-trigger history.
Tax reassessment forecast WA · Resets to sale price
- Current annual tax
- $1,438 · $120/mo
- Projected year-2 tax
- $1,666 · $139/mo
- Expected delta
- +$228/yr (+$19/mo · 15.9%)
ⓘ Screening estimate from a state-policy table — verify with the county assessor before closing.
Nearby sold comps map
Loading sold comps map…
Walkable amenities ~0.75 mi
Loading nearby amenities…
Taxation est. · year 1
- Rental income
- $11,952
- − Mortgage interest
- −$9,523
- − Property taxes
- −$1,438
- − Insurance
- −$850
- − Repairs & maintenance
- −$956
- − Management
- −$956
- − Depreciation
- −$4,945
- Taxable loss
- −$6,716
- Est. tax savings @ 24.0%
- +$1,612
- After-tax cash flow
- $-1,932/yr
For passive investors: Depreciation is non-cash, so a rental often shows a tax loss while cash-flowing — sheltering income. Rental losses are passive: they offset passive income freely, and up to $25,000/yr can offset ordinary (W-2) income if you actively participate and your MAGI is under $100k (phasing out to $0 by $150k); unused losses carry forward. On sale, claimed depreciation is recaptured at up to 25%, and gains may owe capital-gains tax (a 1031 exchange can defer both). Figures are a year-1 estimate at your 24.0% rate — not tax advice; consult a CPA.
Schools (NCES district)
- District
- Wilbur School District
- NCES district ID
- 5309840
- Math proficiency
- 40% ▼ -10.00%
- Reading proficiency
- 65% ▼ -10.00%
- Median HH income
- $43,213
- Composite
- 46.08/100
- National rank
- #5483
- State rank
- #137 of 291 in WA
Livability — Wilbur
- Score
- 65/100
- State rank
- #338
- US rank
- #12852
Category grades
Schools grade is shown separately in the Schools card above.
Census & demographics
- Census place
- Wilbur, WA
- Population (ZIP)
- 1,518
Population outlook (Lincoln County) Hauer SSP2
- Today (2025)
- 9,599 people
- By 2030
- 9,146 · -4.7%
- By 2040
- 8,298 · -13.6%
- By 2050
- 7,683 · -20.0%
- By 2075
- 6,790 · -29.3%
- By 2100
- 6,029 · -37.2%
Race, ethnicity, and origin ACS 2023
- Neighborhood character
- Predominantly White (88%)
- Race & ethnicity
- White 88% Two or more races 8% Hispanic / Latino 3% Native American 2%
- Common ancestry
- Portuguese 4% Slovak 2% Lithuanian 2%
- Foreign-born
- 1%
- Languages at home
- 97% English-only · Other Indo-European 2% Russian/Polish/Slavic 1% Other Asian/Pacific 1%
Political lean MEDSL · Lincoln
- 2024 margin
- Solid R (+50.6) · D 23.6% · R 74.2% · Other 2.2%
- 2008→2024 swing
- -20.9pp toward R · 2008: -29.6pp · 2024: -50.6pp
- All cycles
- 2024: R+50.6 2020: R+48.9 2016: R+50.2 2012: R+40.9 2008: R+29.6
Not yet ingested
- Civics
- —
Market trends
- HPI YoY
- ▲ 5.61%
- Current HPI
- 261.0745
- Rent YoY
- —
- Metro
- —
- State GDP YoY
- ▲ 4.65%
- F500 in state
- 22
Industry mix (Fortune 500 HQ in WA)
| Industry | F500 HQs | Revenue |
|---|---|---|
| Retail | 2 | $269B |
|
||
| Technology / Retail | 1 | $638B |
|
||
| Technology | 1 | $245B |
|
||
| Telecommunications | 1 | $38B |
|
||
| Food / Beverage | 1 | $36B |
|
||
| Automotive / Trucks | 1 | $34B |
|
||
Price history
+31.3% since first listed10 events — show timeline
- 2026-03-25 Price Changed $170,000 NWMLS as Distributed by MLS Grid
- 2026-03-16 Price Changed $180,000 NWMLS as Distributed by MLS Grid
- 2026-01-12 Price Changed $199,900 NWMLS as Distributed by MLS Grid
- 2025-10-21 Price Changed $225,000 NWMLS as Distributed by MLS Grid
- 2025-09-25 Listed $240,000 NWMLS as Distributed by MLS Grid
- 2021-06-15 Sold (MLS) $162,000 SPOKANEMLS as Distributed by MLS Grid
- 2021-04-16 Pending — SPOKANEMLS as Distributed by MLS Grid
- 2021-04-08 Listed $156,900 SPOKANEMLS as Distributed by MLS Grid
- 2020-09-25 Sold (MLS) $110,000 NWMLS as Distributed by MLS Grid
- 2020-08-11 Listed $129,500 NWMLS as Distributed by MLS Grid
Property tax history
+70.7%/yrLatest (2026): $1,438 · -4.8% YoY. Source: county tax records.
Cash-flow waterfall
monthlySold comps — $/sqft
last 12 mo · ≤1 miLoading sold comps…