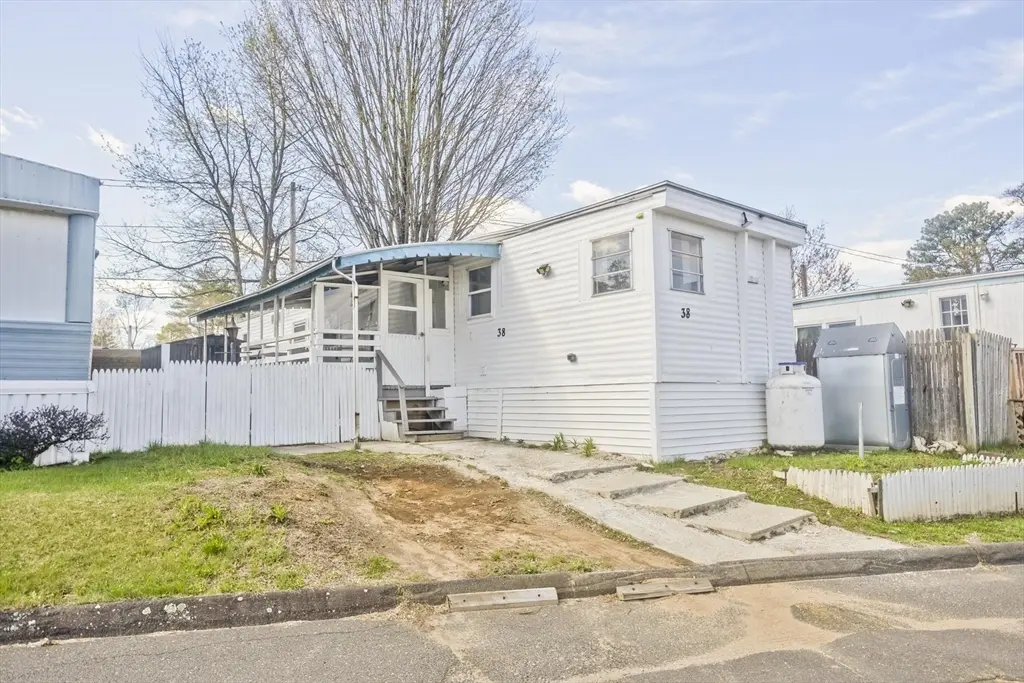
38 Klondike Ave · Westfield, MA
Flood risk 1/10 · Minimal
- FEMA flood zone
- X (unshaded)
- Chance of flooding over 30 yrs
- 0.0%
- Est. flood insurance / yr
- $473 – $860
Fire risk 1/10 · Minimal
- Est. fire insurance / yr
- $915 – $1,699
Heat risk 4/10 · Minor
- Hot days now (above 98°F)
- 7 days/yr
- Hot days in 30 yrs
- 16 days/yr
Wind risk 5/10 · Moderate
- Chance of severe wind over 30 yrs
- 23.0%
Air-quality risk 2/10 · Minimal
- Unhealthy air days now
- 1 days/yr
- Unhealthy air days in 30 yrs
- 1 days/yr
Risk factors via First Street. Map © Google.
Why this score? — see what drove the B grade
The composite is a weighted blend of 9 inputs, each scored 0–100. Each bar is that input's sub-score; the figure is the points it added to the 100-point composite (weight × sub-score).
- Cash flow +30.0/30.0
- 1% rule +10.0/10.0
- DSCR +10.0/10.0
- ARV discount +8.4/15.0
- Rent growth +4.1/5.0
- Livability +3.7/5.0
- Schools +3.3/10.0
- Condition / age +2.2/5.0
- Appreciation +0.0/10.0
$79,900
🖨 Deal sheet 📄 Offer letter ✓ Due diligence
Listing remarks MLS
Bright and cheerful mobile home. Economical to live here! Lot fee $300.00/month includes water /sewer and taxes. Many updates including : plumbing, heating and hot water heater!
Key facts
- Open-plan kitchen
- Covered deck
- Private yard
Tags
Property features AI
Finance
- HOA & community: Homeowners association membership required; Association fee $485; Community features include public transportation, shopping, park, medical facility, laundromat, highway access, house of worship, public school
Exterior
- Parking: 2 open parking spaces; On-street parking available
- Utilities: 110 Volt electric
- Home design: Mobile home; White exterior color
- Construction: Metal roof; Built approximately (owner provided year)
- Exterior features: Porch; Level lot
Interior
- Kitchen: Range; Microwave; Refrigerator
- Flooring: Vinyl
- Bathrooms: 1 full bathroom
- Heating & cooling: Forced air heating (oil); Window air conditioning unit(s)
- Interior features: Total of 4 rooms; Vinyl flooring; Porch
- Laundry & utility: Washer included; Washer hookup
Neighborhood map
What this means for you Summary
Snapshot
- This is a 2-bed/1.0-bath manufactured listed at $80k. Condition is rated fair.
Deal economics
- At list price, monthly cash flow is $432 ($5k/yr) — positive.
- The deal already cash-flows at list — no discount required.
- Meets the 1% rule at list price ($2k rent vs $80k).
- Recommended offer: $78k (3.0% below list) — sets the bar for market timing.
- Cap rate 12.8% vs local median 3.7% in Westfield — top-decile yield for the area; either an underpriced asset or a hidden risk that comps aren't pricing in. Stress-test before assuming the spread holds.
Location & tenants
- Location reads 73/100 on livability (#103 in MA) — a middle-class / working-renter tenant base. Strengths: housing A+, employment A, crime A-; Watch: commute C-, cost of living C-, amenities F.
- Westfield (suburban): math 29% / reading 45% proficiency, ranked #216 of 302 in MA (top 72%) — families likely to look elsewhere, expect single-tenant / working-renter base with shorter leases.
- Market conditions: Rents rising fast (+6.5%/yr); 52 active listings in the ZIP; 1 comparable units currently listed for rent nearby; solid renter incomes; 453 units permitted in Hampden County in 2024 (116 in 5+ unit buildings).
Forward outlook
- Local home prices are declining (-3.0%/yr); year-one equity from $552 of loan paydown is wiped out by about $2k of value loss. Plan a longer hold.
- Hampden County population projected at +5% by 2050 — modest demand growth; plan on rents tracking national, not racing it.
- At projected returns (-3.0% appreciation + 6.5% rent growth), your $22k cash investment doubles in ~5 years — after that, you're playing with house money.
Negotiation context
- It's been on market 53 days — a 3% lower offer ($78k) is reasonable based on typical stale-listing flexibility.
- 3 sale attempts since 21y ago; this cycle's ask has dropped $10k (11%) from the opening price — seller is motivated, your offer sets the floor, not the list.
- Current owner paid $30k; list at $80k implies a 166% gain — meaningful room to come down on a strong offer.
Risks & watch-outs
- Watch-outs: HOA is 26% of rent; built in 1957 — expect roof / HVAC / electrical / plumbing capex.
- Climate carrying-cost: moderate wind risk, 23% chance of damaging wind over 30y — expect insurance premiums to compound above CPI over the hold.
Questions for the listing agent
- It's been on market 53 days. Have you received any prior offers? Is the seller open to a 3% concession, seller financing, or rate buy-down credit?
- Have any recent inspections been done? Can we get a copy of the seller's disclosures and any deferred-maintenance estimates?
- Built in 1957 — when were the roof, HVAC, electrical panel, plumbing, and water heater last replaced?
- What does the HOA fee cover, when was the last increase, and are there any pending special assessments or reserve-fund shortfalls?
- Is there a deadline driving the sale (1031 exchange, divorce, estate, relocation)? That informs how much negotiation room exists.
- What's the average days-on-market for RENTAL listings here right now (not sales)? A rising rental-DOM trend means longer vacancies and softer asking-rent achievability than the comps imply.
- What's the recent tenant-quality profile in this submarket — average credit score on applications, eviction rate, late-payment / NSF rate, and stable-employment percentage? A property-management company in the area should have these aggregated.
- How much new for-sale + rental construction is in the pipeline within 1–3 miles? Heavy new supply typically softens prices + rents 12–24 months out; constrained supply supports both.
Investment metrics
- 1% rule
- 2.33% ✓
- Cap rate
- 12.78%
- Cash-on-cash
- 23.16%
- DSCR
- 2.03
- GRM
- 3.6
CMA / ARV
- ARV (median comp)
- $81,595
- List price
- $79,900
- Delta
- -2.08%
- Verdict
- FAIR
- Comps
- 4 within 2.0 mi
Show comp detail 1 sale within ~0.75 mi
| Address | Dist | Beds/Ba | Sqft | Sold | Price | $/sf | Match |
|---|---|---|---|---|---|---|---|
| 30 Klondike Ave | 0.05mi | 2/1.0 | 728 (+1%) | 17mo | $55,000 | $76 | 81 |
Match score weights: distance 35% · size 25% · config 20% · recency 20%. Top-matched comps best support the ARV.
Projected returns pro-forma
-3.0% appreciation · 6.46% rent growth · sell at horizon
- IRR
- 22.1%
- Equity multiple
- 1.96×
- Total profit
- $21,577
- Equity at exit
- $11,913
- IRR
- 33.3%
- Equity multiple
- 4.80×
- Total profit
- $85,038
- Equity at exit
- $6,908
Cash invested: $22,372 (down + closing). Projections, not guarantees.
Landlord ↔ Tenant lean methodology
- Overall (STATE)
- 20 Strongly Tenant-Friendly
- State Massachusetts
- 20 Strongly Tenant-Friendly · D+15
- County
- — inherits STATE
- City
- — inherits STATE
ZIP-level market 01085
- Rents YoY
- 6.5%
- Active inventory
- 52
- Price-to-rent
- 3.6×
Monthly cashflow live
- Estimated rent
- $1,859 medium interval (Pro) →
- Mortgage (P&I)
- −$419
- Tax est. 1.5%
- −$100 /mo · $1,198/yr
- Insurance
- −$33
- HOA
- −$485
- Vacancy / Maint / Mgmt
- −$390
- Net cashflow
- $432
Break-even live
UW: 25.0% down · 7.5% · 30yr · 1.5% tax · 5.0% vac · 8.0% maint · 8.0% mgmt
Financing live
Cash to close
- Down payment
- $19,975
- Closing costs
- $2,397
- Reserves months
- —
- Total cash needed
- —
Loan-product check · same deal, 3 products live
Conventional
25% down · 7.5% · 30yr
- Down + closing
- —
- Monthly P&I
- —
- Monthly cashflow
- —
- DSCR
- —
- Eligible?
- —
Personal DTI + credit; lowest rate.
DSCR
20% down · 8.5% · 30yr
- Down + closing
- —
- Monthly P&I
- —
- Monthly cashflow
- —
- DSCR
- —
- Eligible?
- —
No personal income docs; deal must DSCR.
Hard money
10% down · 12.0% · 12mo
- Down + closing
- —
- Monthly P&I
- —
- Monthly cashflow
- —
- DSCR
- —
- Eligible?
- —
Short-term bridge; refi at stabilization.
Rent comps 1 comps
| Address | Beds | Baths | Sqft | Rent | $/sqft | DOM | Units | Dist |
|---|---|---|---|---|---|---|---|---|
| 19 Lockhouse Rd Westfield, MA | 1.0–2.0 | 1.0 | 662 | $2,217 | $3.35 | 13d | 2 | 1.13mi |
HOA detail
- Monthly dues
- $485 · $5,820/yr
- Likely covers
- watersewer
Listing history 19 events
-
2026-06-18days on market $79,900 Active 53 DOM
-
2026-06-17days on market $79,900 Active 52 DOM
-
2026-06-16days on market $79,900 Active 51 DOM
-
2026-06-15days on market $79,900 Active 50 DOM
-
2026-06-14days on market $79,900 Active 48 DOM
-
2026-06-10days on market $79,900 Active 45 DOM
-
2026-06-09days on market $79,900 Active 44 DOM
-
2026-06-08days on market $79,900 Active 43 DOM
-
2026-06-07days on market $79,900 Active 42 DOM
-
2026-06-03days on market $79,900 Active 38 DOM
-
2026-06-02days on market $79,900 Active 37 DOM
-
2026-06-01days on market $79,900 Active 36 DOM
-
2026-05-31days on market $79,900 Active 35 DOM
-
2026-05-30days on market $79,900 Active 34 DOM
-
2026-04-26$90,000 New 851-char remark
-
2010-10-23soldstatus $30,000 180-char remark
Show marketing remark (180 chars)
Bright and cheerful mobile home. Economical to live here! Lot fee $300.00/month includes water /sewer and taxes. Many updates including : plumbing, heating and hot water heater!
-
2010-09-21$34,900 180-char remark
Show marketing remark (180 chars)
Bright and cheerful mobile home. Economical to live here! Lot fee $300.00/month includes water /sewer and taxes. Many updates including : plumbing, heating and hot water heater!
-
2006-02-24soldstatus $10,500
Show marketing remark (96 chars)
home is to be sold as/is. Fee includes Water, sewer, snow removal, taxes, and rubbish removal.
-
2005-11-24$12,500
Show marketing remark (96 chars)
home is to be sold as/is. Fee includes Water, sewer, snow removal, taxes, and rubbish removal.
ⓘ Source: listings_history table (triggers on properties + properties_extension) + one-shot
backfill from property_details.listing_events for pre-trigger history.
Climate risk First Street
- Flood 1/10 Low FEMA zone X (unshaded) · 0% chance over 30 yrs
- Wildfire 1/10 Low
- Heat 4/10 Moderate 7 d/yr ≥98°F today · 16 d/yr by 30 yrs out
- Wind 5/10 Major 23% chance of damaging wind over 30 yrs
- Air quality 2/10 Low 1 unhealthy d/yr today · 1 by 30 yrs out
Nearby sold comps map
Loading sold comps map…
Walkable amenities ~0.75 mi
Loading nearby amenities…
Taxation est. · year 1
- Rental income
- $22,313
- − Mortgage interest
- −$4,476
- − Property taxes
- −$1,198
- − Insurance
- −$400
- − Repairs & maintenance
- −$1,785
- − Management
- −$1,785
- − HOA
- −$5,820
- − Depreciation
- −$2,324
- Taxable income
- $4,525
- Est. tax owed @ 24.0%
- −$1,086
- After-tax cash flow
- $4,095/yr
For passive investors: Depreciation is non-cash, so a rental often shows a tax loss while cash-flowing — sheltering income. Rental losses are passive: they offset passive income freely, and up to $25,000/yr can offset ordinary (W-2) income if you actively participate and your MAGI is under $100k (phasing out to $0 by $150k); unused losses carry forward. On sale, claimed depreciation is recaptured at up to 25%, and gains may owe capital-gains tax (a 1031 exchange can defer both). Figures are a year-1 estimate at your 24.0% rate — not tax advice; consult a CPA.
Condition & rehab AI · 12 photos
This mobile home requires moderate repairs and maintenance to improve its condition and value. Repairs to the roof and exterior siding, along with painting the interior and exterior, would significantly enhance its appeal and marketability.
Repairs flagged
- Major roof — visible wear on siding
- Major exterior siding — weathered and peeling
- Major interior walls — paint appears worn
Value-add opportunities
- Both paint exterior — enhances curb appeal and value
- Both repair roof — fixes major issue and improves value
- Both paint interior walls — enhances interior appearance and value
Renovation cost estimate screening
| Repair item | Severity | Est. cost |
|---|---|---|
| roof · visible wear on siding | Major | $15,000–50,000 |
| exterior siding · weathered and peeling | Major | $15,000–50,000 |
| interior walls · paint appears worn | Major | $15,000–50,000 |
| Total estimated repair cost · 3 items | $45,000–150,000 |
Value-add ROI direction
- Both paint exterior — enhances curb appeal and value ↑
- Both repair roof — fixes major issue and improves value ↑
- Both paint interior walls — enhances interior appearance and value ↑
ⓘ Cost ranges are severity-bucket heuristics (US national rule-of-thumb). Get contractor quotes + a written scope before underwriting a rehab budget.
Schools (NCES district)
- District
- Westfield
- NCES district ID
- 2512630
- Math proficiency
- 29% ▼ -14.00%
- Reading proficiency
- 45% ▼ -4.00%
- Median HH income
- $57,859
- Composite
- 32.69/100
- National rank
- #5648
- State rank
- #216 of 302 in MA
Livability — Westfield
- Score
- 73/100
- State rank
- #103
- US rank
- #5343
Category grades
Schools grade is shown separately in the Schools card above.
Census & demographics
- Census place
- Westfield, MA
- County
- Hampden County · 230,965 people
- City population
- 41,102
- Metro
- Springfield, MA
- Population (ZIP)
- 41,102
- Household income
- $88,728
- Rent vs Own
- Severe rent burden
- 1029.0
Population outlook (Hampden County) Hauer SSP2
- Today (2025)
- 485,646 people
- By 2030
- 491,517 · +1.2%
- By 2040
- 500,539 · +3.1%
- By 2050
- 508,827 · +4.8%
- By 2075
- 539,167 · +11.0%
- By 2100
- 545,698 · +12.4%
Race, ethnicity, and origin ACS 2023
- Neighborhood character
- Predominantly White (82%)
- Race & ethnicity
- White 82% Hispanic / Latino 10% Two or more races 6% Asian 4%
- Hispanic origin (detail)
- Puerto Rican 9%
- Common ancestry
- Romanian 11% Lithuanian 9% Scotch-Irish 3%
- Foreign-born
- 10% · Canada, China
- Languages at home
- 84% English-only · Spanish 5% Russian/Polish/Slavic 5% Other Indo-European 3%
Political lean MEDSL · Hampden
- 2024 margin
- Lean D (+8.9) · D 53.4% · R 44.5% · Other 2.1%
- 2008→2024 swing
- -16.4pp toward R · 2008: 25.3pp · 2024: 8.9pp
- All cycles
- 2024: D+8.9 2020: D+17.7 2016: D+16.0 2012: D+25.4 2008: D+25.3
Not yet ingested
- Civics
- —
Market trends
- HPI YoY
- ▼ -297.65%
- Current HPI
- 256.772
- Rent YoY
- ▲ 6.46%
- Metro
- Springfield, MA
- State GDP YoY
- ▲ 2.28%
- F500 in state
- 38
Industry mix (Fortune 500 HQ in MA)
| Industry | F500 HQs | Revenue |
|---|---|---|
| Technology | 3 | $17B |
|
||
| Insurance | 2 | $84B |
|
||
| Retail | 2 | $76B |
|
||
| Life Sciences | 1 | $43B |
|
||
| Energy Technology | 1 | $31B |
|
||
| Aerospace / Defense | 1 | $18B |
|
||
Price history
+539.2% since first listed6 events — show timeline
- 2026-05-24 Price Changed $79,900 MLS PIN
- 2026-04-26 Listed $90,000 MLS PIN
- 2010-10-23 Sold (MLS) $30,000 MLS PIN
- 2010-09-21 Listed $34,900 MLS PIN
- 2006-02-24 Sold (MLS) $10,500 MLS PIN
- 2005-11-24 Listed $12,500 MLS PIN
Cash-flow waterfall
monthlySold comps — $/sqft
last 12 mo · ≤1 miLoading sold comps…