 Multi-family
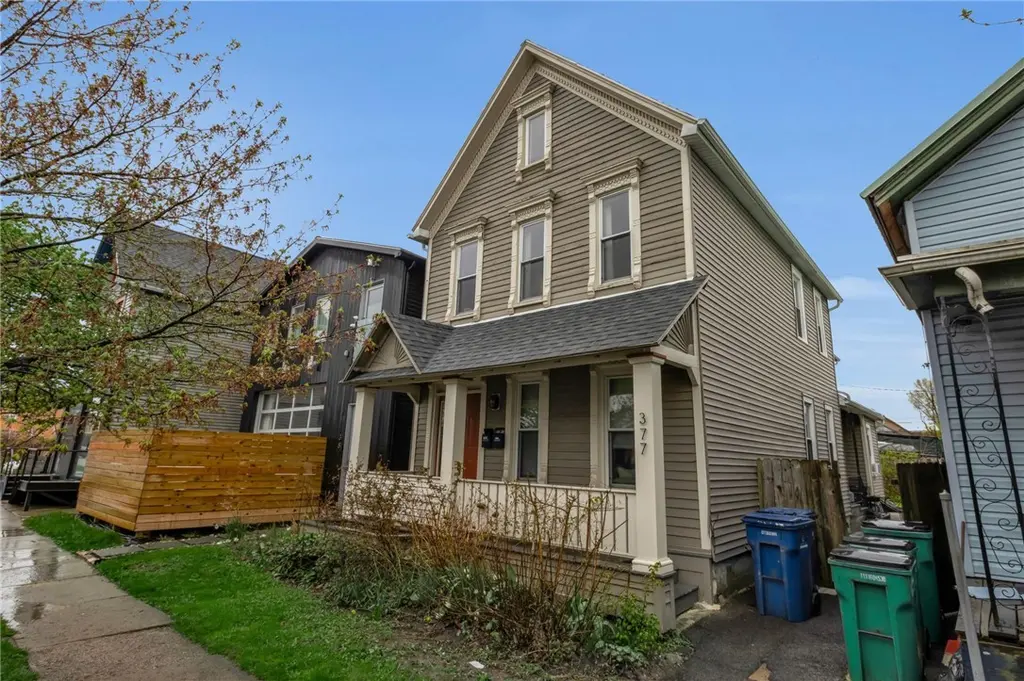
377 Rhode Island St · Buffalo, NY
Flood risk 6/10 · Moderate
- FEMA flood zone
- X (unshaded)
- Chance of flooding over 30 yrs
- 0.71%
- Est. flood insurance / yr
- $473 – $860
Fire risk 1/10 · Minimal
- Est. fire insurance / yr
- $691 – $1,283
Heat risk 3/10 · Minor
- Hot days now (above 91°F)
- 7 days/yr
- Hot days in 30 yrs
- 15 days/yr
Wind risk 1/10 · Minimal
- Chance of severe wind over 30 yrs
- —
Air-quality risk 4/10 · Minor
- Unhealthy air days now
- 4 days/yr
- Unhealthy air days in 30 yrs
- 9 days/yr
Risk factors via First Street. Map © Google.
Why this score? — see what drove the B grade
The composite is a weighted blend of 9 inputs, each scored 0–100. Each bar is that input's sub-score; the figure is the points it added to the 100-point composite (weight × sub-score).
- Cash flow +24.5/30.0
- ARV discount +15.0/15.0
- Appreciation +8.8/10.0
- DSCR +7.9/10.0
- 1% rule +5.1/10.0
- Livability +3.9/5.0
- Schools +3.3/10.0
- Condition / age +2.5/5.0
- Rent growth +2.4/5.0
$269,900
🖨 Deal sheet (PDF) 📄 Offer letter ✓ Due diligence
Multi-family units
County records classify this as Multi-Family (2-4 Unit). Listing-text estimate: 1 unit. estimate disagrees with records
Listing remarks
FIVE POINTS!! WELCOME TO THIS COMPLETELY RENOVATED DOUBLE IN BUFFALO'S PRIME WEST SIDE FIVE POINTS NEIGHBORHOOD LOCATED JUST STEPS FROM REMEDY HOUSE, BUTTER BLOCK, LAS PUERTAS, EXTRA! EXTRA!, URBAN ROOTS, PARADISE WINE, FIVE POINTS BAKERY, WEEKEND SUMMERTIME JAZZ, ALL THE BEST OF BUFFALO. THE HOME WAS COMPLETELY RENOVATED WITH ALL NEW MECHANICS, ROOF WINDOWS, ALL THE IMPORTANT STUFF, PLUS 2 TOTALLY MODERN AND EFFICIENT 1 BEDROOM APARTMENTS. BOTH APARTMENTS ARE OPEN PLAN WITH OPEN KITHCENS WITH ALL APPLIANCES INCLUDING DISHWASHERS, IN UNIT LAUNDRY AND THE FIRST FLOOR ALOS HAS A SMALL SECOND FLOOR ROOM WITH A COVERED PORCH. GREAT CITY LIVING!
Key facts
- Covered porch
- In unit laundry
- Completely renovated
Tags
Property features AI
Finance
- Financial info: Two-unit building with separate gas and electric meters for each unit; Gross annual income reported: $29,136; Operating expenses reported: $1,200 (includes trash and water/sewer); Owner pays trash collection and water; rent includes trash collection and water; Unit rents reported: $1,108 and $1,320 (both month-to-month)
Exterior
- Parking: On-street parking
- Utilities: Electricity connected (circuit breakers); Sewer connected; Public water connected; High-speed internet available
- Home design: Two-story multi-family property; Resale condition
- Construction: Vinyl siding; Asphalt roof; Stone foundation; Copper and PEX plumbing; Existing (previously built)
- Exterior features: Covered porch; Partial fencing; Fence; Near public transit; Rectangular residential lot; City street frontage
Interior
- Kitchen: Eat-in kitchens; Dishwasher; Oven/Range; Refrigerator; Microwave
- Bedrooms: Two 1-bedroom units (one per floor)
- Flooring: Laminate; Tile; Varies
- Bathrooms: Two full bathrooms (one in each unit)
- Heating & cooling: Gas forced-air heating
- Interior features: Partial basement; Has basement
- Laundry & utility: Laundry in unit (washer and dryer in each unit); Gas water heater
Neighborhood map
What this means for you Summary
Snapshot
- This is a 6-bed/2.0-bath multifamily listed at $270k.
Deal economics
- At list price, monthly cash flow is $554 ($7k/yr) — positive.
- The deal already cash-flows at list — no discount required.
- Meets the 1% rule at list price ($3k rent vs $270k).
Location & tenants
- Location reads 77/100 on livability (#195 in NY, #3,011 nationally) — a middle-class / working-renter tenant base. Strengths: commute A+, housing A+, health & safety A+; Watch: crime F, employment D-.
- Buffalo City School District (urban): math 41% / reading 40% proficiency, ranked #535 of 590 in NY (top 91%) — families likely to look elsewhere, expect single-tenant / working-renter base with shorter leases; 75% free/reduced lunch — lower-income household profile, screen leases tightly.
- Zoned schools: International School (math 8% / reading 17%, grade F, #2,048 of 2,108 statewide, top 97%, 981 students, 92% FRL); Hutchinson Central Technical High School (math 96% / reading 32%, grade B-, #807 of 1,100 statewide, top 73%, 1,175 students, 78% FRL).
- Market conditions: Rents soft (-0.5%/yr); 138 active listings in the ZIP; 1,244 units permitted in Erie County in 2024 (563 in 5+ unit buildings).
- At $2,737/mo this rent would consume 61% of the median local household income ($54k/yr) (locally 1501% of renters already pay >50% of income on rent) — very limited rent-growth headroom before tenants either downsize or default.
Forward outlook
- In year one you build about $22k of equity ($2k loan paydown + $20k appreciation (7.5% local appreciation)).
- At projected returns (7.5% appreciation + 0.0% rent growth), your $76k cash investment doubles in ~3 years — after that, you're playing with house money.
- By year 2, paydown + projected appreciation supports a ~$35k cash-out refi (75% LTV) — recoverable capital for the next deal without selling this one.
Negotiation context
- Only 5 days on market — expect competitive offers; lowballing is unlikely to land.
- Current owner paid $18k; list at $270k implies a 1399% gain — meaningful room to come down on a strong offer.
Risks & watch-outs
- Watch-outs: built in 1900 — expect roof / HVAC / electrical / plumbing capex.
- Climate carrying-cost: major flood risk — expect insurance premiums to compound above CPI over the hold.
Questions for the listing agent
- Built in 1900 — when were the roof, HVAC, electrical panel, plumbing, and water heater last replaced?
- Is there a deadline driving the sale (1031 exchange, divorce, estate, relocation)? That informs how much negotiation room exists.
- Crime grade is F in this area — have there been break-ins, vandalism, or insurance claims at this property in the last 3 years? What carrier currently insures it and at what premium?
- What's the average days-on-market for RENTAL listings here right now (not sales)? A rising rental-DOM trend means longer vacancies and softer asking-rent achievability than the comps imply.
- What's the recent tenant-quality profile in this submarket — average credit score on applications, eviction rate, late-payment / NSF rate, and stable-employment percentage? A property-management company in the area should have these aggregated.
- How much new apartment / multifamily construction is in the pipeline within 1–3 miles? Heavy new supply (>2% of stock underway) typically softens rents 12–24 months out; light construction supports rent growth.
Investment metrics
- 1% rule
- 1.01% ✓
- Cap rate
- 8.76%
- Cash-on-cash
- 8.80%
- DSCR
- 1.39
- GRM
- 8.2
CMA / ARV
- ARV (median comp)
- $377,568
- List price
- $269,900
- Delta
- -28.52%
- Verdict
- UNDERPRICED
- Comps
- 20 within 1.0 mi
Show comp detail 12 sales within ~0.75 mi
| Address | Dist | Beds/Ba | Sqft | Sold | Price | $/sf | Match |
|---|---|---|---|---|---|---|---|
| 298 Massachusetts Ave | 0.19mi | 5/2.0 (-1) | 2,221 (+5%) | 1mo | $220,000 | $99 | 77 |
| 149 16th St | 0.19mi | 6/3.0 | 2,169 (+2%) | 10mo | $394,000 | $182 | 75 |
| 325 Breckenridge St | 0.43mi | 6/2.0 | 2,044 (-4%) | 2mo | $175,500 | $86 | 72 |
| 385 Auburn Ave | 0.54mi | 6/2.0 | 1,920 (-9%) | 0mo | $218,000 | $114 | 59 |
| 651 Prospect Ave | 0.52mi | 5/2.0 (-1) | 2,026 (-4%) | 9mo | $278,500 | $137 | 56 |
| 238 Barton St | 0.70mi | 6/2.0 | 2,246 (+6%) | 2mo | $195,000 | $87 | 56 |
| 67 Barton St | 0.46mi | 6/2.0 | 2,420 (+14%) | 0mo | $170,000 | $70 | 54 |
| 214 W Ferry St Unit N | 0.47mi | 5/2.0 (-1) | 2,296 (+8%) | 7mo | $185,000 | $81 | 53 |
| 729 Prospect Ave | 0.49mi | 5/3.0 (-1) | 2,049 (-3%) | 12mo | $330,000 | $161 | 53 |
| 291 West Ave | 0.70mi | 5/2.0 (-1) | 2,140 (+1%) | 12mo | $325,500 | $152 | 51 |
| 233 Auburn Ave | 0.59mi | 5/2.0 (-1) | 2,264 (+7%) | 10mo | $310,000 | $137 | 47 |
| 192 Baynes St | 0.71mi | 6/2.0 | 1,920 (-9%) | 10mo | $284,000 | $148 | 44 |
Match score weights: distance 35% · size 25% · config 20% · recency 20%. Top-matched comps best support the ARV.
Projected returns pro-forma
7.51% appreciation · 0.0% rent growth · sell at horizon
- IRR
- 24.5%
- Equity multiple
- 2.72×
- Total profit
- $129,972
- Equity at exit
- $196,156
- IRR
- 21.5%
- Equity multiple
- 5.44×
- Total profit
- $335,893
- Equity at exit
- $381,178
Cash invested: $75,572 (down + closing). Projections, not guarantees.
Landlord ↔ Tenant lean methodology
- Overall (STATE)
- 15 Strongly Tenant-Friendly
- State New York
- 15 Strongly Tenant-Friendly · D+10
- County
- — inherits STATE
- City
- — inherits STATE
ZIP-level market 14213
- Home prices YoY
- 1.7%
- Rents YoY
- -0.5%
- Active inventory
- 138
- Price-to-rent
- 16.4×
Monthly cashflow live
- Estimated rent
- $2,737 high interval (Pro) →
- Mortgage (P&I)
- −$1,415
- Tax from tax record
- −$80 /mo · $964/yr
- Insurance
- −$112
- HOA
- −$0
- Vacancy / Maint / Mgmt
- −$575
- Net cashflow
- $554
Break-even live
Sensitivity live
| Price | -10% $707 | -5% $630 | +0% $554 | +5% $478 | +10% $401 |
|---|---|---|---|---|---|
| Rent | -10% $338 | -5% $446 | +0% $554 | +5% $662 | +10% $770 |
| Rate | -1.0pp $690 | -0.5pp $623 | base $554 | +0.5pp $484 | +1.0pp $413 |
2-unit breakdown (identical units grouped — click to expand)
| Units | Beds | Baths | Est. rent |
|---|---|---|---|
| 2× units | 1 | 1 | $2,736 |
| #1 | 1 | 1 | $1,368 |
| #2 | 1 | 1 | $1,368 |
| Total (2 units) | $2,737 | ||
UW: 25.0% down · 7.5% · 30yr · 1.5% tax · 5.0% vac · 8.0% maint · 8.0% mgmt
Financing live
Cash to close
- Down payment
- $67,475
- Closing costs
- $8,097
- Reserves months
- —
- Total cash needed
- —
Loan-product check · same deal, 3 products live
Conventional
25% down · 7.5% · 30yr
- Down + closing
- —
- Monthly P&I
- —
- Monthly cashflow
- —
- DSCR
- —
- Eligible?
- —
Personal DTI + credit; lowest rate.
DSCR
20% down · 8.5% · 30yr
- Down + closing
- —
- Monthly P&I
- —
- Monthly cashflow
- —
- DSCR
- —
- Eligible?
- —
No personal income docs; deal must DSCR.
Hard money
10% down · 12.0% · 12mo
- Down + closing
- —
- Monthly P&I
- —
- Monthly cashflow
- —
- DSCR
- —
- Eligible?
- —
Short-term bridge; refi at stabilization.
Listing history 3 events
-
2026-05-09status Pending 648-char remark
-
2026-05-04$269,900 Active 648-char remark
-
2012-10-16soldstatus $18,000
ⓘ Source: listings_history table (triggers on properties + properties_extension) + one-shot
backfill from property_details.listing_events for pre-trigger history.
Tax reassessment forecast NY · Partial reset (capped growth)
- Current annual tax
- $964 · $80/mo
- Projected year-2 tax
- $2,763 · $230/mo
- Expected delta
- +$1,799/yr (+$150/mo · 186.5%)
ⓘ Screening estimate from a state-policy table — verify with the county assessor before closing.
Climate risk First Street
- Flood 6/10 Major FEMA zone X (unshaded) · 71% chance over 30 yrs
- Wildfire 1/10 Low
- Heat 3/10 Moderate 7 d/yr ≥91°F today · 15 d/yr by 30 yrs out
- Wind 1/10 Low
- Air quality 4/10 Moderate 4 unhealthy d/yr today · 9 by 30 yrs out
Nearby sold comps map
Loading sold comps map…
Walkable amenities ~0.75 mi
Loading nearby amenities…
Taxation est. · year 1
- Rental income
- $32,844
- − Mortgage interest
- −$15,119
- − Property taxes
- −$964
- − Insurance
- −$1,350
- − Repairs & maintenance
- −$2,628
- − Management
- −$2,628
- − Depreciation
- −$7,852
- Taxable income
- $2,305
- Est. tax owed @ 24.0%
- −$553
- After-tax cash flow
- $6,095/yr
For passive investors: Depreciation is non-cash, so a rental often shows a tax loss while cash-flowing — sheltering income. Rental losses are passive: they offset passive income freely, and up to $25,000/yr can offset ordinary (W-2) income if you actively participate and your MAGI is under $100k (phasing out to $0 by $150k); unused losses carry forward. On sale, claimed depreciation is recaptured at up to 25%, and gains may owe capital-gains tax (a 1031 exchange can defer both). Figures are a year-1 estimate at your 24.0% rate — not tax advice; consult a CPA.
Schools (NCES district)
- District
- Buffalo City School District
- NCES district ID
- 3605850
- Math proficiency
- 41% ▲ 11.00%
- Reading proficiency
- 40% ▲ 7.00%
- Median HH income
- $31,665
- Composite
- 33.17/100
- National rank
- #5544
- State rank
- #535 of 590 in NY
Livability — Buffalo
- Score
- 77/100
- State rank
- #195
- US rank
- #3011
Category grades
Schools grade is shown separately in the Schools card above.
Census & demographics
- Census place
- Buffalo, NY
- County
- Erie County · 714,559 people
- City population
- 440,021
- Metro
- Buffalo-Cheektowaga, NY
- Population (ZIP)
- 24,107
- Household income
- $53,870
- Rent vs Own
- Severe rent burden
- 1501.0
Population outlook (Erie County) Hauer SSP2
- Today (2025)
- 933,037 people
- By 2030
- 935,181 · +0.2%
- By 2040
- 928,531 · -0.5%
- By 2050
- 905,725 · -2.9%
- By 2075
- 834,037 · -10.6%
- By 2100
- 708,033 · -24.1%
Race, ethnicity, and origin ACS 2023
- Neighborhood character
- Highly diverse neighborhood (Simpson 0.70)
- Race & ethnicity
- White 46% Hispanic / Latino 20% Black 18% Asian 12% Two or more races 10%
- Hispanic origin (detail)
- Mexican 1% Puerto Rican 16% Dominican 1%
- Common ancestry
- Romanian 6% Slovak 3% Lithuanian 3%
- Foreign-born
- 16% · Philippines, Canada, India
- Languages at home
- 68% English-only · Spanish 12% Other Asian/Pacific 7% Arabic 3%
Political lean MEDSL · Erie
- 2024 margin
- Lean D (+9.7) · D 54.8% · R 45.2%
- 2008→2024 swing
- -7.9pp toward R · 2008: 17.5pp · 2024: 9.7pp
- All cycles
- 2024: D+9.7 2020: D+14.7 2016: D+4.8 2012: D+15.6 2008: D+17.5
Not yet ingested
- Civics
- —
Market trends
- HPI YoY
- ▲ 7.51%
- Current HPI
- 448.4879
- Rent YoY
- ▼ -0.49%
- Metro
- Buffalo-Cheektowaga, NY
- State GDP YoY
- ▲ 2.60%
- F500 in state
- 92
Industry mix (Fortune 500 HQ in NY)
| Industry | F500 HQs | Revenue |
|---|---|---|
| Financial Services | 10 | $950B |
|
||
| Consumer Goods | 9 | $162B |
|
||
| Insurance | 4 | $225B |
|
||
| Telecommunications | 2 | $144B |
|
||
| Pharmaceuticals | 2 | $112B |
|
||
| Media / Entertainment | 2 | $69B |
|
||
Price history
+1399.4% since first listed3 events — show timeline
- 2026-05-09 Pending — UNYREIS
- 2026-05-04 Listed $269,900 UNYREIS
- 2012-10-16 Sold (Public Records) $18,000 Public Records
Property tax history
+25.3%/yrLatest (2025): $964 · -3.9% YoY. Source: county tax records.
Cash-flow waterfall
monthlySold comps — $/sqft
last 12 mo · ≤1 miLoading sold comps…