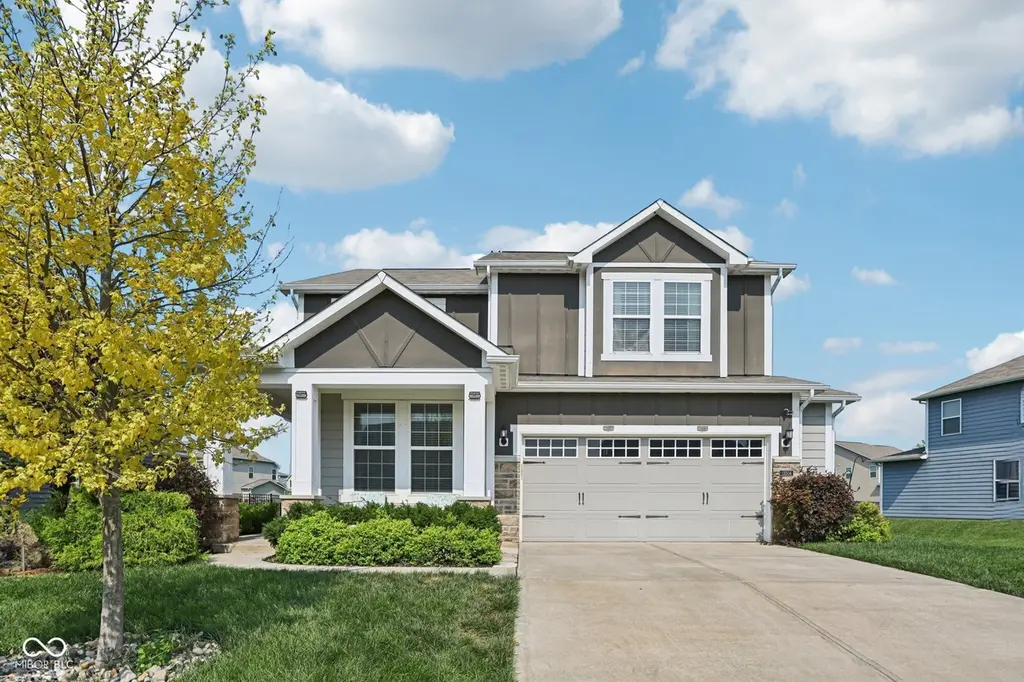
13504 Forest Glade Dr · Fishers, IN
Flood risk 1/10 · Minimal
- FEMA flood zone
- X (unshaded)
- Chance of flooding over 30 yrs
- 0.0%
- Est. flood insurance / yr
- $507 – $1,088
Fire risk 1/10 · Minimal
- Est. fire insurance / yr
- $717 – $1,331
Heat risk 3/10 · Minor
- Hot days now (above 101°F)
- 7 days/yr
- Hot days in 30 yrs
- 18 days/yr
Wind risk 2/10 · Minimal
- Chance of severe wind over 30 yrs
- 1.0%
Air-quality risk 2/10 · Minimal
- Unhealthy air days now
- 2 days/yr
- Unhealthy air days in 30 yrs
- 2 days/yr
Risk factors via First Street. Map © Google.
Why this score? — see what drove the D- grade
The composite is a weighted blend of 9 inputs, each scored 0–100. Each bar is that input's sub-score; the figure is the points it added to the 100-point composite (weight × sub-score).
- ARV discount +11.9/15.0
- Cash flow +7.1/30.0
- Schools +5.3/10.0
- Rent growth +4.2/5.0
- Livability +4.2/5.0
- Condition / age +2.5/5.0
- 1% rule +1.4/10.0
- DSCR +1.3/10.0
- Appreciation +0.0/10.0
$425,000
🖨 Deal sheet (PDF) 📄 Offer letter ✓ Due diligence
Listing remarks MLS
Listed and sold.
Key facts
- Kitchen bar
- Expansive kitchen
- Private office
Tags
Property features AI
Finance
- HOA & community: Homeowners association with a mandatory fee; HOA fee $195 quarterly (association fee includes homeowners association)
Exterior
- Parking: Attached 2-car garage (542 sq ft)
- Utilities: Public water; Municipal sewer connected
- Home design: Single family residence; Two levels
- Construction: Brick and cement siding exterior; Slab foundation; Built by Pulte
- Exterior features: Patio
Interior
- Kitchen: Dishwasher; Microwave; Gas oven; Refrigerator
- Bedrooms: 4 bedrooms on the upper level; Primary bedroom with walk-in closet
- Bathrooms: 2 full bathrooms (both on the upper level); 1 half bathroom on the main level; Primary bathroom with double sinks and a full shower stall
- Heating & cooling: Forced air heating; Central air conditioning
- Interior features: Attic access; High ceilings; Kitchen island; Eat-in kitchen; Walk-in closets; 10 total rooms (5 main level, 5 upper level)
Neighborhood map
What this means for you Summary
Snapshot
- This is a 3-bed/2.5-bath single-family listed at $425k.
Deal economics
- At list price, monthly cash flow is $-605 ($-7k/yr) — negative.
- To cash-flow at today's rent, offer at most $318k (25.1% below list).
- To meet the 1% rule (rent ≥ 1% of price), the offer needs to be $273k (35.8% below list).
- Recommended offer: $273k (35.8% below list) — sets the bar for 1% rule.
- Cap rate 4.6% vs local median 3.6% in Fishers — meaningfully above typical; check what's discounted (condition, days-on-market, listing class) to confirm the premium yield is real.
Location & tenants
- Location reads 83/100 on livability (#11 in IN, #898 nationally) — a professional / high-income tenant draw. Strengths: schools A+, crime A+, amenities A+; Watch: commute F.
- Hamilton Southeastern Schools (suburban): math 57% / reading 59% proficiency, ranked #14 of 301 in IN (top 5%) — acceptable for families but not a draw, mixed tenant base, ~2y average lease; only 10% free/reduced lunch — higher-income household profile.
- Market conditions: Rents rising fast (+6.7%/yr); 329 active listings in the ZIP; 3 comparable units currently listed for rent nearby; rentals at typical pace (median 19d on market — plan ~3-4 weeks tenant-placement turnaround); high-income renter base; 4,661 units permitted in Hamilton County in 2024 (1,528 in 5+ unit buildings).
Forward outlook
- Local home prices are declining (-3.0%/yr); year-one equity from $3k of loan paydown is wiped out by about $13k of value loss. Plan a longer hold.
- Hamilton County population projected at +44% by 2050 — long-run rental-demand tailwind backs the buy-and-hold thesis.
Negotiation context
- Only 10 days on market — expect competitive offers; lowballing is unlikely to land.
- 3 sale attempts since 10y ago with the ask held roughly flat each time — persistent listings suggest the price (not the market) is what's stuck; bring a comps-based counter.
- Current owner paid $255k; list at $425k implies a 67% gain — meaningful room to come down on a strong offer.
Questions for the listing agent
- What do current leases actually rent for vs. the listed asking? Can we see a recent rent roll and the last 12 months of T-12 income?
- What does the HOA fee cover, when was the last increase, and are there any pending special assessments or reserve-fund shortfalls?
- Is there a deadline driving the sale (1031 exchange, divorce, estate, relocation)? That informs how much negotiation room exists.
- Schools are A-rated — typically a magnet for longer-tenancy family renters. What's the average tenant stay here, and is there a school-zone premium baked into asking?
- The area grade is low — what's the realistic commute time and amenity access for the typical tenant pool here? Any planned neighborhood developments (good or bad) we should know about?
- What's the average days-on-market for RENTAL listings here right now (not sales)? A rising rental-DOM trend means longer vacancies and softer asking-rent achievability than the comps imply.
- What's the recent tenant-quality profile in this submarket — average credit score on applications, eviction rate, late-payment / NSF rate, and stable-employment percentage? A property-management company in the area should have these aggregated.
- How much new for-sale + rental construction is in the pipeline within 1–3 miles? Heavy new supply typically softens prices + rents 12–24 months out; constrained supply supports both.
Investment metrics
- 1% rule
- 0.64% ✗
- Cap rate
- 4.59%
- Cash-on-cash
- -6.10%
- DSCR
- 0.73
- GRM
- 13.0
CMA / ARV
- ARV (median comp)
- $470,609
- List price
- $425,000
- Delta
- -9.69%
- Verdict
- FAIR
- Comps
- 20 within 1.0 mi
Show comp detail 12 sales within ~0.75 mi
| Address | Dist | Beds/Ba | Sqft | Sold | Price | $/sf | Match |
|---|---|---|---|---|---|---|---|
| 13673 Ruskin Ln | 0.30mi | 3/2.5 | 2,596 (-4%) | 2mo | $478,000 | $184 | 79 |
| 13664 Mint Rd | 0.28mi | 4/3.5 (+1) | 2,784 (+4%) | 1mo | $505,000 | $181 | 72 |
| 13661 Ruskin Ln | 0.29mi | 4/3.5 (+1) | 2,784 (+4%) | 2mo | $480,000 | $172 | 70 |
| 16091 Meadow Frost Ct | 0.36mi | 3/2.5 | 2,422 (-10%) | 1mo | $520,500 | $215 | 66 |
| 15083 Mancroft Dr | 0.47mi | 4/2.5 (+1) | 2,932 (+9%) | 1mo | $570,000 | $194 | 57 |
| 15491 Alperton Rd | 0.33mi | 4/3.0 (+1) | 2,329 (-13%) | 1mo | $405,000 | $174 | 55 |
| 12972 Corydon Dr | 0.53mi | 3/2.5 | 2,377 (-12%) | 2mo | $414,000 | $174 | 54 |
| 15467 Alperton Rd | 0.35mi | 4/3.0 (+1) | 2,329 (-13%) | 2mo | $395,000 | $170 | 53 |
| 15475 Alperton Rd | 0.34mi | 4/3.0 (+1) | 2,329 (-13%) | 4mo | $399,000 | $171 | 52 |
| 15443 Alperton Rd | 0.37mi | 4/3.0 (+1) | 2,329 (-13%) | 4mo | $399,995 | $172 | 50 |
| 12930 Gilmour Dr | 0.57mi | 4/2.5 (+1) | 2,390 (-11%) | 3mo | $420,000 | $176 | 47 |
| 16091 Loire Valley Dr | 0.62mi | 2/2.5 (-1) | 2,430 (-10%) | 5mo | $535,000 | $220 | 46 |
Match score weights: distance 35% · size 25% · config 20% · recency 20%. Top-matched comps best support the ARV.
Projected returns pro-forma
-3.0% appreciation · 6.71% rent growth · sell at horizon
- IRR
- -23.1%
- Equity multiple
- 0.19×
- Total profit
- $-96,874
- Equity at exit
- $63,369
- IRR
- -10.6%
- Equity multiple
- 0.27×
- Total profit
- $-87,395
- Equity at exit
- $36,746
Cash invested: $119,000 (down + closing). Projections, not guarantees.
Landlord ↔ Tenant lean methodology
- Overall (STATE)
- 90 Strongly Landlord-Friendly
- State Indiana
- 90 Strongly Landlord-Friendly · R+11
- County
- — inherits STATE
- City
- — inherits STATE
ZIP-level market 46037
- Home prices YoY
- -18.6%
- Rents YoY
- 6.7%
- Active inventory
- 329
- Price-to-rent
- 13.0×
Monthly cashflow live
- Estimated rent
- $2,730 medium interval (Pro) →
- Mortgage (P&I)
- −$2,229
- Tax from tax record
- −$290 /mo · $3,485/yr
- Insurance
- −$177
- HOA
- −$65
- Vacancy / Maint / Mgmt
- −$573
- Net cashflow
- $-605
Break-even live
Sensitivity live
| Price | -10% $-364 | -5% $-484 | +0% $-605 | +5% $-725 | +10% $-845 |
|---|---|---|---|---|---|
| Rent | -10% $-820 | -5% $-712 | +0% $-605 | +5% $-497 | +10% $-389 |
| Rate | -1.0pp $-391 | -0.5pp $-497 | base $-605 | +0.5pp $-715 | +1.0pp $-827 |
UW: 25.0% down · 7.5% · 30yr · 1.5% tax · 5.0% vac · 8.0% maint · 8.0% mgmt
Financing live
Cash to close
- Down payment
- $106,250
- Closing costs
- $12,750
- Reserves months
- —
- Total cash needed
- —
Loan-product check · same deal, 3 products live
Conventional
25% down · 7.5% · 30yr
- Down + closing
- —
- Monthly P&I
- —
- Monthly cashflow
- —
- DSCR
- —
- Eligible?
- —
Personal DTI + credit; lowest rate.
DSCR
20% down · 8.5% · 30yr
- Down + closing
- —
- Monthly P&I
- —
- Monthly cashflow
- —
- DSCR
- —
- Eligible?
- —
No personal income docs; deal must DSCR.
Hard money
10% down · 12.0% · 12mo
- Down + closing
- —
- Monthly P&I
- —
- Monthly cashflow
- —
- DSCR
- —
- Eligible?
- —
Short-term bridge; refi at stabilization.
Rent comps 3 comps
| Address | Beds | Baths | Sqft | Rent | $/sqft | DOM | Units | Dist |
|---|---|---|---|---|---|---|---|---|
| 15905 Tharp Woods Dr Fishers, IN | 4.0 | 3.0 | 2442 | $2,850 | $1.17 | 13d | 1 | 0.31mi |
| 15254 Swallow Falls Way Fishers, IN | 3.0 | 2.5 | 1814 | $2,500 | $1.38 | 44d | 1 | 0.60mi |
| 15274 Farrington Way Fishers, IN | 4.0 | 2.5 | 1990 | $3,125 | $1.57 | 18d | 1 | 0.61mi |
HOA detail
- Monthly dues
- $65 · $780/yr
Listing history 7 events
-
2026-05-16status Pending 2000-char remark
-
2026-05-06$425,000 Active 2000-char remark
-
2025-11-15historical
-
2025-10-17price $450,000
-
2025-08-07$459,995 Active
-
2016-10-28$255,249 Active
Show marketing remark (16 chars)
Listed and sold.
-
2016-10-28soldstatus $255,249 Sold
Show marketing remark (16 chars)
Listed and sold.
ⓘ Source: listings_history table (triggers on properties + properties_extension) + one-shot
backfill from property_details.listing_events for pre-trigger history.
Tax reassessment forecast IN · Partial reset (capped growth)
- Current annual tax
- $3,485 · $290/mo
- Projected year-2 tax
- $3,549 · $296/mo
- Expected delta
- +$64/yr (+$5/mo · 1.8%)
ⓘ Screening estimate from a state-policy table — verify with the county assessor before closing.
Climate risk First Street
- Flood 1/10 Low FEMA zone X (unshaded) · 0% chance over 30 yrs
- Wildfire 1/10 Low
- Heat 3/10 Moderate 7 d/yr ≥101°F today · 18 d/yr by 30 yrs out
- Wind 2/10 Low 100% chance of damaging wind over 30 yrs
- Air quality 2/10 Low 2 unhealthy d/yr today · 2 by 30 yrs out
Nearby sold comps map
Loading sold comps map…
Walkable amenities ~0.75 mi
Loading nearby amenities…
Taxation est. · year 1
- Rental income
- $32,758
- − Mortgage interest
- −$23,807
- − Property taxes
- −$3,485
- − Insurance
- −$2,125
- − Repairs & maintenance
- −$2,621
- − Management
- −$2,621
- − HOA
- −$780
- − Depreciation
- −$12,364
- Taxable loss
- −$15,043
- Est. tax savings @ 24.0%
- +$3,610
- After-tax cash flow
- $-3,645/yr
For passive investors: Depreciation is non-cash, so a rental often shows a tax loss while cash-flowing — sheltering income. Rental losses are passive: they offset passive income freely, and up to $25,000/yr can offset ordinary (W-2) income if you actively participate and your MAGI is under $100k (phasing out to $0 by $150k); unused losses carry forward. On sale, claimed depreciation is recaptured at up to 25%, and gains may owe capital-gains tax (a 1031 exchange can defer both). Figures are a year-1 estimate at your 24.0% rate — not tax advice; consult a CPA.
Schools (NCES district)
- District
- Hamilton Southeastern Schools
- NCES district ID
- 1810650
- Math proficiency
- 57% ▼ -11.00%
- Reading proficiency
- 59% ▼ -7.00%
- Median HH income
- $87,726
- Composite
- 53.02/100
- National rank
- #1520
- State rank
- #14 of 301 in IN
Livability — Fishers
- Score
- 83/100
- State rank
- #11
- US rank
- #898
Category grades
Schools grade is shown separately in the Schools card above.
Census & demographics
- Census place
- Fishers, IN
- County
- Hamilton County · 337,479 people
- City population
- 92,467
- Metro
- Indianapolis-Carmel-Anderson, IN
- Population (ZIP)
- 48,713
- Household income
- $141,810
- Rent vs Own
- Severe rent burden
- 738.0
Population outlook (Hamilton County) Hauer SSP2
- Today (2025)
- 381,938 people
- By 2030
- 417,496 · +9.3%
- By 2040
- 486,684 · +27.4%
- By 2050
- 549,805 · +44.0%
- By 2075
- 687,078 · +79.9%
- By 2100
- 754,495 · +97.5%
Race, ethnicity, and origin ACS 2023
- Neighborhood character
- Predominantly White (79%)
- Race & ethnicity
- White 79% Asian 10% Two or more races 5% Hispanic / Latino 3% Black 3%
- Common ancestry
- Romanian 2% Slovak 2% Iranian 1%
- Foreign-born
- 10% · Canada, China, South Korea
- Languages at home
- 87% English-only · Other Indo-European 4% Other Asian/Pacific 4% Spanish 2%
Political lean MEDSL · Hamilton
- 2024 margin
- Lean R (+6.1) · D 46.0% · R 52.1% · Other 1.9%
- 2008→2024 swing
- +16.2pp toward D · 2008: -22.2pp · 2024: -6.1pp
- All cycles
- 2024: R+6.1 2020: R+6.8 2016: R+19.6 2012: R+34.3 2008: R+22.2
Not yet ingested
- Civics
- —
Market trends
- HPI YoY
- ▼ -48.93%
- Current HPI
- 213.5424
- Rent YoY
- ▲ 6.71%
- Metro
- Indianapolis-Carmel-Anderson, IN
- State GDP YoY
- ▲ 2.90%
- F500 in state
- 18
Industry mix (Fortune 500 HQ in IN)
| Industry | F500 HQs | Revenue |
|---|---|---|
| Industrial Machinery | 2 | $37B |
|
||
| Healthcare | 1 | $177B |
|
||
| Pharmaceuticals | 1 | $45B |
|
||
| Metals / Steel | 1 | $18B |
|
||
| Agriculture | 1 | $17B |
|
||
| Packaging | 1 | $12B |
|
||
Price history
+66.5% since first listed7 events — show timeline
- 2026-05-16 Pending — MIBOR as Distributed by MLS Grid
- 2026-05-06 Listed $425,000 MIBOR as Distributed by MLS Grid
- 2025-11-15 Listing Removed — MIBOR as Distributed by MLS Grid
- 2025-10-17 Price Changed $450,000 MIBOR as Distributed by MLS Grid
- 2025-08-07 Listed $459,995 MIBOR as Distributed by MLS Grid
- 2016-10-28 Listed $255,249 MIBOR as Distributed by MLS Grid
- 2016-10-28 Sold (MLS) $255,249 MIBOR as Distributed by MLS Grid
Property tax history
+66.7%/yrLatest (2025): $3,485 · -7.5% YoY. Source: county tax records.
Cash-flow waterfall
monthlySold comps — $/sqft
last 12 mo · ≤1 miLoading sold comps…