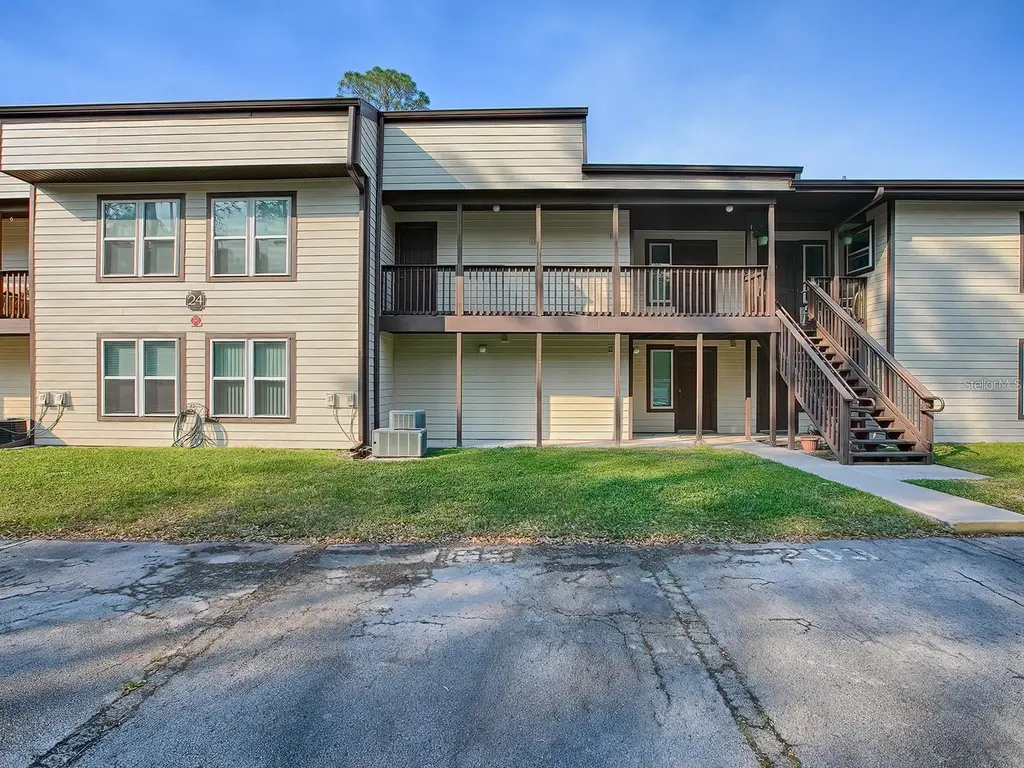
24104 Sandalwood Dr #104 · Wildwood, FL
Flood risk 1/10 · Minimal
- FEMA flood zone
- X (unshaded)
- Chance of flooding over 30 yrs
- 0.0%
- Est. flood insurance / yr
- $507 – $1,088
Fire risk 4/10 · Minor
- Est. fire insurance / yr
- $947 – $1,759
Heat risk 8/10 · Major
- Hot days now (above 108°F)
- 7 days/yr
- Hot days in 30 yrs
- 22 days/yr
Wind risk 9/10 · Severe
- Chance of severe wind over 30 yrs
- 99.0%
Air-quality risk 2/10 · Minimal
- Unhealthy air days now
- 1 days/yr
- Unhealthy air days in 30 yrs
- 2 days/yr
Risk factors via First Street. Map © Google.
Why this score? — see what drove the D grade
The composite is a weighted blend of 9 inputs, each scored 0–100. Each bar is that input's sub-score; the figure is the points it added to the 100-point composite (weight × sub-score).
- Cash flow +10.8/30.0
- ARV discount +7.5/15.0
- 1% rule +6.9/10.0
- Schools +5.2/10.0
- Livability +3.5/5.0
- Rent growth +3.2/5.0
- DSCR +3.1/10.0
- Condition / age +2.5/5.0
- Appreciation +0.0/10.0
$115,000
🖨 Deal sheet (PDF) 📄 Offer letter ✓ Due diligence
Listing remarks
* * Seller is offering $5000 in concessions to assist with closing costs * * Your quaint slice of heaven awaits you with this 1/1 condo located in Sandalwood. Imagine maintenance free living down the road from The Villages, Brownwood, UF Urgent Care, Publix, Lowes, and much more. Every room in this condo is spacious; no space was wasted. The HOA includes pest control, lawn maintenance, water, sewer and common areas, such as the pool. You don't want to miss out on this condo, this location, and this price! Call today to schedule a showing!
Key facts
- $400 HOA
- Community pool
- Built 1980
Property features AI
Finance
- Other: Homestead status: homestead claimed; No lease restrictions; Total rooms: 4; Living area approx. 900 sq ft (per appraiser / public records)
- HOA & community: HOA named Page Sermania; Monthly HOA fee $400 (includes common area taxes, pool, insurance, grounds maintenance); Community features: pool, sidewalks, tennis courts; Pets allowed
Exterior
- Utilities: Public sewer; Water connected; Electricity connected; Cable connected; Public utilities
- Home design: Condominium; One story; Faces southeast; Bottom-floor unit (floor 1)
- Construction: Stucco, frame and wood siding construction; Shingle roof; Slab foundation; Built as part of building 24/104
- Exterior features: Sidewalk; Tennis courts; Pool (community)
Interior
- Kitchen: Cooktop; Dishwasher; Microwave; Refrigerator
- Bedrooms: 1 bedroom
- Flooring: Tile; Wood
- Bathrooms: 1 full bathroom
- Heating & cooling: Central heating; Central air
- Interior features: Ceiling fans; Living room / dining room combo; Thermostat
- Laundry & utility: Washer hookup; Electric dryer hookup
Neighborhood map
What this means for you Summary
Snapshot
- This is a 1-bed/1.0-bath condo listed at $115k.
Deal economics
- At list price, monthly cash flow is $-52 ($-623/yr) — negative.
- To cash-flow at today's rent, offer at most $106k (8.0% below list).
- Meets the 1% rule at list price ($1k rent vs $115k).
- Recommended offer: $106k (8.0% below list) — sets the bar for cash-flow.
- Cap rate 5.8% vs local median 3.9% in Wildwood — top-decile yield for the area; either an underpriced asset or a hidden risk that comps aren't pricing in. Stress-test before assuming the spread holds.
Location & tenants
- Location reads 69/100 on livability (#471 in FL) — a middle-class / working-renter tenant base. Strengths: health & safety A+, cost of living A, crime A-; Watch: amenities F, commute F, employment D-.
- Sumter (rural): math 61% / reading 61% proficiency, ranked #11 of 73 in FL (top 15%) — acceptable for families but not a draw, mixed tenant base, ~2y average lease.
- Zoned schools: Wildwood Elementary School (math 49% / reading 52%, grade D+, #1,055 of 2,144 statewide, top 50%, 940 students, 76% FRL); South Sumter Middle School (math 55% / reading 54%, grade B-, #183 of 571 statewide, top 34%, 897 students, 61% FRL) — zoned schools average 68% FRL vs 51% district-wide (18 pts higher); higher-poverty schools than district average — tighter screening recommended.
- Market conditions: Rents rising (+2.9%/yr); 428 active listings in the ZIP; 1 comparable units currently listed for rent nearby; 3,961 units permitted in Sumter County in 2024 (248 in 5+ unit buildings).
Forward outlook
- Local home prices are declining (-3.0%/yr); year-one equity from $795 of loan paydown is wiped out by about $3k of value loss. Plan a longer hold.
- Sumter County population projected at +45% by 2050 — long-run rental-demand tailwind backs the buy-and-hold thesis.
Negotiation context
- It's been on market 55 days — a 3% lower offer ($112k) is reasonable based on typical stale-listing flexibility.
- 4 sale attempts since 4y ago with the ask held roughly flat each time — persistent listings suggest the price (not the market) is what's stuck; bring a comps-based counter.
Risks & watch-outs
- Watch-outs: HOA is 29% of rent.
- Climate carrying-cost: severe wind risk, 99% chance of damaging wind over 30y; extreme-heat days projected 7→22/yr by 2055 (HVAC capex compounding) — expect insurance premiums to compound above CPI over the hold.
Questions for the listing agent
- What do current leases actually rent for vs. the listed asking? Can we see a recent rent roll and the last 12 months of T-12 income?
- It's been on market 55 days. Have you received any prior offers? Is the seller open to a 8% concession, seller financing, or rate buy-down credit?
- What does the HOA fee cover, when was the last increase, and are there any pending special assessments or reserve-fund shortfalls?
- Any open or pending special assessments — roof, HVAC, plumbing, elevator, façade? What's the per-unit balance and payoff schedule, and is the seller paying it off at close or rolling it to the buyer?
- Is there a deadline driving the sale (1031 exchange, divorce, estate, relocation)? That informs how much negotiation room exists.
- The area grade is low — what's the realistic commute time and amenity access for the typical tenant pool here? Any planned neighborhood developments (good or bad) we should know about?
- What's the average days-on-market for RENTAL listings here right now (not sales)? A rising rental-DOM trend means longer vacancies and softer asking-rent achievability than the comps imply.
- What's the recent tenant-quality profile in this submarket — average credit score on applications, eviction rate, late-payment / NSF rate, and stable-employment percentage? A property-management company in the area should have these aggregated.
- How much new apartment / multifamily construction is in the pipeline within 1–3 miles? Heavy new supply (>2% of stock underway) typically softens rents 12–24 months out; light construction supports rent growth.
Investment metrics
- 1% rule
- 1.19% ✓
- Cap rate
- 5.75%
- Cash-on-cash
- -1.94%
- DSCR
- 0.91
- GRM
- 7.0
CMA / ARV
No comps found within radius.
Projected returns pro-forma
-3.0% appreciation · 2.85% rent growth · sell at horizon
- IRR
- -19.5%
- Equity multiple
- 0.32×
- Total profit
- $-21,921
- Equity at exit
- $17,147
- IRR
- -12.2%
- Equity multiple
- 0.28×
- Total profit
- $-23,265
- Equity at exit
- $9,943
Cash invested: $32,200 (down + closing). Projections, not guarantees.
Landlord ↔ Tenant lean methodology
- Overall (STATE)
- 87 Strongly Landlord-Friendly
- State Florida
- 87 Strongly Landlord-Friendly · R+3
- County
- — inherits STATE
- City
- — inherits STATE
ZIP-level market 34785
- Home prices YoY
- -10.7%
- Rents YoY
- 2.9%
- Active inventory
- 428
- Price-to-rent
- 7.0×
Monthly cashflow live
- Estimated rent
- $1,367 medium interval (Pro) →
- Mortgage (P&I)
- −$603
- Tax from tax record
- −$81 /mo · $974/yr
- Insurance
- −$48
- HOA
- −$400
- Vacancy / Maint / Mgmt
- −$287
- Net cashflow
- $-52
Break-even live
Sensitivity live
| Price | -10% $13 | -5% $-19 | +0% $-52 | +5% $-84 | +10% $-117 |
|---|---|---|---|---|---|
| Rent | -10% $-160 | -5% $-106 | +0% $-52 | +5% $2 | +10% $56 |
| Rate | -1.0pp $6 | -0.5pp $-23 | base $-52 | +0.5pp $-82 | +1.0pp $-112 |
UW: 25.0% down · 7.5% · 30yr · 1.5% tax · 5.0% vac · 8.0% maint · 8.0% mgmt
Financing live
Cash to close
- Down payment
- $28,750
- Closing costs
- $3,450
- Reserves months
- —
- Total cash needed
- —
Loan-product check · same deal, 3 products live
Conventional
25% down · 7.5% · 30yr
- Down + closing
- —
- Monthly P&I
- —
- Monthly cashflow
- —
- DSCR
- —
- Eligible?
- —
Personal DTI + credit; lowest rate.
DSCR
20% down · 8.5% · 30yr
- Down + closing
- —
- Monthly P&I
- —
- Monthly cashflow
- —
- DSCR
- —
- Eligible?
- —
No personal income docs; deal must DSCR.
Hard money
10% down · 12.0% · 12mo
- Down + closing
- —
- Monthly P&I
- —
- Monthly cashflow
- —
- DSCR
- —
- Eligible?
- —
Short-term bridge; refi at stabilization.
Rent comps 1 comps
| Address | Beds | Baths | Sqft | Rent | $/sqft | DOM | Units | Dist |
|---|---|---|---|---|---|---|---|---|
| 21204 Sandalwood Dr Unit 21-204 Wildwood, FL | 2.0 | 2.0 | 1110 | $1,550 | $1.40 | 23d | 1 | 0.08mi |
HOA detail condo
- Monthly dues
- $400 · $4,800/yr
- Likely covers
- watersewerpool
- Assessments
- None detected in remarks — confirm with the listing agent.
Listing history 29 events
-
2026-06-22days on market $115,000 Active 55 DOM
-
2026-06-19days on market $115,000 Active 53 DOM
-
2026-06-18days on market $115,000 Active 52 DOM
-
2026-06-17days on market $115,000 Active 51 DOM
-
2026-06-16days on market $115,000 Active 50 DOM
-
2026-06-15days on market $115,000 Active 49 DOM
-
2026-06-14days on market $115,000 Active 47 DOM
-
2026-06-13days on market $115,000 Active 46 DOM
-
2026-06-10days on market $115,000 Active 44 DOM
-
2026-06-09days on market $115,000 Active 43 DOM
-
2026-06-08days on market $115,000 Active 42 DOM
-
2026-06-07days on market $115,000 Active 41 DOM
-
2026-06-02days on market $115,000 Active 36 DOM
-
2026-06-01days on market $115,000 Active 35 DOM
-
2026-05-31days on market $115,000 Active 34 DOM
-
2026-05-30days on market $115,000 Active 33 DOM
-
2026-04-27$115,000 Active
-
2025-06-30historical
-
2025-03-12$122,500 Active
-
2024-10-29historical
-
2024-08-02price $119,900
-
2024-06-26price $124,900
-
2024-03-04$129,900 Active
-
2022-06-13soldstatus $125,000 Closed
-
2022-05-26soldstatus $125,000
-
2022-04-12status Pending
-
2022-04-04$130,000 Active
-
2001-06-28soldstatus $33,000
-
1990-07-01soldstatus $27,400
ⓘ Source: listings_history table (triggers on properties + properties_extension) + one-shot
backfill from property_details.listing_events for pre-trigger history.
Tax reassessment forecast FL · Resets to sale price
- Current annual tax
- $974 · $81/mo
- Projected year-2 tax
- $974 · $81/mo
- Expected delta
- $0/yr ($0/mo · 0.0%)
ⓘ Screening estimate from a state-policy table — verify with the county assessor before closing.
Climate risk First Street
- Flood 1/10 Low FEMA zone X (unshaded) · 0% chance over 30 yrs
- Wildfire 4/10 Moderate
- Heat 8/10 Severe 7 d/yr ≥108°F today · 22 d/yr by 30 yrs out
- Wind 9/10 Extreme 99% chance of damaging wind over 30 yrs
- Air quality 2/10 Low 1 unhealthy d/yr today · 2 by 30 yrs out
Nearby sold comps map
Loading sold comps map…
Walkable amenities ~0.75 mi
Loading nearby amenities…
Taxation est. · year 1
- Rental income
- $16,409
- − Mortgage interest
- −$6,442
- − Property taxes
- −$974
- − Insurance
- −$575
- − Repairs & maintenance
- −$1,313
- − Management
- −$1,313
- − HOA
- −$4,800
- − Depreciation
- −$3,345
- Taxable loss
- −$2,353
- Est. tax savings @ 24.0%
- +$565
- After-tax cash flow
- $-58/yr
For passive investors: Depreciation is non-cash, so a rental often shows a tax loss while cash-flowing — sheltering income. Rental losses are passive: they offset passive income freely, and up to $25,000/yr can offset ordinary (W-2) income if you actively participate and your MAGI is under $100k (phasing out to $0 by $150k); unused losses carry forward. On sale, claimed depreciation is recaptured at up to 25%, and gains may owe capital-gains tax (a 1031 exchange can defer both). Figures are a year-1 estimate at your 24.0% rate — not tax advice; consult a CPA.
Schools (NCES district)
- District
- Sumter
- NCES district ID
- 1201800
- Math proficiency
- 61% ▼ -4.00%
- Reading proficiency
- 61% ▼ -2.00%
- Median HH income
- $48,240
- Composite
- 51.74/100
- National rank
- #1682
- State rank
- #11 of 73 in FL
Livability — Wildwood
- Score
- 69/100
- State rank
- #471
- US rank
- #8500
Category grades
Schools grade is shown separately in the Schools card above.
Census & demographics
- County
- Sumter County · 110,591 people
- City population
- 21,568
- Metro
- The Villages, FL
- Population (ZIP)
- 21,568
- Household income
- $66,136
- Rent vs Own
- Severe rent burden
- 730.0
Population outlook (Sumter County) Hauer SSP2
- Today (2025)
- 161,172 people
- By 2030
- 180,083 · +11.7%
- By 2040
- 209,892 · +30.2%
- By 2050
- 234,186 · +45.3%
- By 2075
- 284,602 · +76.6%
- By 2100
- 317,039 · +96.7%
Race, ethnicity, and origin ACS 2023
- Neighborhood character
- Diverse neighborhood (Simpson 0.62)
- Race & ethnicity
- White 52% Black 29% Hispanic / Latino 14% Two or more races 3%
- Hispanic origin (detail)
- Mexican 4% Puerto Rican 2%
- Common ancestry
- Romanian 3% Lithuanian 2% Italian 2%
- Foreign-born
- 11% · Canada, Jamaica
- Languages at home
- 85% English-only · Spanish 12% Other Indo-European 1% French/Haitian/Cajun 1%
Political lean MEDSL · Sumter
- 2024 margin
- Solid R (+37.6) · D 30.9% · R 68.6%
- 2008→2024 swing
- -10.6pp toward R · 2008: -27.0pp · 2024: -37.6pp
- All cycles
- 2024: R+37.6 2020: R+36.1 2016: R+39.2 2012: R+34.9 2008: R+27.0
Not yet ingested
- Civics
- —
Market trends
- HPI YoY
- ▼ -32.14%
- Current HPI
- 267.9137
- Rent YoY
- ▲ 2.85%
- Metro
- The Villages, FL
- State GDP YoY
- ▲ 3.28%
- F500 in state
- 36
Industry mix (Fortune 500 HQ in FL)
| Industry | F500 HQs | Revenue |
|---|---|---|
| Industrial Technology | 2 | $29B |
|
||
| Insurance | 2 | $17B |
|
||
| Retail | 1 | $60B |
|
||
| Technology Distribution | 1 | $58B |
|
||
| Homebuilding | 1 | $35B |
|
||
| Technology Manufacturing | 1 | $35B |
|
||
Price history
+319.7% since first listed13 events — show timeline
- 2026-04-27 Listed $115,000 Stellar MLS as Distributed by MLS Grid
- 2025-06-30 Listing Removed — Stellar MLS as Distributed by MLS Grid
- 2025-03-12 Listed $122,500 Stellar MLS as Distributed by MLS Grid
- 2024-10-29 Listing Removed — Stellar MLS as Distributed by MLS Grid
- 2024-08-02 Price Changed $119,900 Stellar MLS as Distributed by MLS Grid
- 2024-06-26 Price Changed $124,900 Stellar MLS as Distributed by MLS Grid
- 2024-03-04 Listed $129,900 Stellar MLS as Distributed by MLS Grid
- 2022-06-13 Sold (MLS) $125,000 Stellar MLS as Distributed by MLS Grid
- 2022-05-26 Sold (Public Records) $125,000 Public Records
- 2022-04-12 Pending — Stellar MLS as Distributed by MLS Grid
- 2022-04-04 Listed $130,000 Stellar MLS as Distributed by MLS Grid
- 2001-06-28 Sold (Public Records) $33,000 Public Records
- 1990-07-01 Sold (Public Records) $27,400 Public Records
Property tax history
+7.5%/yrLatest (2025): $974 · +0.9% YoY. Source: county tax records.
Cash-flow waterfall
monthlySold comps — $/sqft
last 12 mo · ≤1 miLoading sold comps…